

The frog-themed meme coin, PEPE, has been trading within a falling wedge pattern since May 27. Currently priced at $0.0000077, its value has dropped by 52% during this period.
PEPE’s price could decline further, as it appears poised to break below the lower line of its falling wedge, which would signal a continuation of the downtrend.
Pepe Attempts to Find New Lows
A falling wedge pattern occurs when an asset’s price moves between two downward-sloping trend lines. The upper trend line serves as resistance, while the lower trend line acts as support.
Typically, despite the downtrend within the wedge, this pattern is considered bullish because the price often breaks out above the upper trend line upon completion, leading to an upward movement.
However, PEPE may be an exception. Since August 25, the meme coin’s price has been on a downtrend, dropping by 15% and pushing it closer to the lower line of the falling wedge.
When an asset’s price breaks below the lower trendline of a falling wedge, it invalidates the bullish projection typically associated with this pattern and suggests that the downtrend may continue.
PEPE’s technical setup supports this possibility. The altcoin has fallen below key moving averages, trading beneath both its 20-day exponential moving average (EMA) and its 50-day simple moving average (SMA).
The 20-day EMA reflects an asset’s average price over the past 20 trading days, while the 50-day SMA tracks its average closing price over the past 50 days. When an asset’s price is below these averages, it indicates weakening momentum and the likelihood of continued downtrend as selling pressure intensifies. If PEPE reverses course and begins an uptrend, these moving averages will act as resistance, potentially leading to another price correction.
Read more: Pepe (PEPE) Price Prediction 2024/2025/2030
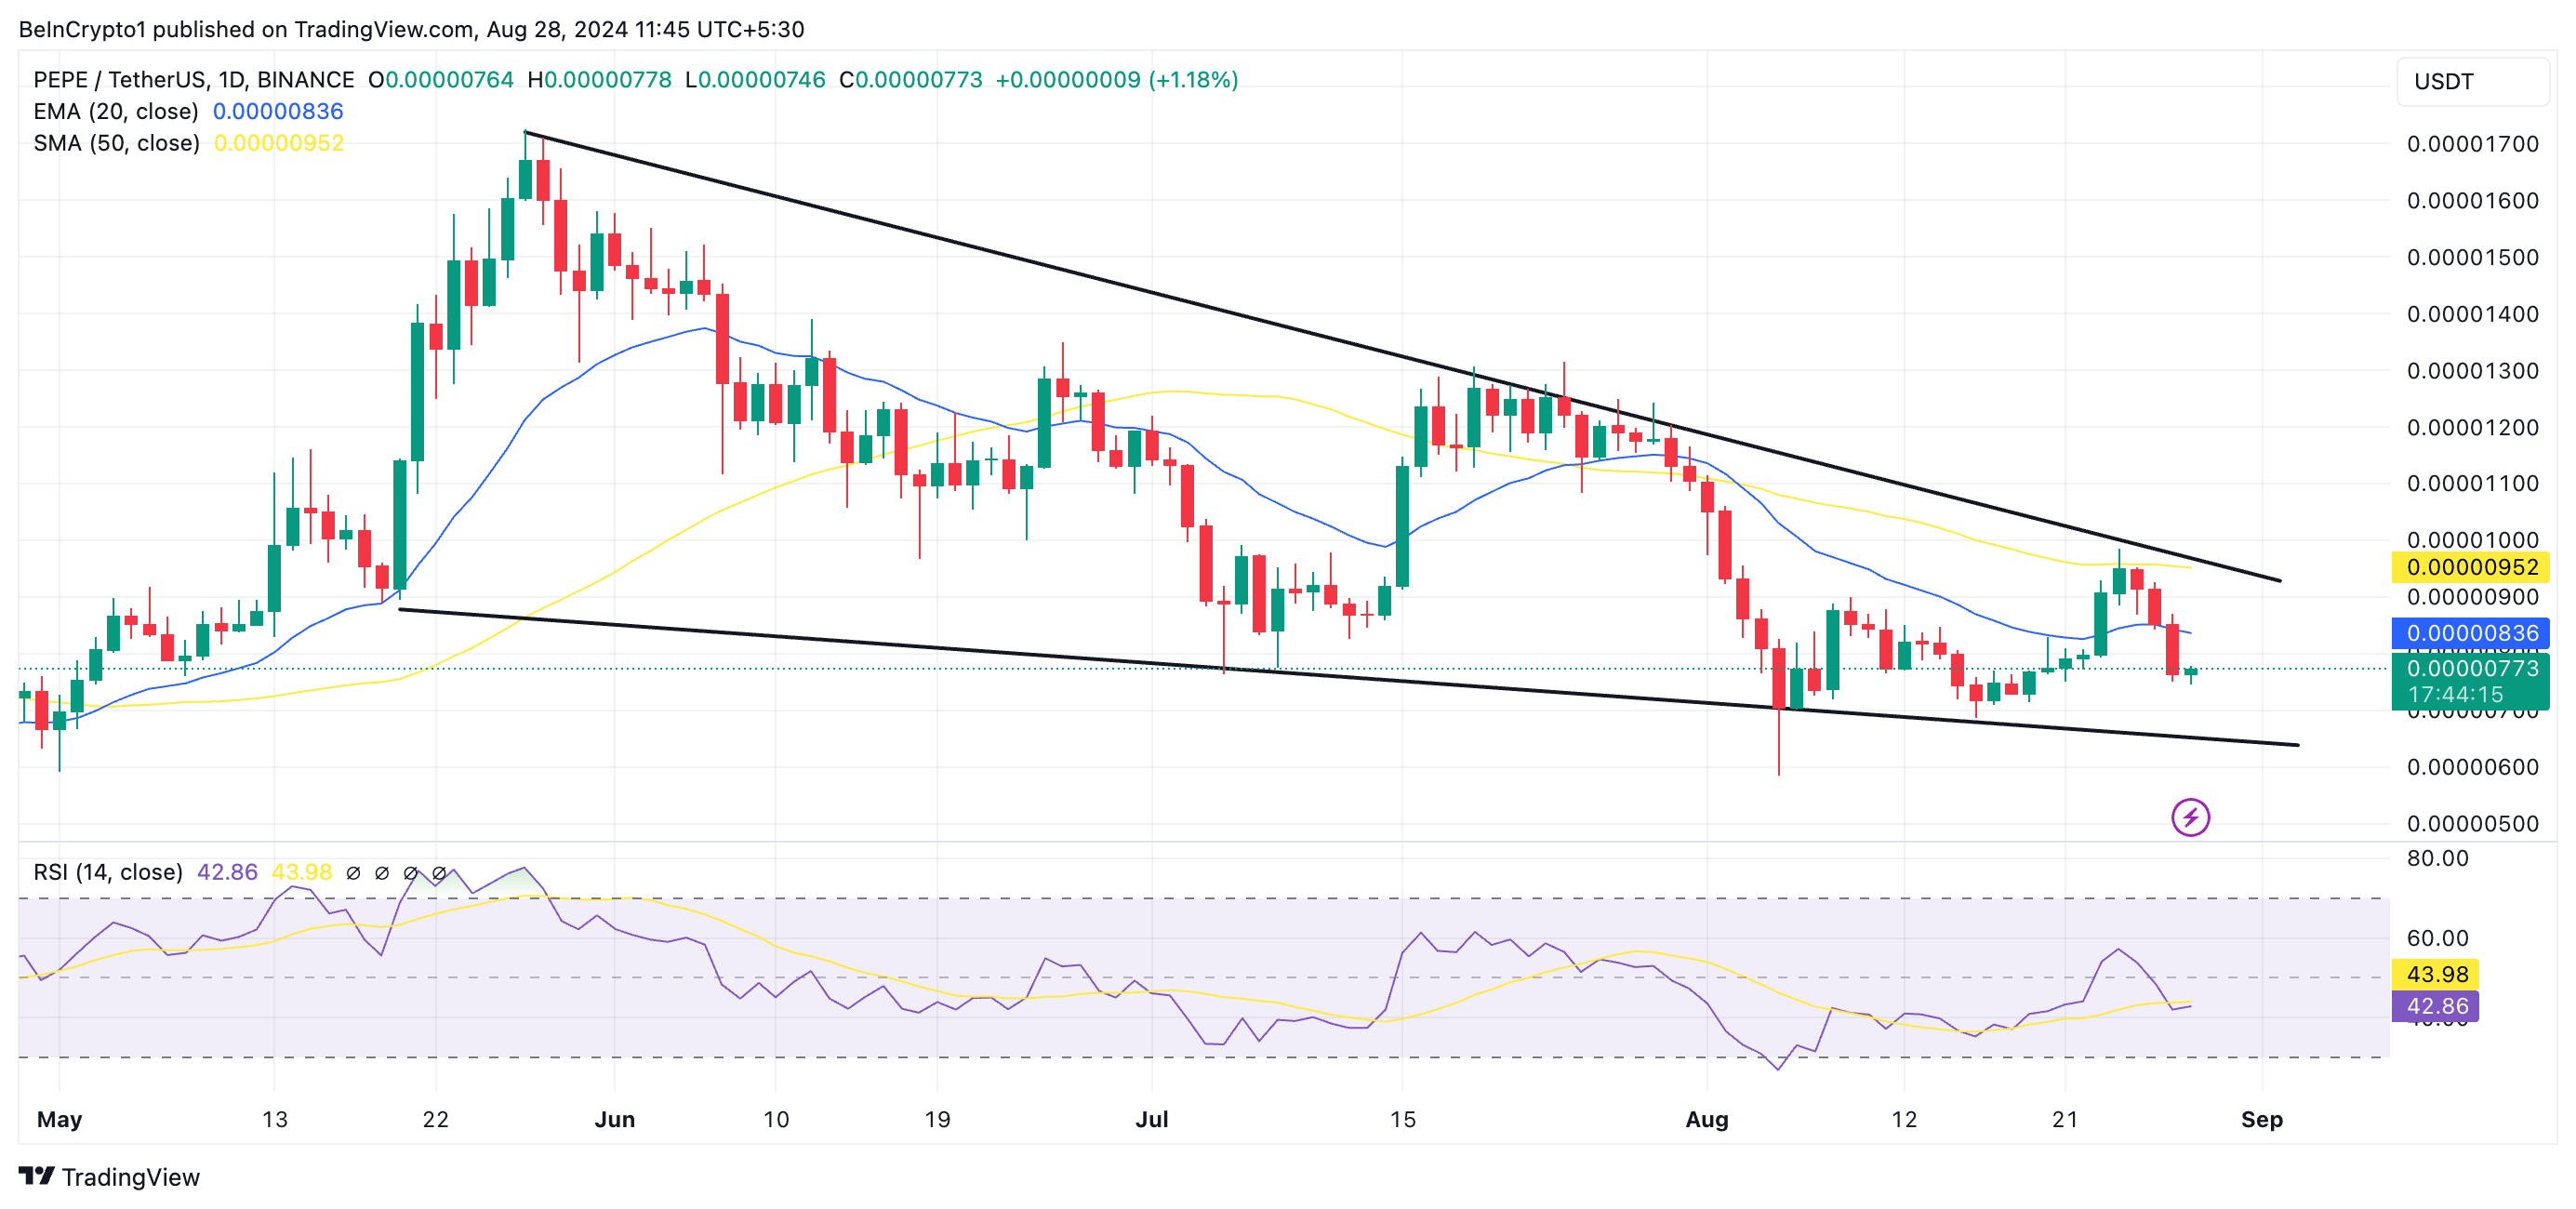
Additionally, PEPE’s Relative Strength Index (RSI) remains below its neutral line and has been in this position for most of the past month. The RSI measures whether an asset is overbought or oversold.
At 43.13 and declining at press time, PEPE’s RSI suggests low buying activity among market participants.
PEPE Price Prediction: All Lies With the Bulls
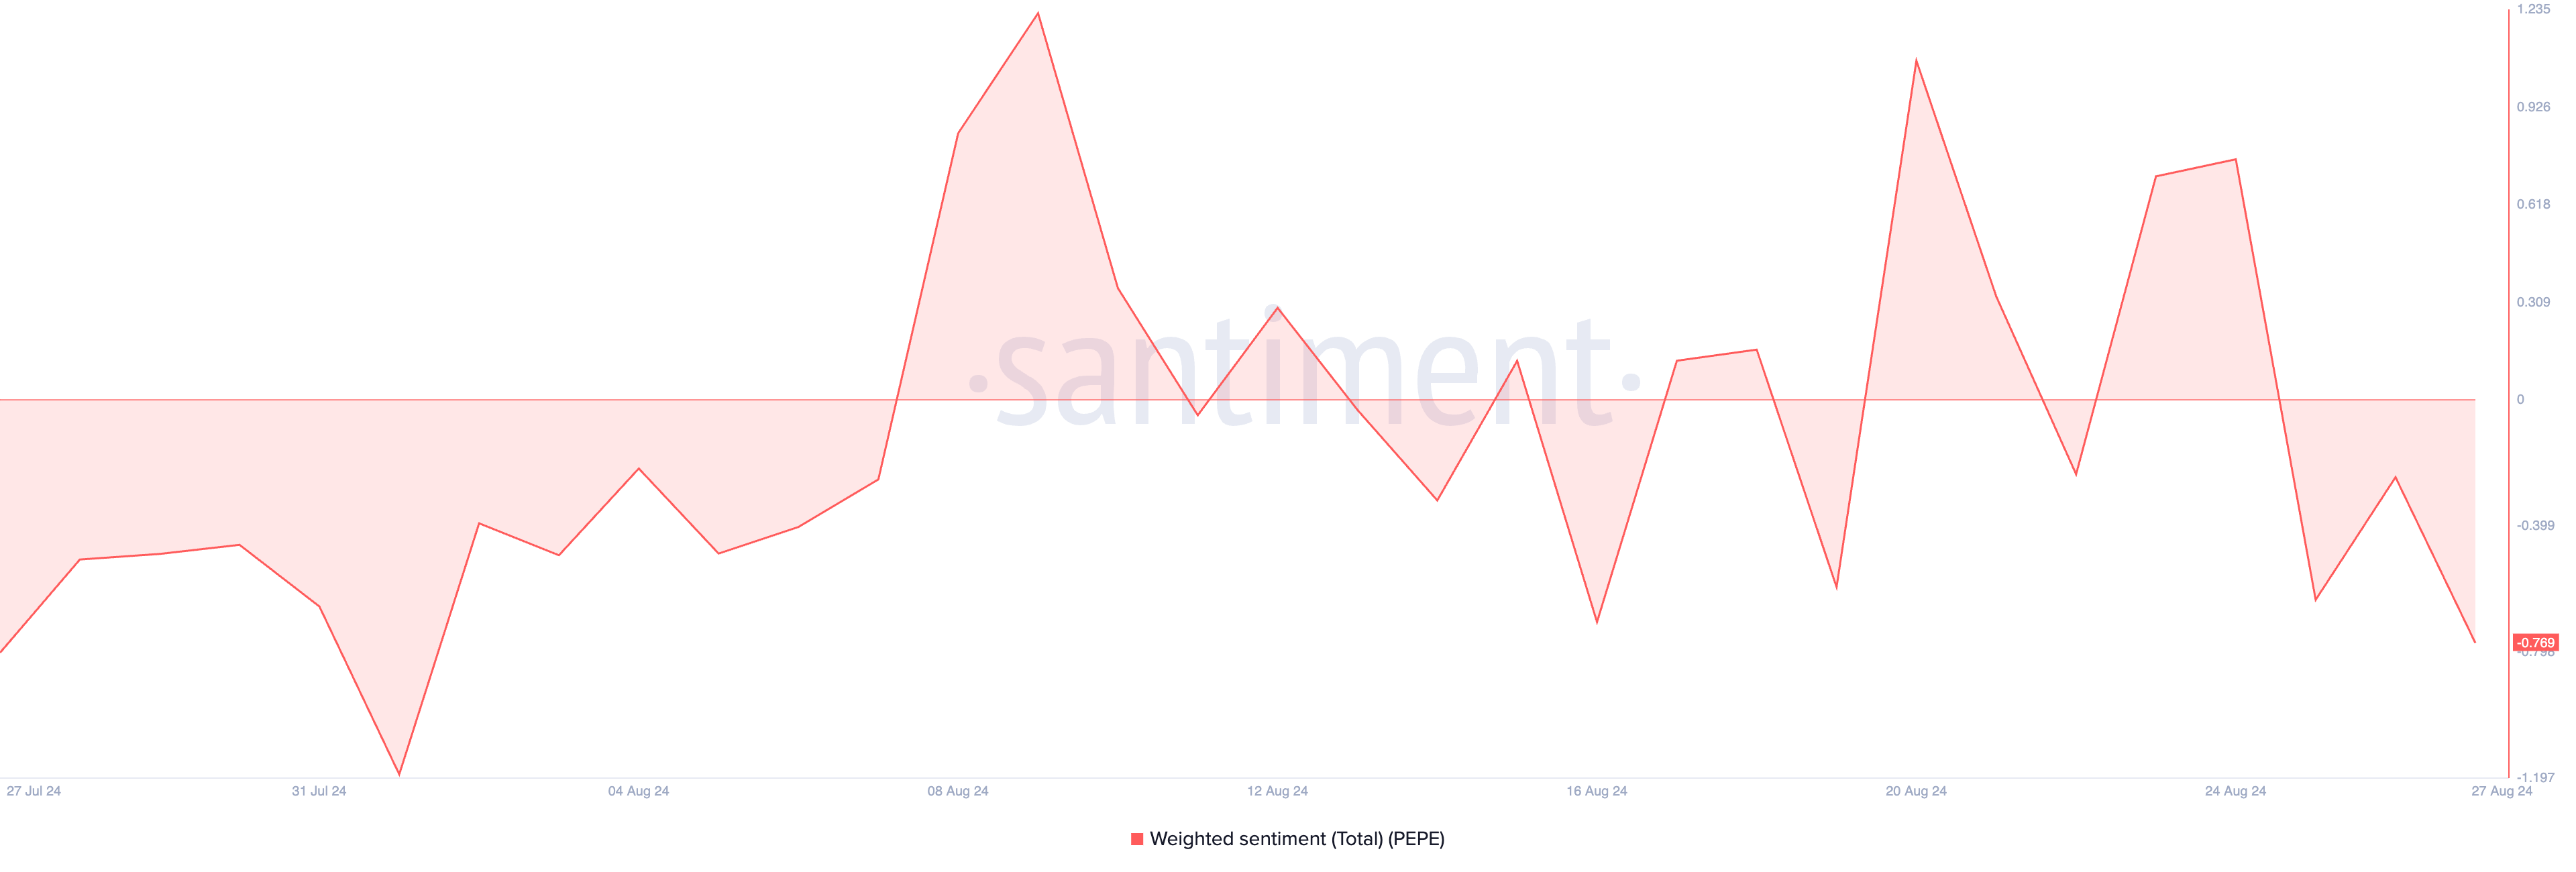
The bearish sentiment surrounding PEPE is further evidenced by its negative weighted sentiment, which currently stands at -0.76.
A weighted sentiment value below zero indicates that the overall online conversation about the asset is predominantly negative. This negativity often signals a continued decline in the asset’s price.
If PEPE bulls fail to defend the lower line of the falling wedge, the meme coin’s price could decline to its August 5 low of $0.0000059, representing a 28% drop from its current value.
Read more: Pepe: A Comprehensive Guide to What It Is and How It Works
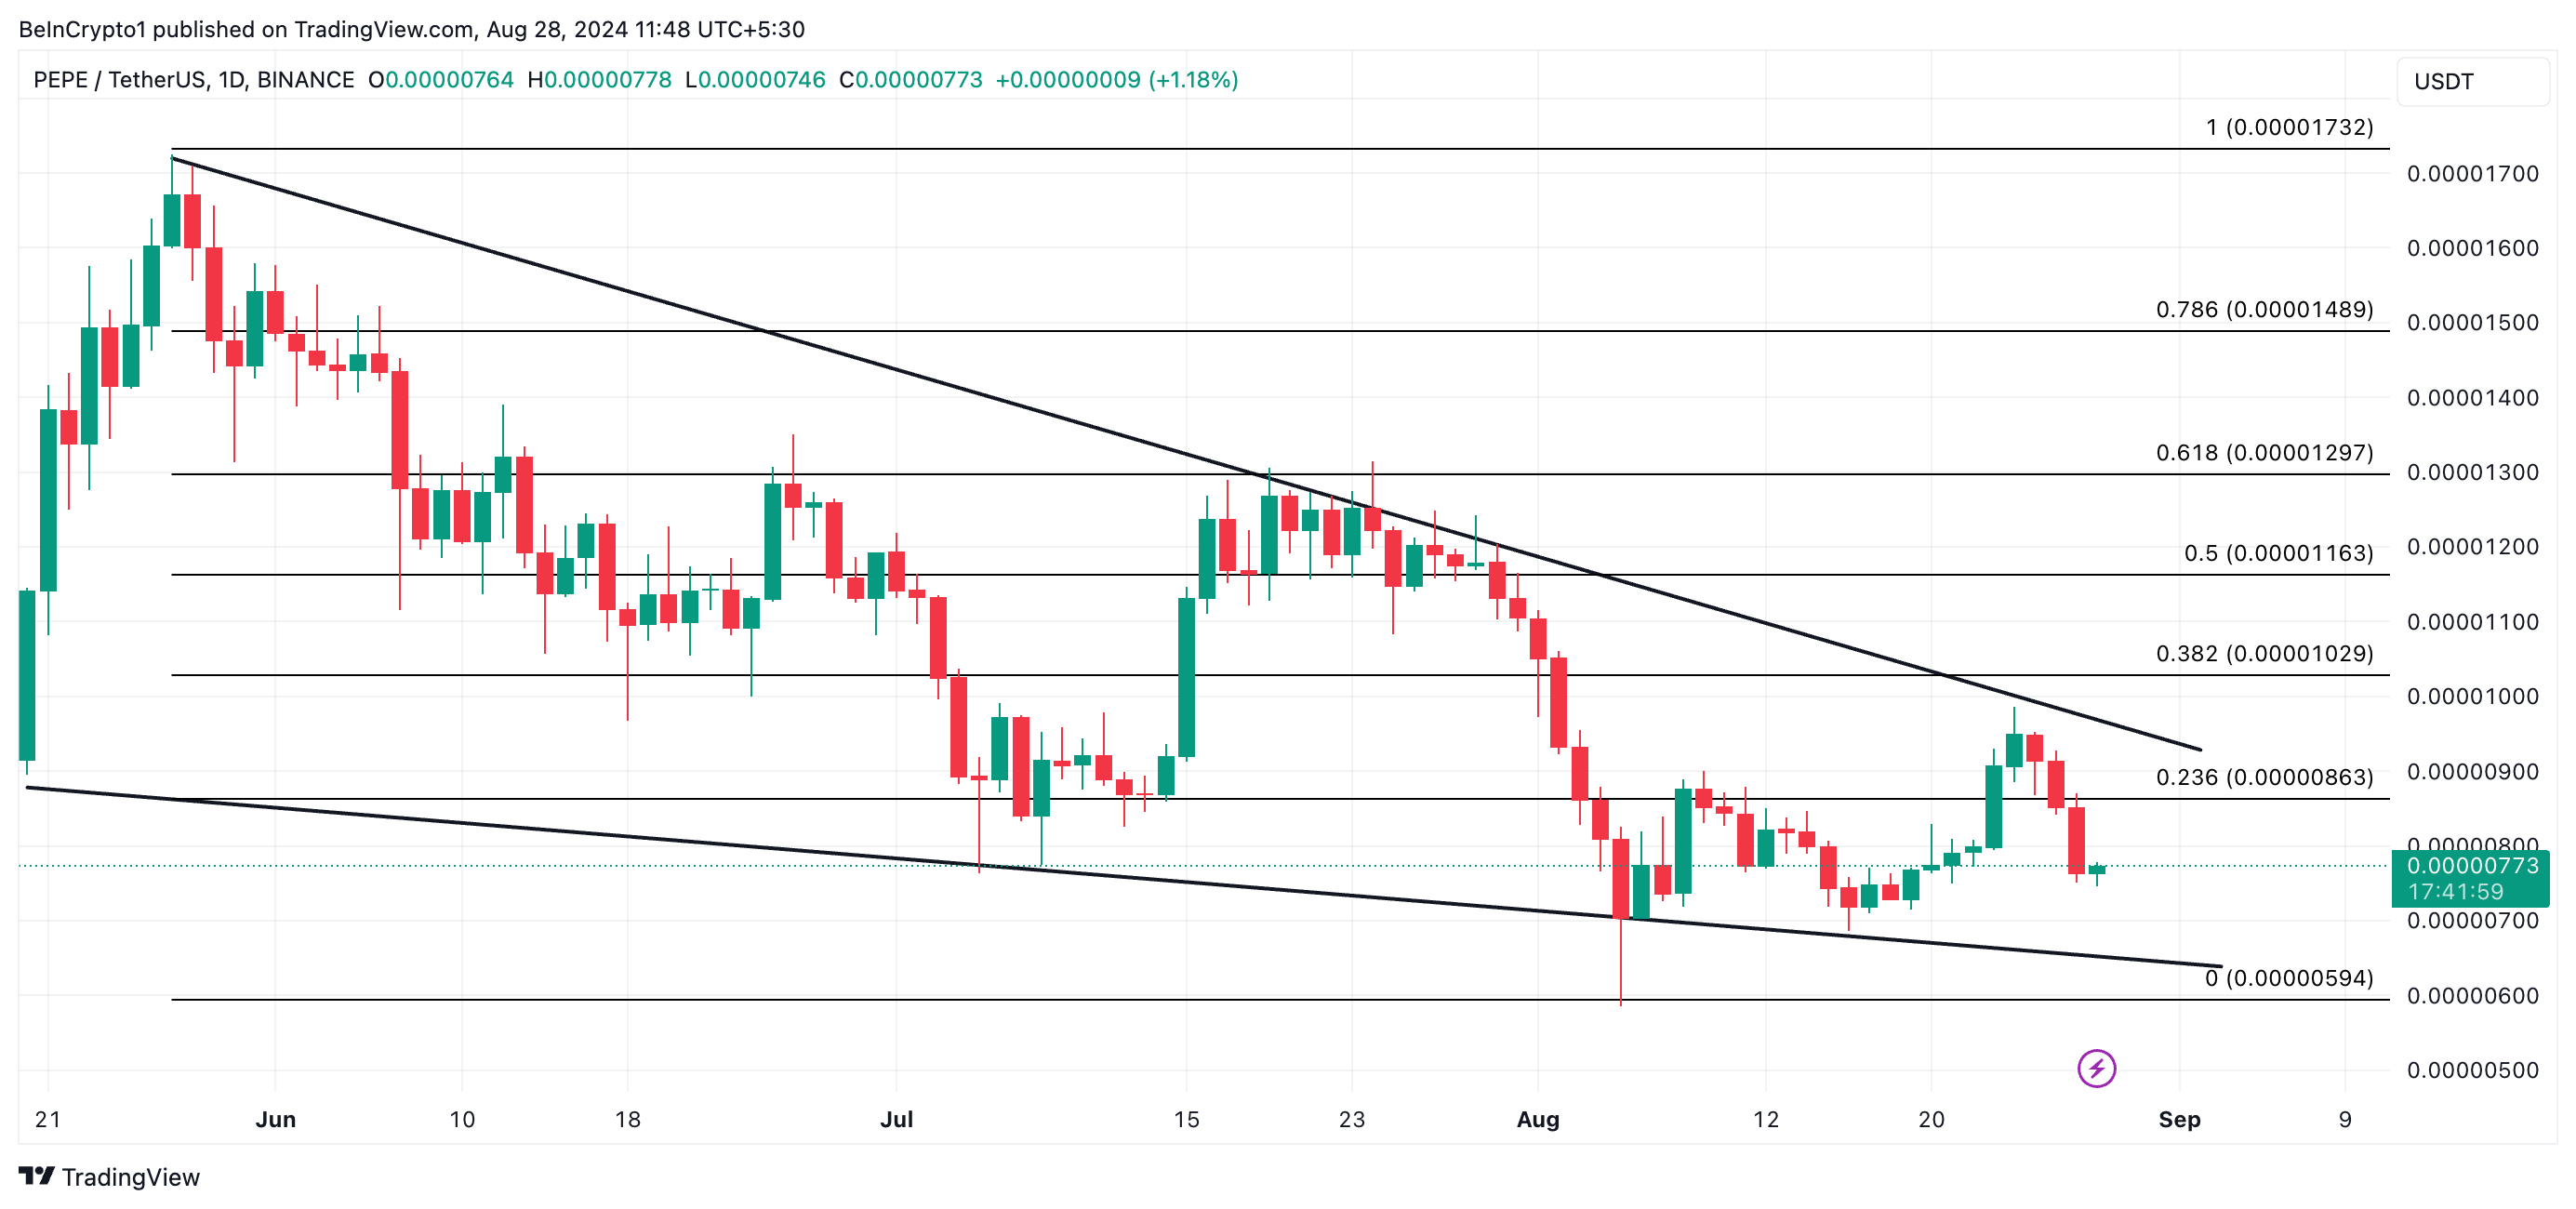
However, if the current trend reverses and PEPE resumes its uptrend, its price could rise to $0.0000086.
Disclaimer
In line with the Trust Project guidelines, this price analysis article is for informational purposes only and should not be considered financial or investment advice. BeInCrypto is committed to accurate, unbiased reporting, but market conditions are subject to change without notice. Always conduct your own research and consult with a professional before making any financial decisions. Please note that our Terms and Conditions, Privacy Policy, and Disclaimers have been updated.
Source link
Abiodun Oladokun
https://beincrypto.com/pepe-poised-for-bearish-breakout/
2024-08-28 09:00:00