the token powering the decentralized oracle network Chainlink, presents a potential buying opportunity for investors looking to capitalize on current market weakness. However, purchasing LINK at its current low carries risk, as there’s no assurance that its price will not decline further.
As evidenced by readings from its technical setup, bears are seeking to force LINK’s price to new lows.
Chainlink Bears Hold On Firmly
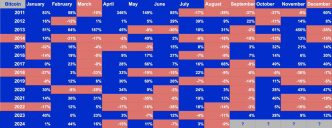
Over the past month, LINK’s value has maintained a downtrend. Exchanging hands at $10.24 at press time, the token’s value has declined by 12% over the past 30 days. This drop in value has presented an opportunity for traders looking to “buy the dip.”
This is based on an assessment of the altcoin’s market value to realized value (MVRV) ratios over 30-day and 90-day moving averages. Santiment’s data shows LINK’s 30-day and 90-day MVRV ratios at -4.84% and -17.66%, respectively.
Historically, when an asset’s MVRV ratio is below zero, it is deemed undervalued. This means that the asset’s current price is lower than the average price of all its tokens in circulation. Many view this as a buying opportunity, as they believe they can buy the asset at a low price, hold it, and later sell it at a high price, pocketing gains.
However, for traders looking to buy LINK’s “dip,” the journey to profitability may not be as easy. The bearish sentiment trailing the altcoin is strengthening, and its price may witness a further downturn.
Since closing at a monthly peak of $12.35 on August 24, LINK trended within a descending triangle, a bearish pattern reflecting the price drop. As selling pressure gained momentum, it pushed the token’s price below the lower trend line of the triangle, which formed support at $10.25.
Read more: How To Buy Chainlink (LINK) and Everything You Need To Know
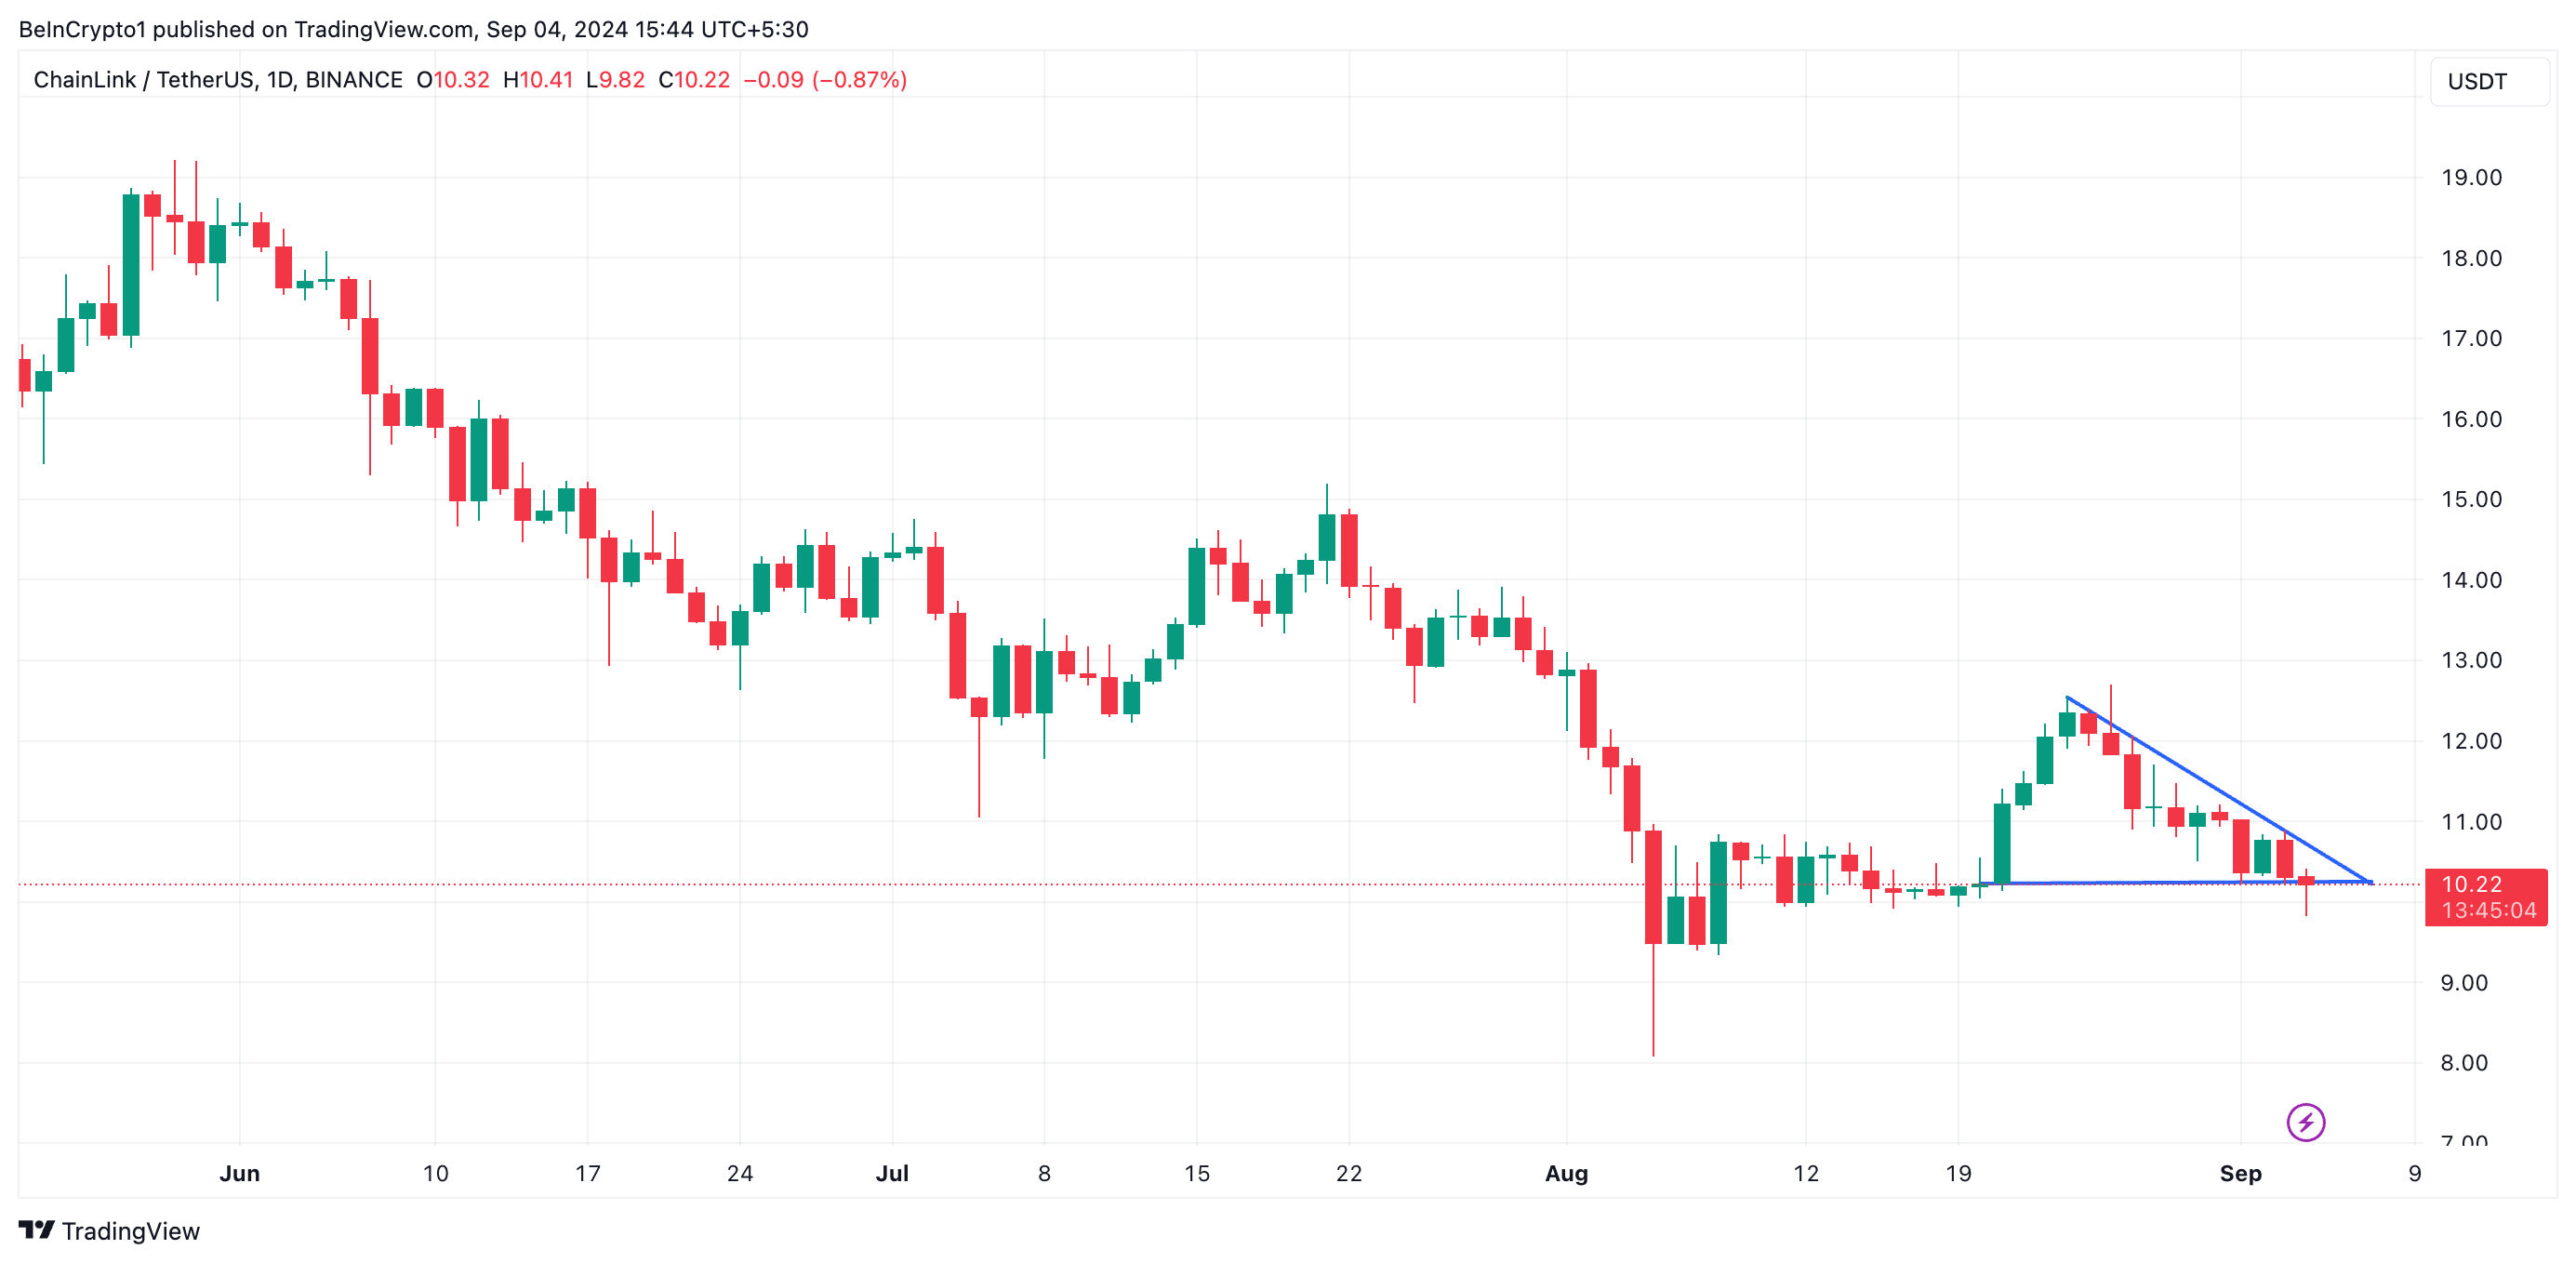
When an asset’s price falls below a support level, selling power has overpowered buying activity and hints at a potential continuation of the downtrend.
LINK Price Prediction: A Failed Retest May Cause a 21% Price Decline
An assessment of LINK’s Moving Average Convergence/Divergence (MACD) indicator confirms the likelihood of this downtrend in the short term.
LINK’s MACD line (blue) crossed below its signal line (orange) on September 1, signaling the shift in trend from bullish to bearish. This indicator tracks an asset’s price trends and direction.
When set up this way, it suggests that the downtrend is strengthening. Traders view it as an opportunity to exit long and take short positions.
Read more: Chainlink (LINK) Price Prediction 2024/2025/2030
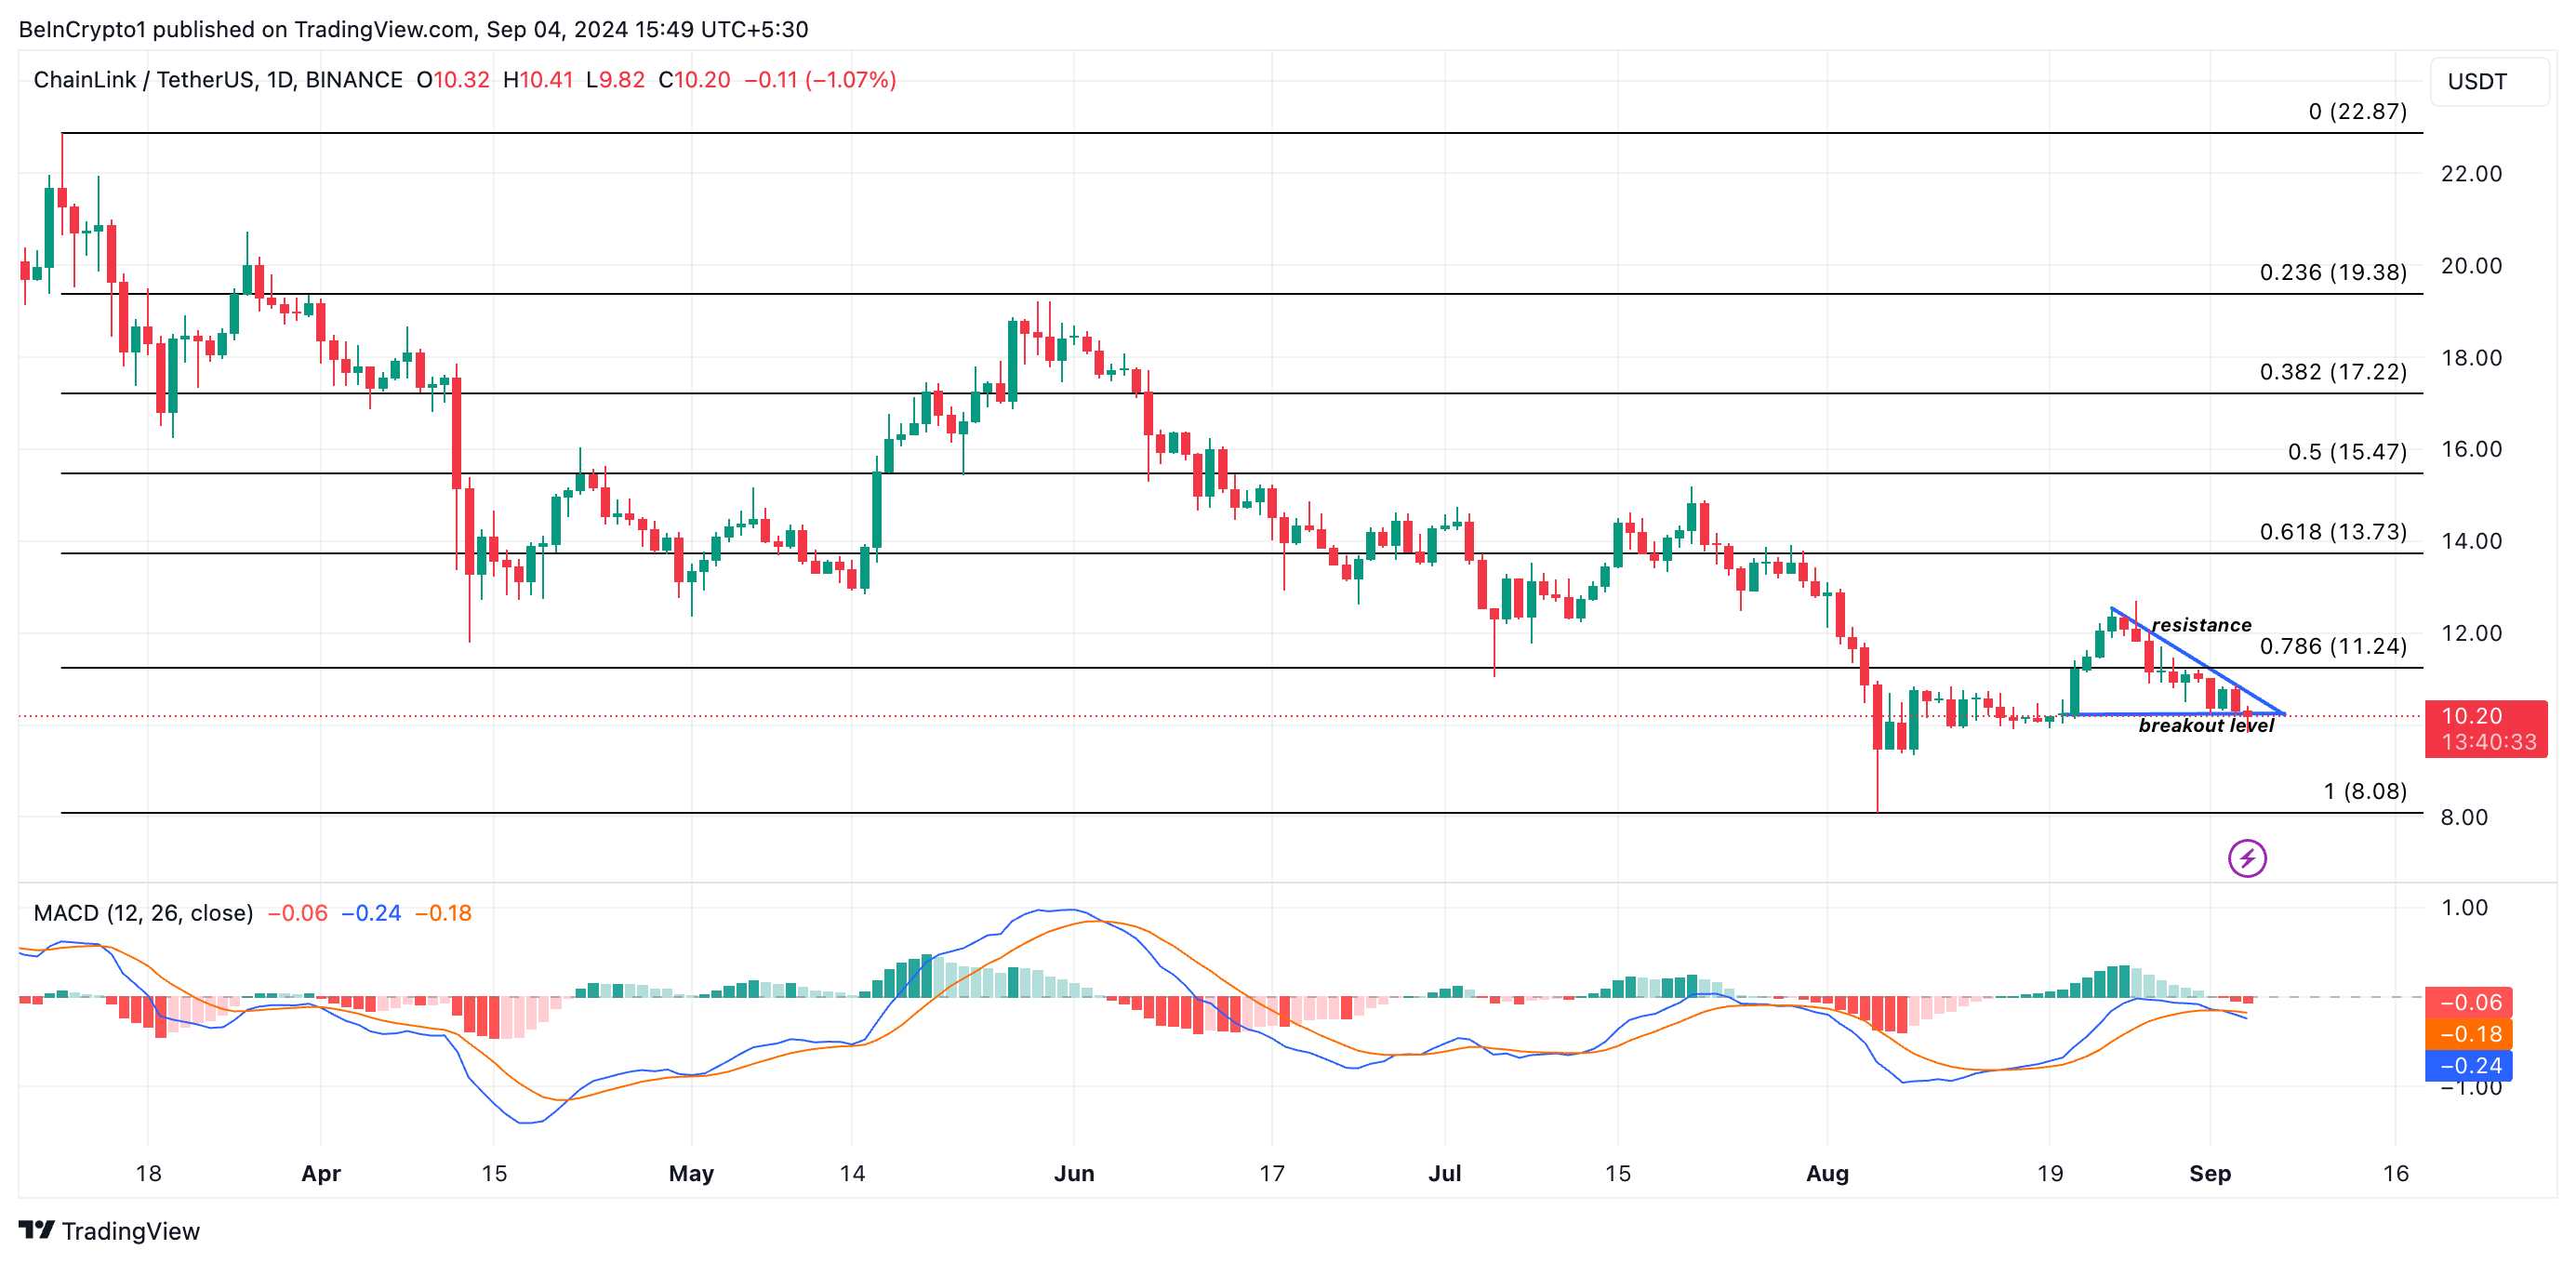
If the selling pressure strengthens further, LINK’s attempt to retest its breakout level will fail, and its current downtrend will continue unhindered. Should this happen, the token’s price will fall to $8.08, a low it last observed during the general market downturn on August 5.
However, if the altcoin witnesses a resurgence in demand and successfully retests its breakout level, it will rally past support and seek to break above its resistance level. A successful break above resistance will cause LINK to trade at $13.73.
Disclaimer
In line with the Trust Project guidelines, this price analysis article is for informational purposes only and should not be considered financial or investment advice. BeInCrypto is committed to accurate, unbiased reporting, but market conditions are subject to change without notice. Always conduct your own research and consult with a professional before making any financial decisions. Please note that our Terms and Conditions, Privacy Policy, and Disclaimers have been updated.
Source link
Abiodun Oladokun
https://beincrypto.com/chainlink-bears-strengthen-hold/
2024-09-04 19:50:04