
Ethereum remains in a downward trend, with price action showing insufficient bullish momentum for a reversal.
In the near term, the cryptocurrency is likely to enter a consolidation phase within a critical range, with mild bearish retracements seeming far more likely.
By Shayan
The Daily Chart
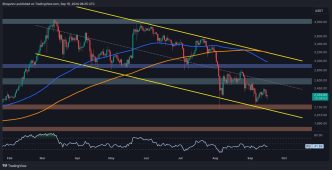
On the daily chart, Ethereum has been in a sustained downtrend since getting rejected at its yearly high of $4K. The price has consistently formed lower lows and lower highs, creating a descending channel that reflects the overall bearish market sentiment. This pattern highlights the pessimism among market participants regarding ETH’s broader trajectory.
Recently, the price was rejected at the channel’s middle boundary around $2.7K, leading to another bearish retracement.
Currently, ETH is trading within a key range, supported by the $2K level and capped by the channel’s middle boundary near the $2.5K resistance. Until the price breaks out of this range, further consolidation is expected.
The 4-Hour Chart
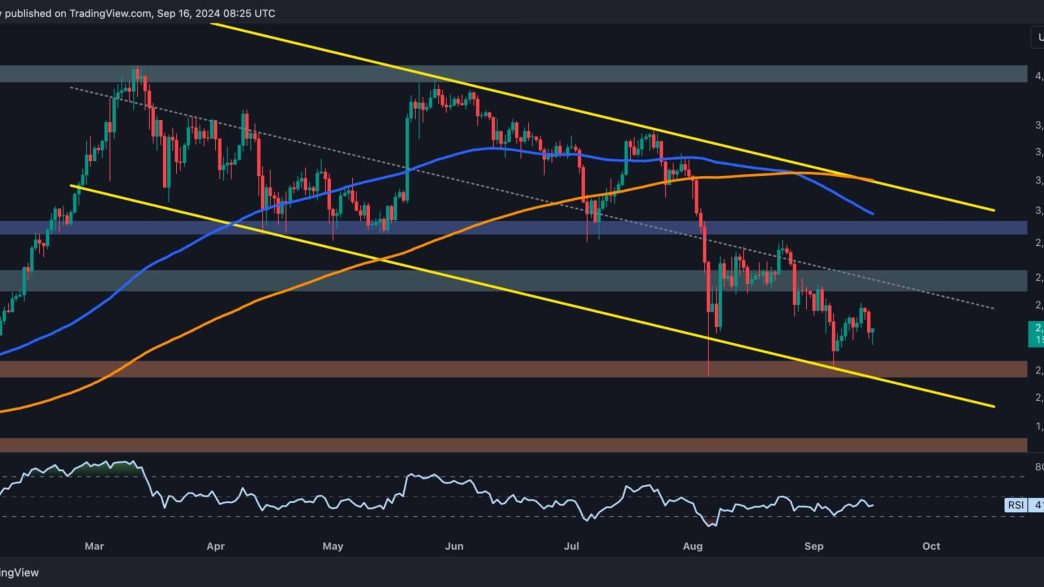
On the 4-hour chart, Ethereum encountered increased selling pressure around the resistance zone between the 0.5 ($2.6K) and 0.618 ($2.7K) Fibonacci levels, resulting in a significant drop toward $2K. The current price action indicates that bearish sentiment still dominates the market, with sellers likely aiming to push the price below its current yearly low at the $2K level.
ETH is now forming an ascending wedge pattern and consolidating near the lower boundary of this formation. A break below it could result in a further decline toward $2K, potentially breaching this support.
However, if buying pressure increases in the short term, Ethereum may see a bullish rebound, with the price retracing toward the 0.5 Fibonacci level at $2.6K.

By Shayan
The perpetual futures market plays a crucial role in shaping the overall price movement of the broader crypto market.
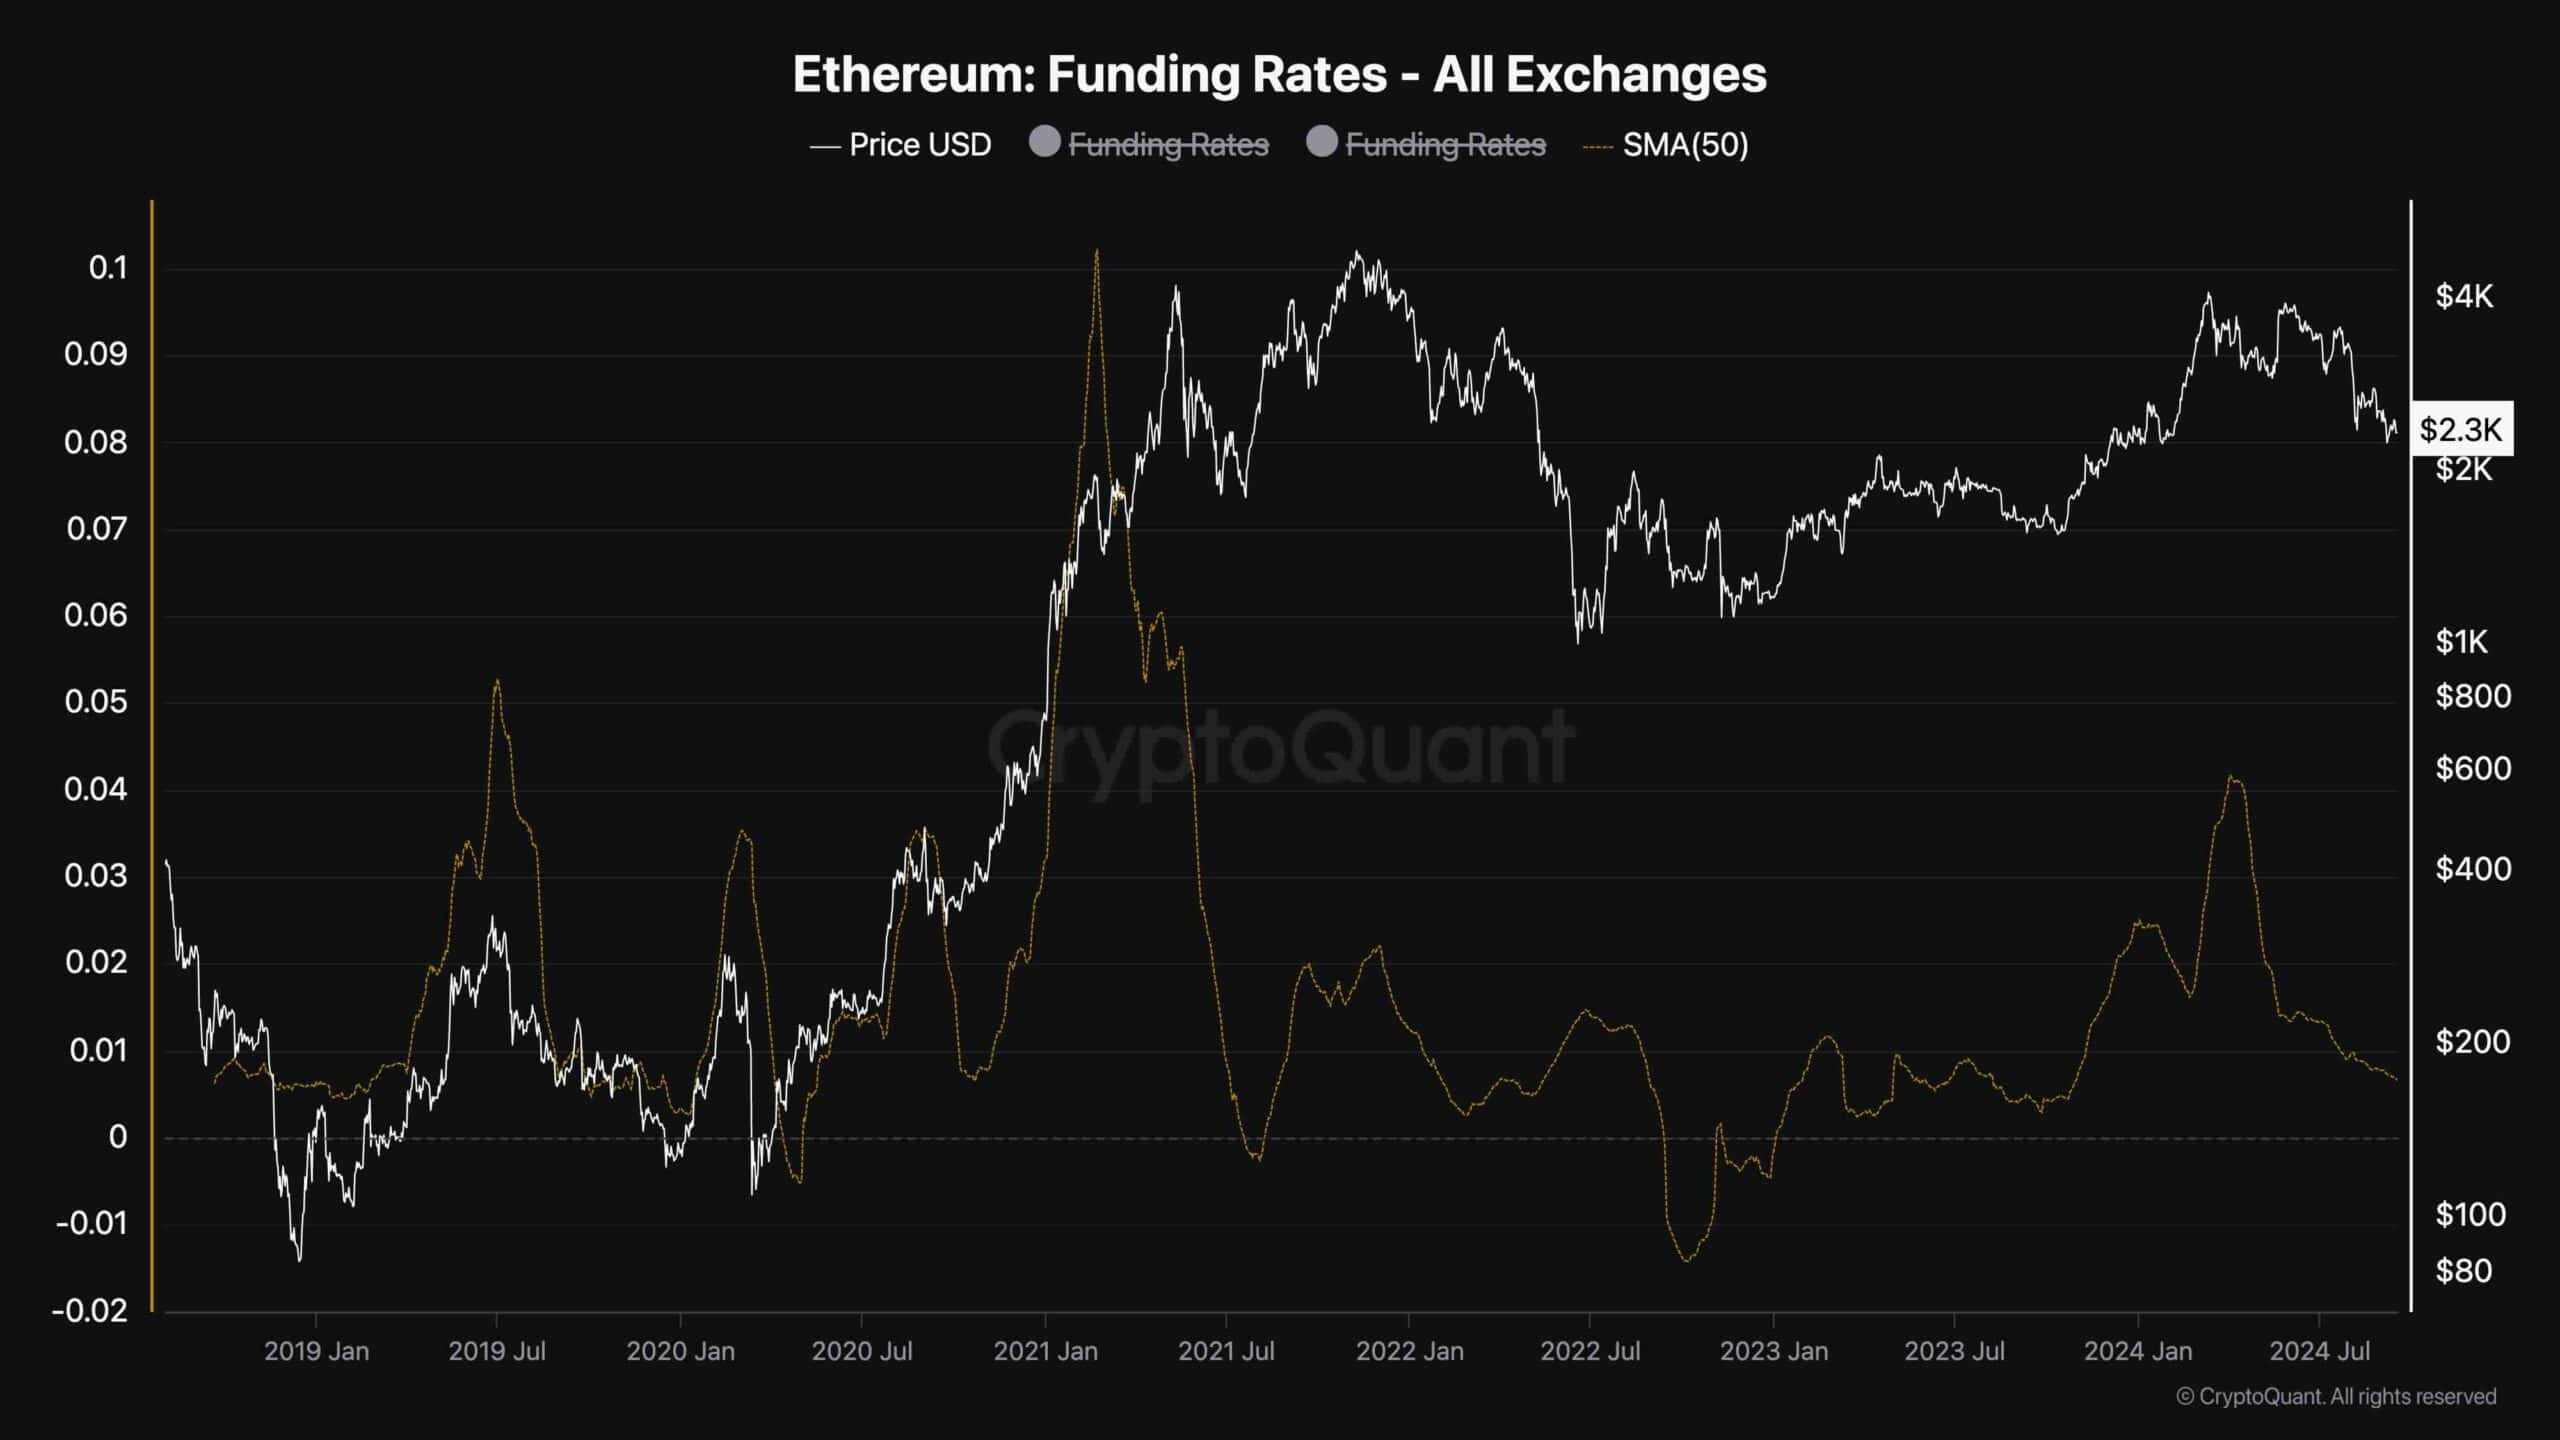
Therefore, by examining the sentiment of futures traders, participants can gain valuable insights into potential price trends. This chart shows the 50-day moving average of Ethereum’s funding rates, providing a broader view of whether buyers or sellers are executing orders more aggressively through market orders in the futures market.
Recently, the 50-day moving average of ETH funding rates has been consistently in a downtrend, reaching its lowest levels in 2024.
This persistent decline highlights the prevailing bearish sentiment, signaling a lack of buying interest from traders. For Ethereum to recover and reach higher price levels, demand in the perpetual futures market must increase. If the current trend of negative funding rates continues, it is likely that Ethereum will experience further price declines in the mid-term.
However, it’s important to note that while negative funding rates are typically seen as bearish, they can sometimes be an early signal of market recovery. This is because they can lead to short liquidation cascades, which can trigger price reversals, but this is highly dependent on whether there is sufficient spot buying pressure to support a rebound. Without stronger demand from spot buyers, Ethereum’s price may remain under pressure.
Binance Free $600 (CryptoPotato Exclusive): Use this link to register a new account and receive $600 exclusive welcome offer on Binance (full details).
LIMITED OFFER 2024 at BYDFi Exchange: Up to $2,888 welcome reward, use this link to register and open a 100 USDT-M position for free!
Disclaimer: Information found on CryptoPotato is those of writers quoted. It does not represent the opinions of CryptoPotato on whether to buy, sell, or hold any investments. You are advised to conduct your own research before making any investment decisions. Use provided information at your own risk. See Disclaimer for more information.
Cryptocurrency charts by TradingView.
Source link
George Georgiev
https://cryptopotato.com/ethereum-price-analysis-eth-tumbles-4-daily-as-bears-regain-control-2-2k-next/
2024-09-16 20:04:16


