FET is establishing itself as the dominant force in the AI cryptocurrency space, outperforming its competitors in both market cap and trading volume. With 75% of addresses in profit and a recent golden cross signaling strong bullish momentum, FET may be on the verge of a significant rally.
As it approaches key resistance levels, the potential for new all-time highs becomes increasingly possible.
FET Is Outpacing Its AI Competitors
FET is positioning itself as the frontrunner in the artificial intelligence cryptocurrency sector, with several factors solidifying its dominance. At present, FET holds the largest market capitalization among AI-related coins, sitting at $4.22 billion.
While Bittensor follows closely behind with a market cap of $4.19 billion, FET lead becomes even more pronounced when comparing it to the rest of the field. Combined, Render, Worldcoin, and Akash Network don’t even match FET’s market cap.
In 2024, FET recorded an astonishing trading volume of $49.92 billion, which is more than 4.5x that of Bittensor, its closest competitor. This discrepancy in volume is crucial because it indicates the level of market interest and liquidity flowing through FET.
Read more: How To Invest in Artificial Intelligence (AI) Cryptocurrencies?
Moreover, FET year-to-date (YTD) price surged by an impressive 126.78%, outpacing not only Bittensor, which posted a strong but comparatively lower 102.56%. Higher volume often reflects stronger demand and wider participation, all of which play into FET price favor.
Investors and traders are clearly gravitating toward FET, which could create a positive feedback loop where its liquidity, visibility, and relevance in the market only continue to grow. This could also establish FET as the leading AI coin in the market, making it even more dominant.
FET Profitable Addresses Could Drive a New Price Surge
At present, around 75.25% of all FET addresses are in profit, which means roughly 85,010 addresses are seeing gains at the current price of $1.70. Meanwhile, about 21.44%, or 24,220 addresses, are experiencing losses, and a small fraction, 3.31%, or 3,740 addresses, are at break-even.
This distribution suggests that the majority of FET holders are confident in the asset’s future, having already seen positive returns on their positions. When a large proportion of holders are in profit, it typically signals strong market sentiment and potential for further upward momentum as more investors are encouraged to enter the market.

Historically, a similar proportion of addresses in profit during an uptrend for FET led to an explosive price surge, where it skyrocketed by over 500% in just one month. This past performance suggests that when so many holders are already in profit, it creates conditions ripe for rapid price appreciation, particularly if demand continues to grow.
With the current percentage of addresses in profit, FET price could be setting up for another significant rally, drawing comparisons to previous bull runs in its price history.
FET Price Prediction: A New All-Time High Soon?
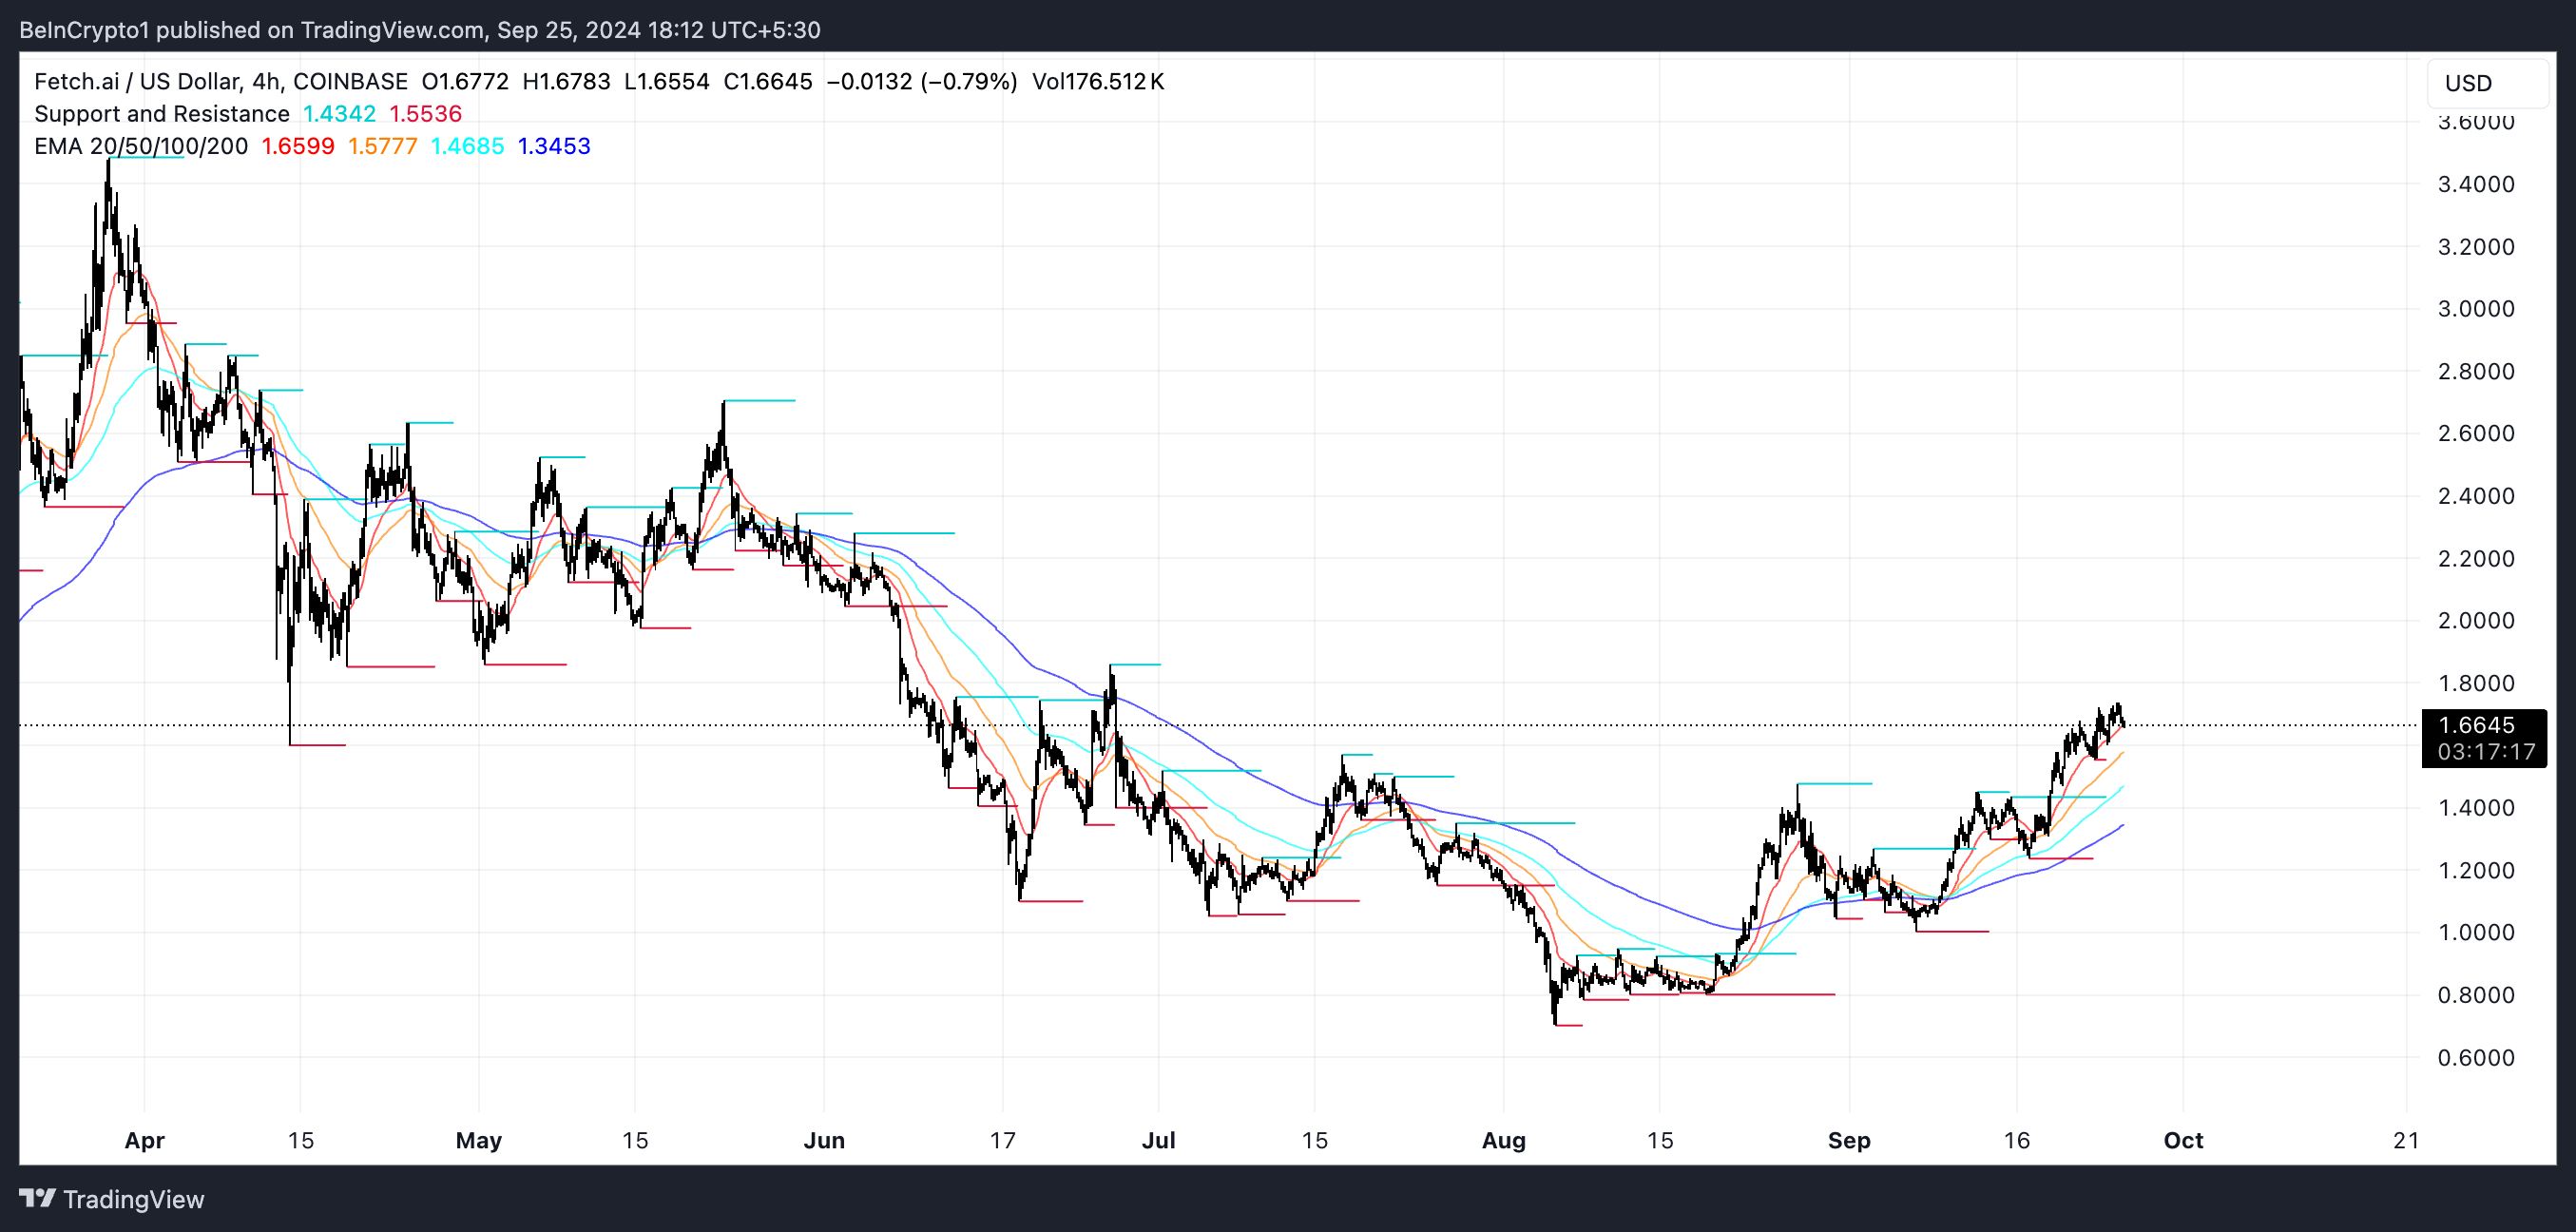
FET recently formed a golden cross, a bullish technical pattern where the shorter-term exponential moving average (EMA) crosses above the longer-term EMA. This pattern is often seen as a sign of building upward momentum, typically followed by further price appreciation. In FET’s case, the different EMA lines on the chart show a bullish alignment, with shorter-term EMAs positioned above longer-term ones.
EMAs are used to smooth out price data and identify trends more clearly. Unlike simple moving averages, EMAs give greater weight to recent price movements, making them more responsive. Traders commonly track multiple EMAs, such as the 20, 50, 100, and 200-day lines, to assess trend strength and direction. In FET’s case, these EMAs are showing a clear upward trajectory, reinforcing the bullish outlook.
Read more: Top 9 Artificial Intelligence (AI) Cryptocurrencies in 2024

If this uptrend holds, FET could test key resistance levels at $1.86 and $2.28. A break above these levels would strengthen the bullish case, potentially leading to further resistance points at $2.70 and $3.48. Surpassing these could push FET toward a new all-time high, signaling a strong bullish move.
But if the uptrend weakens and FET’s price reverses, support levels at $1.24 and $1.00 could become critical. Should bearish sentiment continue, the price could fall further, potentially reaching $0.80. These key levels will determine whether FET can maintain its bullish momentum or if a deeper correction is on the horizon.
Disclaimer
In line with the Trust Project guidelines, this price analysis article is for informational purposes only and should not be considered financial or investment advice. BeInCrypto is committed to accurate, unbiased reporting, but market conditions are subject to change without notice. Always conduct your own research and consult with a professional before making any financial decisions. Please note that our Terms and Conditions, Privacy Policy, and Disclaimers have been updated.
Source link
Tiago Amaral
https://beincrypto.com/fet-price-ready-new-all-time-high/
2024-09-25 17:00:00


