Frog-themed meme coin Pepe (PEPE) price has increased by 40% in the last seven days. This jump is in tune with the broader market relief.
Although the recent rally has sparked excitement, data shows that Pepe has hit a liquidity wall that could hinder further upside. This analysis explains what market participants should expect as the meme coin faces increased resistance.
Pepe Signal Casts Doubts on Further Upside
On September 16, Pepe’s price was $0.0000071. However, the gains of the last two weeks have sent the price to $0.000011 — a region where it currently stands. Due to the performance, there have been calls for PEPE to climb toward $0.000015.
However, the In/Out of Money Around Price (IOMAP) shows that it could be challenging. The IOMAP identifies the average price addresses purchased a token and shows whether they are making money relative to the current price or not.
When there is a higher volume at a price range, the region could either serve as support or resistance. For PEPE, the volume accumulated between $0.000011 and $0.00012 is 8.62 trillion tokens, valued at approximately $95 million, and is out of money.
Read more: How To Buy Pepe (PEPE) and Everything You Need To Know
This $95 million is higher than the volume purchased between $0.000010 and $0.000011. Since the former is higher, it indicates that the meme coin could face a sell wall as it approaches $0.000012. Consequently, failure to break this resistance could pull the uptrend.
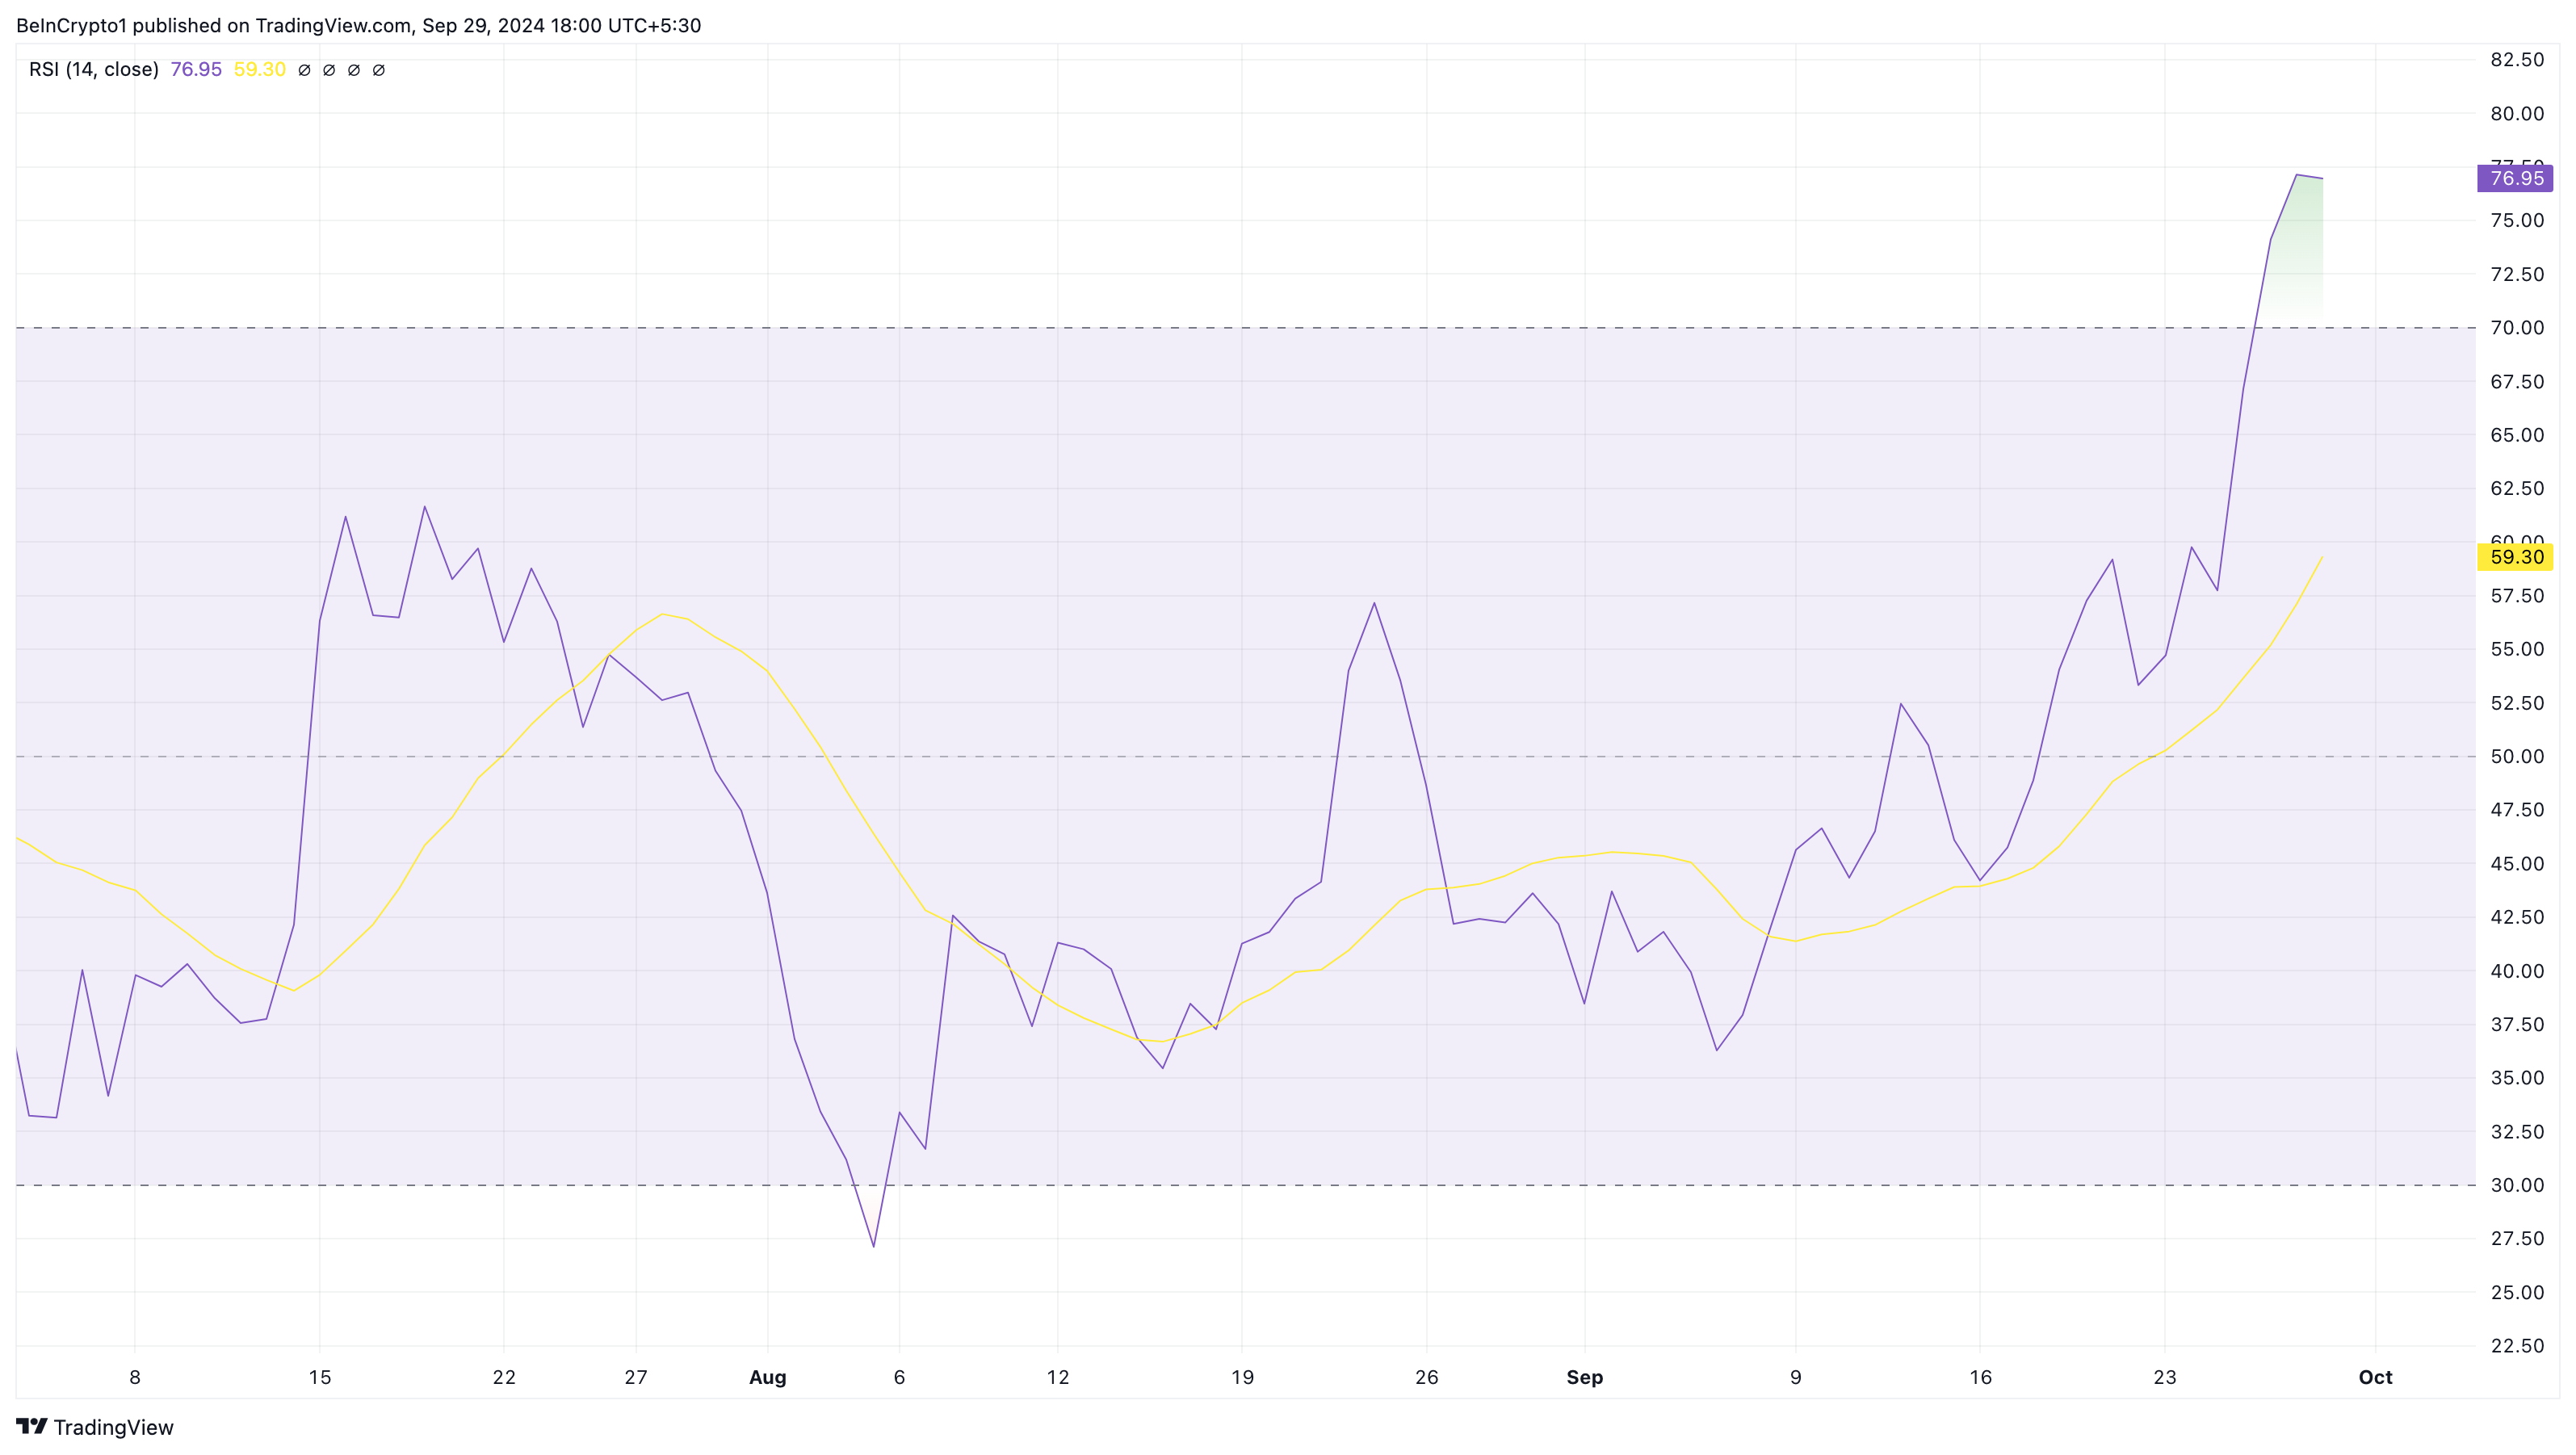
Another indicator fueling this bias is the Relative Strength Index (RSI), a technical oscillator used to measure momentum. When the RSI rises, momentum is bullish. However, a falling reading suggests bearish momentum.
The RSI also shows whether a cryptocurrency is overbought or oversold. Readings above 70.00 mean it is overbought, while those below 30.00 mean it is oversold. As seen below, the RSI on the PEPE/USD daily chart shows that the token is overbought, and the price might decline.

PEPE Price Prediction: Bearish Days Ahead
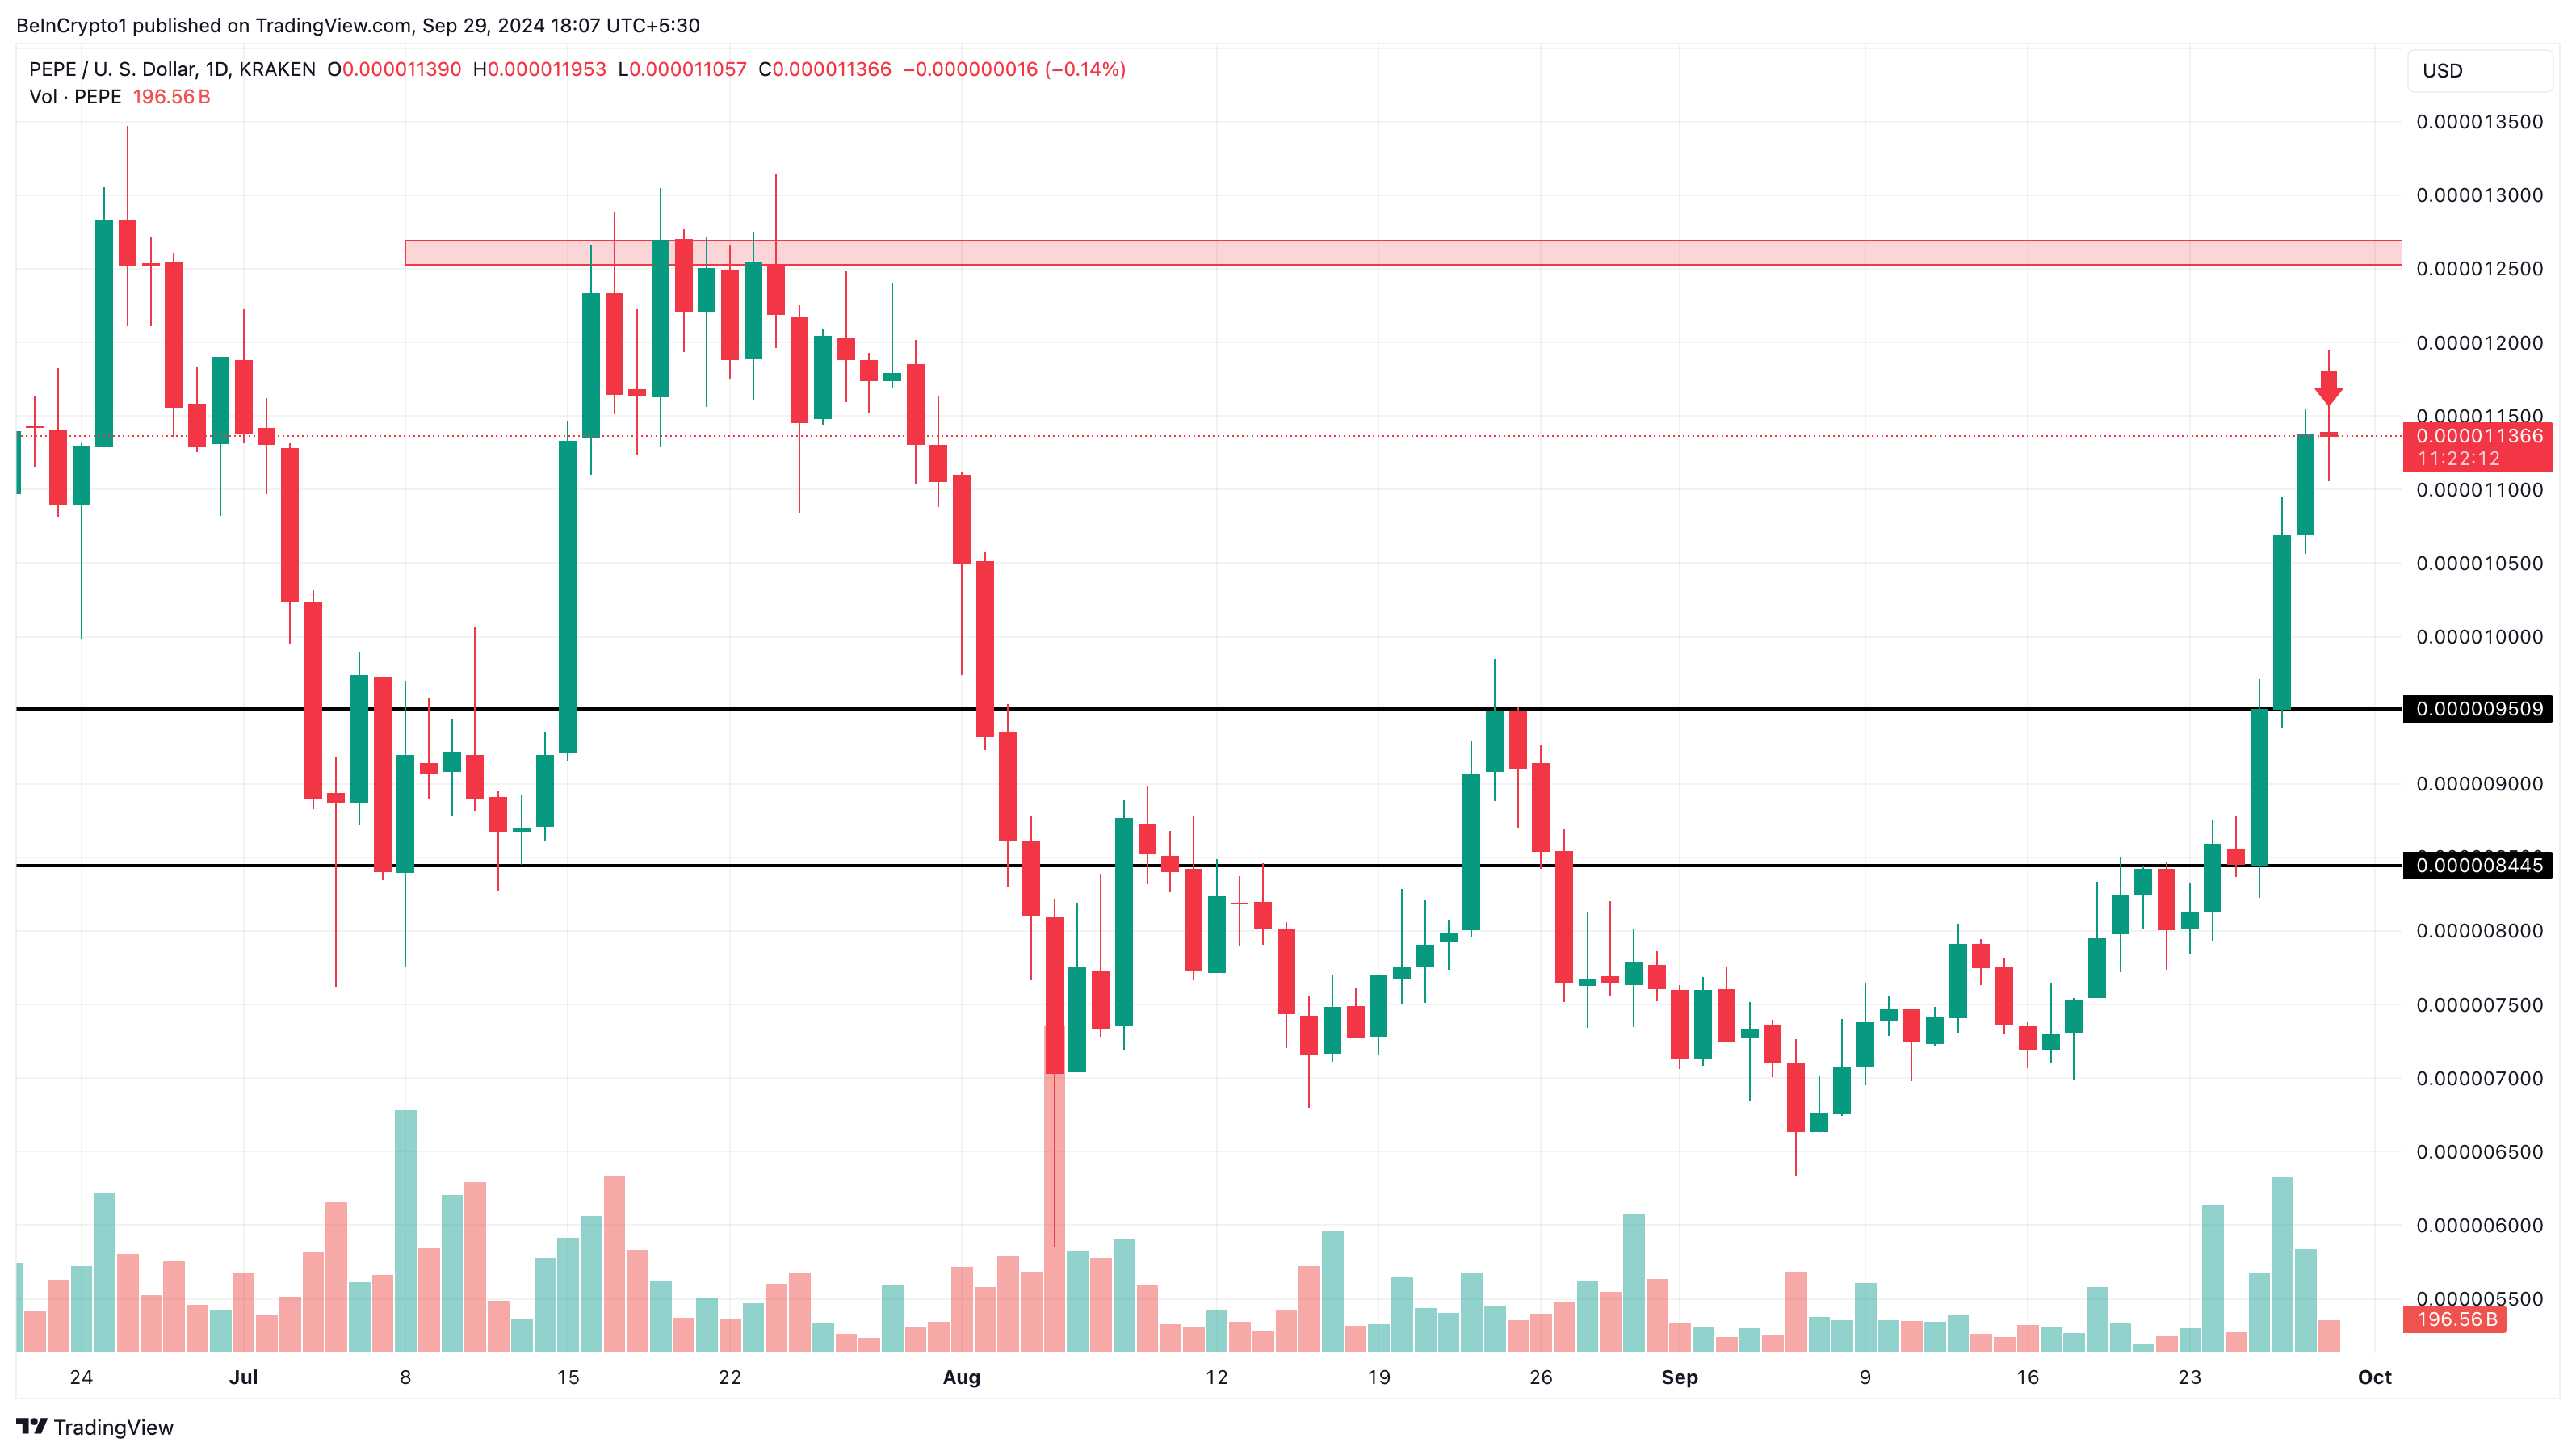
At press time, PEPE’s price is $0.000011. However, the daily chart shows the appearance of a sell signal as the meme coin attempts to enter the supply zone at $0.000013.
Following shift, the token may face challenges in rallying toward the expected $0.000015 mark. Instead, it might have to focus on maintaining support at $0.000010. Should the token fail to defend this crucial level, it could have serious consequences for the meme coin, potentially driving the price down to $0.0000095.
Read more: 5 Best Pepe (PEPE) Wallets for Beginners and Experienced Users

In a highly bearish situation, PEPE’s price might decline to $0.0000084. Meanwhile, the token’s value could resist another drop if bulls successfully push it beyond $0.000013. In that scenario, the cryptocurrency might move closer to $0.000020.
Disclaimer
In line with the Trust Project guidelines, this price analysis article is for informational purposes only and should not be considered financial or investment advice. BeInCrypto is committed to accurate, unbiased reporting, but market conditions are subject to change without notice. Always conduct your own research and consult with a professional before making any financial decisions. Please note that our Terms and Conditions, Privacy Policy, and Disclaimers have been updated.
Source link
Victor Olanrewaju
https://beincrypto.com/pepe-price-surge-hits-obstacle/
2024-09-29 17:00:00


