PEPE price is showing signs of weakening momentum. Key technical indicators suggest the recent uptrend is losing steam. As a result, the coin has fallen almost 10% in the last 24 hours.
Additionally, short-term price indicators, such as the EMA lines, remain neutral, signaling that PEPE may test important support levels in the near future. While the possibility of a downward move exists, a resurgence in bullish momentum could push PEPE toward retesting key resistance levels.
PEPE ADX Shows The Current Uptrend Is Fading Away
PEPE’s ADX has dropped to 17.89, a sharp decline from its peak of 58.52 on September 30, when PEPE was trading at $0.00001147. The ADX (Average Directional Index) is a key technical indicator used to measure the strength of a trend. That measure is regardless of whether it’s bullish or bearish.
When the ADX is above 25, it indicates a strong market trend. That suggests that momentum is likely driving the price in one clear direction. On the other hand, when the ADX falls below 20, it signals a weak or nonexistent trend.
That points to consolidation or a phase of indecision where no clear price movement is dominant. Currently, with PEPE’s ADX at 17.89, this suggests that the market is in a consolidation phase, lacking strong directional momentum.
Read more: Pepe (PEPE) Price Prediction 2024/2025/2030
Such a low ADX value indicates that the price is likely ranging within a narrow band, neither gaining nor losing much ground. This aligns with the idea that PEPE is in a period of reduced volatility, even as one of the biggest meme coins in the market.
The sharp drop in ADX also confirms that the strong trend observed in late September has faded, leaving PEPE without a clear directional force. That makes it more susceptible to sideways trading or minor fluctuations until a new trend emerges.
PEPE MVRV Ratio Is Now Negative
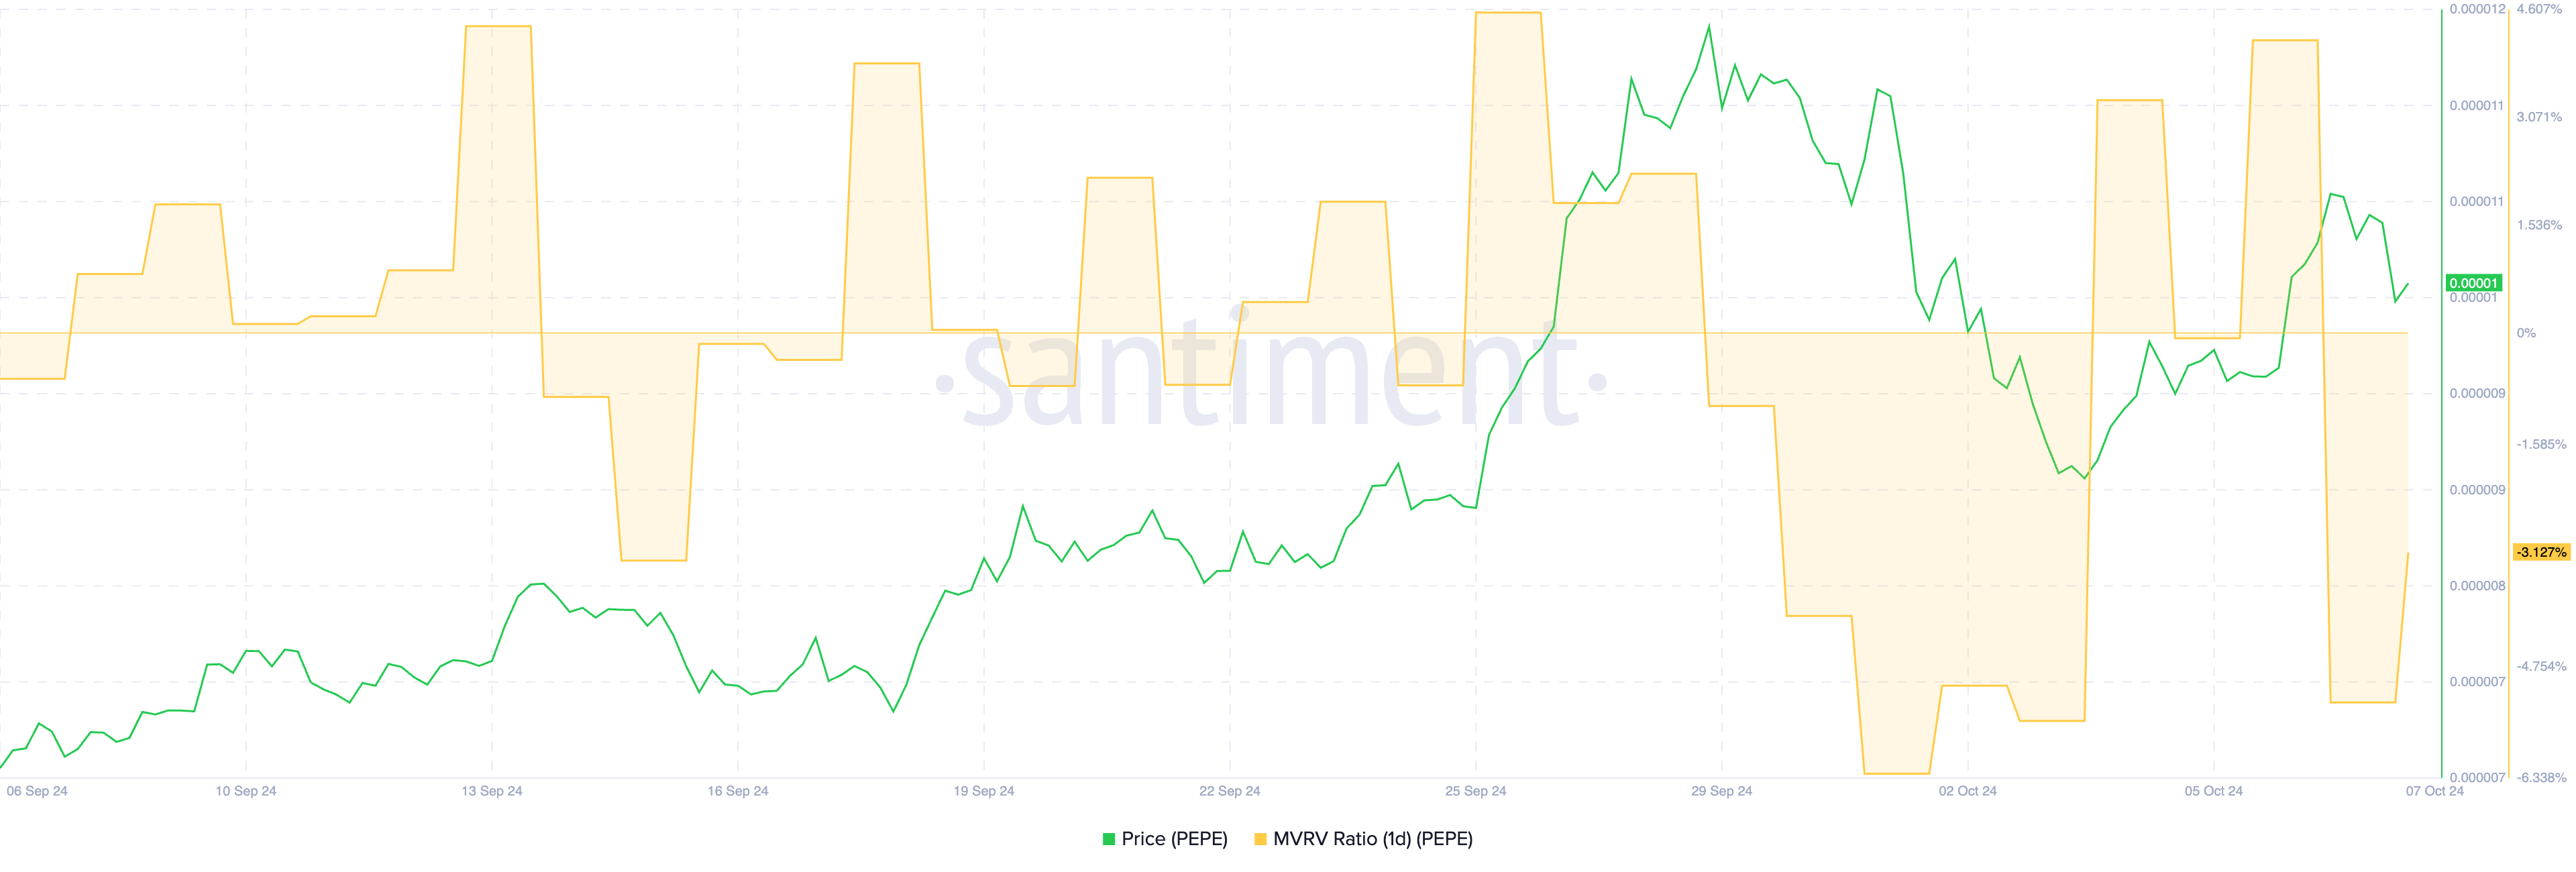
PEPE’s 1D MVRV Ratio is currently at -3.12%, indicating that, on average, recent investors are holding PEPE at a loss relative to its current price. The 1D MVRV (Market Value to Realized Value) Ratio is a key metric used to gauge whether a token is overvalued or undervalued by comparing the market value of an asset with its realized value.
When the MVRV ratio is positive, it suggests that holders are generally in profit, while a negative ratio implies that they are in a loss position. Extremely positive values signal that a sell-off could be imminent, as investors may start taking profits.

On the flip side, a negative MVRV ratio, like the current -3.12%, suggests that the market is undervalued. That could present a buying opportunity as sellers have largely exhausted themselves. The drop from 4.17% to -3.12% in just one day is a sharp reversal. That indicates that many investors have moved from being in profit to holding losses in a very short period.
This sudden shift suggests a rapid sell-off or price drop, likely driven by market volatility or external factors impacting PEPE’s price. This could trigger further cautious behavior in the market as traders wait for the MVRV to stabilize or reverse upward again.
PEPE Price Prediction: A Potential Downtrend Ahead?
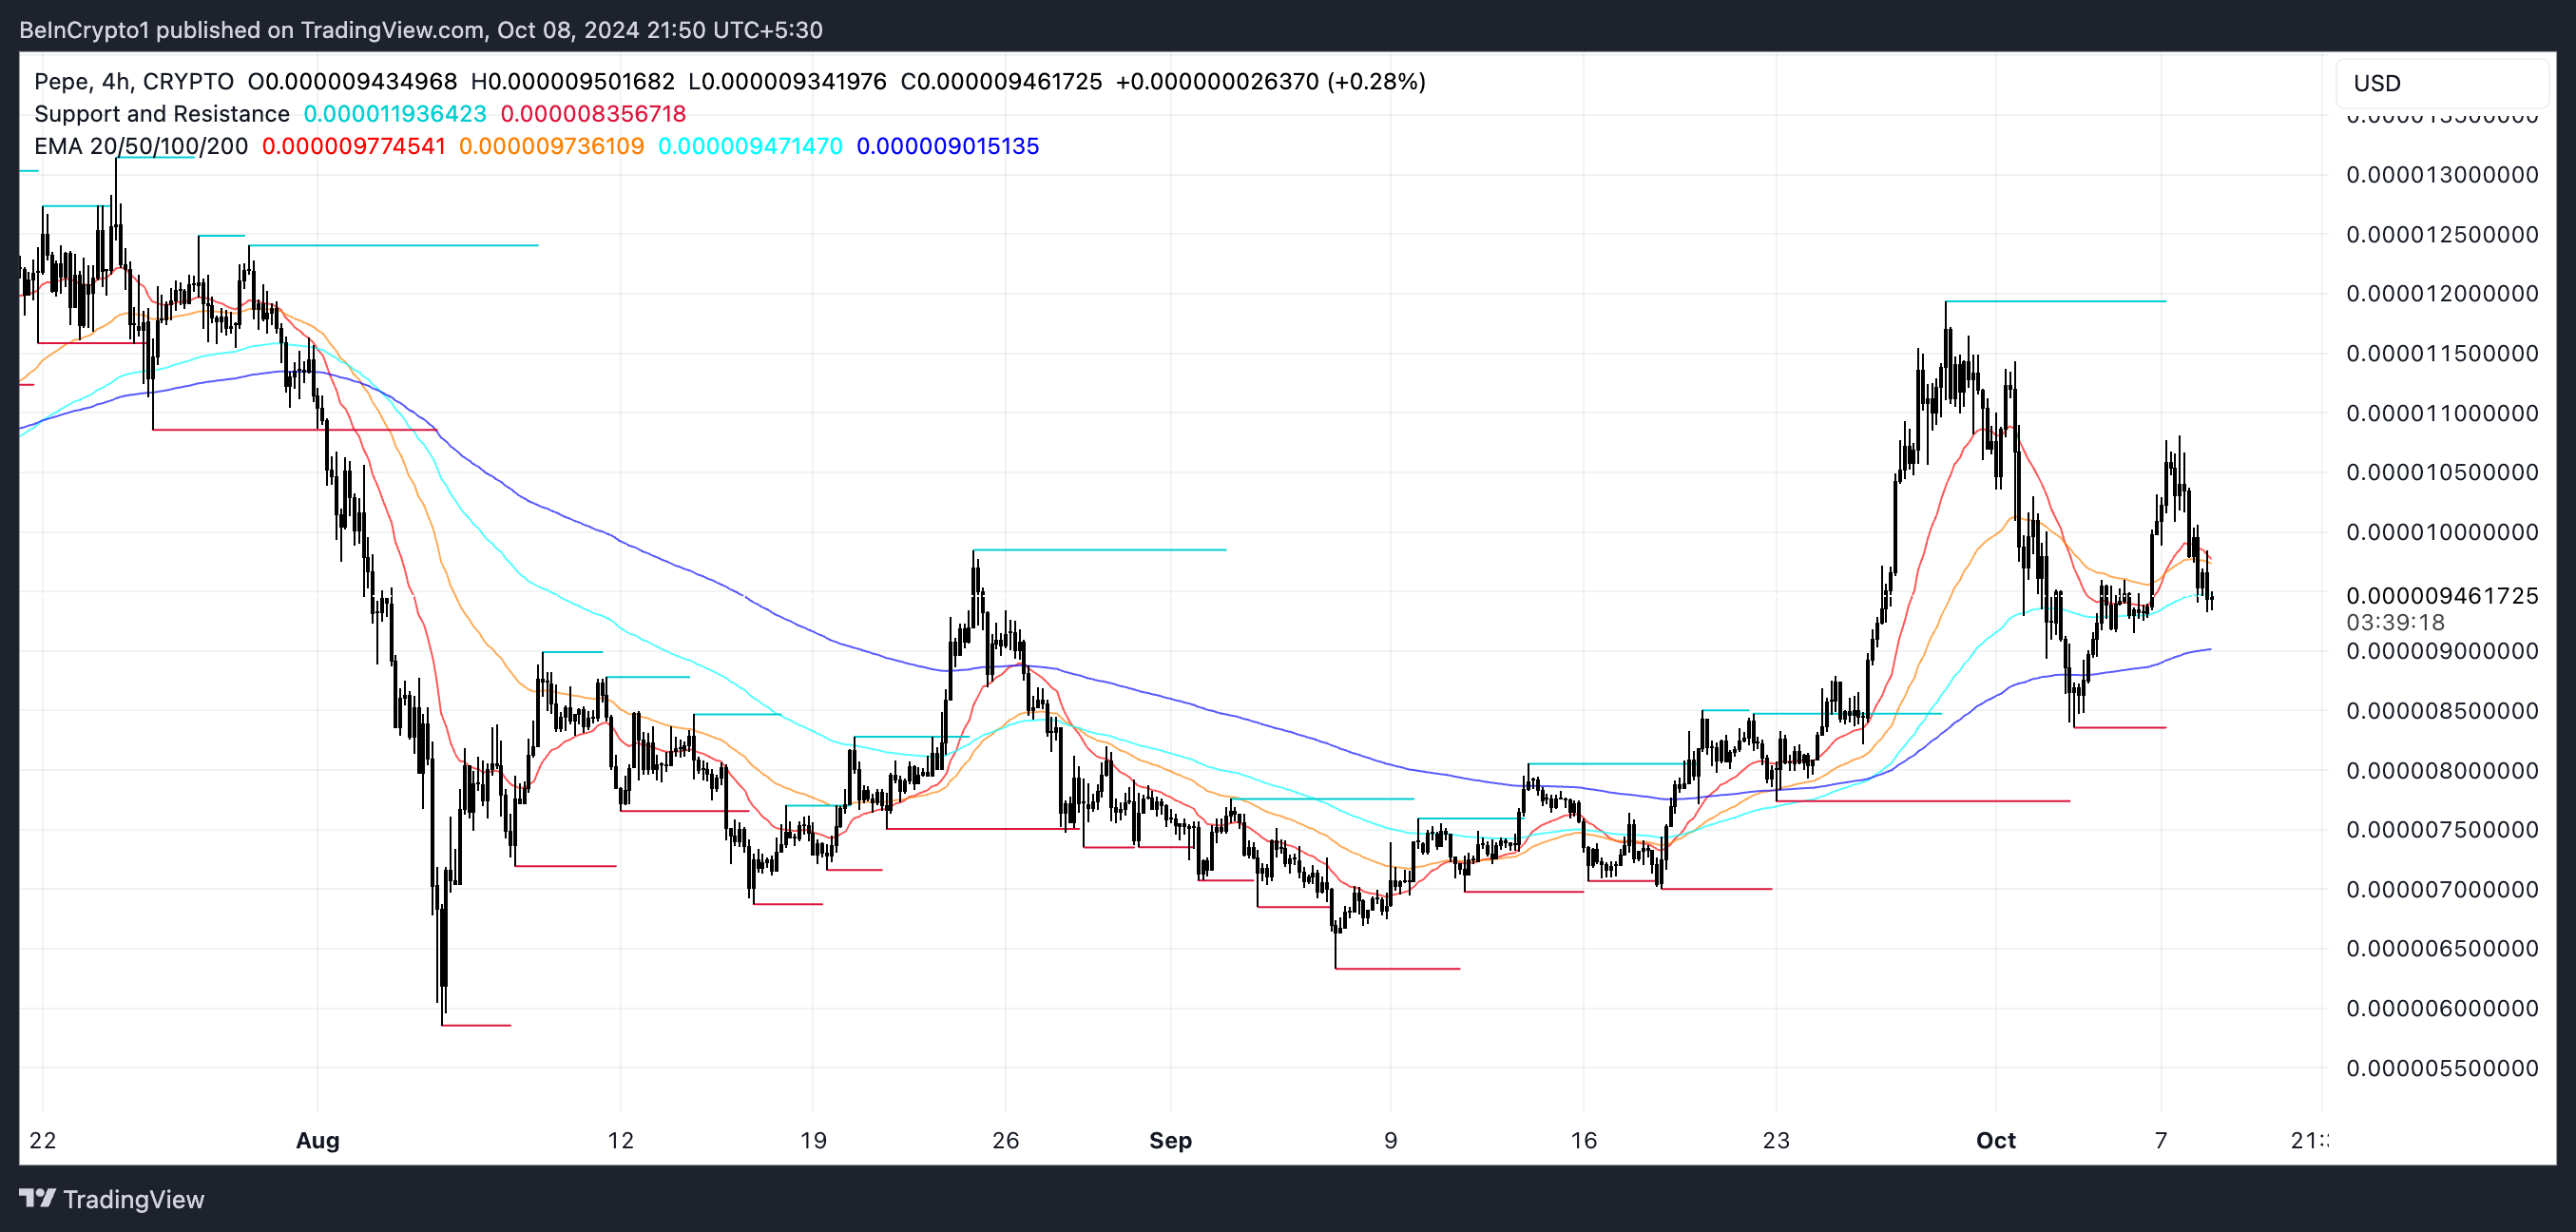
PEPE’s EMA lines are currently neutral without a clear indication of an uptrend or downtrend, reflecting the market’s indecision. EMA (Exponential Moving Average) lines are widely used in technical analysis to smooth out price data and identify trends by giving more weight to recent price movements.
Short-term EMA lines react quickly to price changes, while long-term EMA lines offer a broader view of the trend. In PEPE’s case, the short-term EMAs are still above the long-term ones. This is generally considered a bullish signal, but they are starting to slope downward.
Read more: 5 Best Pepe (PEPE) Wallets for Beginners and Experienced Users

This downward tilt suggests that the bullish momentum is weakening, and a potential shift could be on the horizon. If the current price action continues in this neutral to slightly bearish direction, PEPE might test the support level at $0.00000835 in the coming days. Should this support fail to hold, the price could drop further, with the next strong support at $0.00000776.
However, if bullish momentum picks up again, PEPE price could challenge the resistance at $0.0000119. For now, the market remains in a state of uncertainty, and traders are likely waiting for a clearer signal to determine the next move.
Disclaimer
In line with the Trust Project guidelines, this price analysis article is for informational purposes only and should not be considered financial or investment advice. BeInCrypto is committed to accurate, unbiased reporting, but market conditions are subject to change without notice. Always conduct your own research and consult with a professional before making any financial decisions. Please note that our Terms and Conditions, Privacy Policy, and Disclaimers have been updated.
Source link
Tiago Amaral
https://beincrypto.com/pepe-price-doubt-market-momentum-fades/
2024-10-08 20:00:00


