This week, numerous top 20 altcoins have achieved double-digit gains, with Toncoin (TON) and a few others being notable exceptions. This divergence may be attributed to several key Toncoin metrics.
In this analysis, BeInCrypto explores how these on-chain metrics are influencing TON’s underperformance and what they could mean for its price going forward.
Toncoin Large Investors Remain Unconvinced
One of the major Toncoin metrics driving TON’s price below $5 is the large holders’ netflow. The large holders’ netflow measures the activity of addresses holding between 0.1% to 1% of the total circulating supply.
When the reading is positive, it means that investors with significant holdings have accumulated more tokens than the ones they’ve sold. On the other hand, a negative reading implies otherwise.
According to IntoTheBlock, the large holders’ netflow has decreased by 117% in the last seven days. This decline implies that several large investors have sold the tokens, putting downward pressure on the price.
Read more: What Are Telegram Mini Apps? A Guide for Crypto Beginners
If this trend continues, TON’s price, currently below $5, could face further declines. In addition, other Toncoin metrics indicate waning confidence among short-term holders.
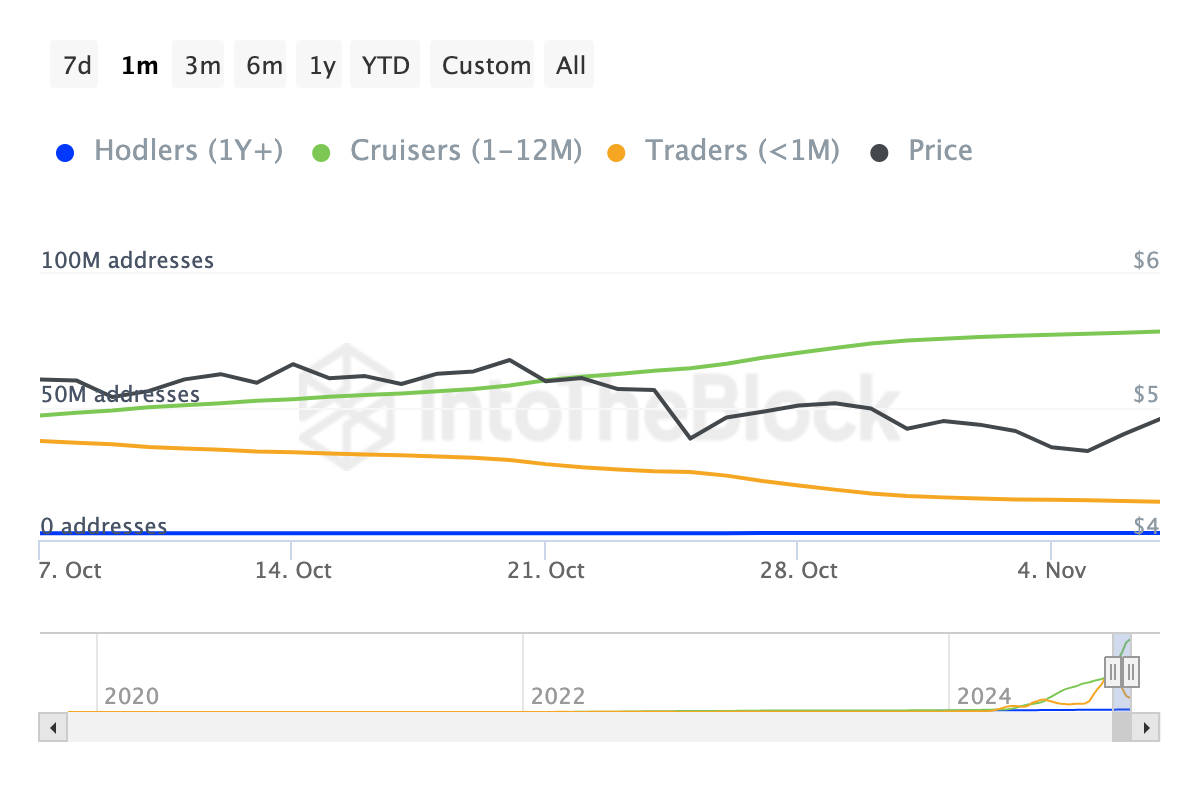
For example, the “Addresses by Time Held” data shows that many investors who acquired TON within the past 30 days have opted to sell rather than hold. Further, such selling behavior often places downward pressure on the token’s value.

As a result, if Toncoin fails to attract renewed short-term adoption, the outlook for a recovery to $7 may not materialize.
TON Price Prediction: No Rally to $7 Yet
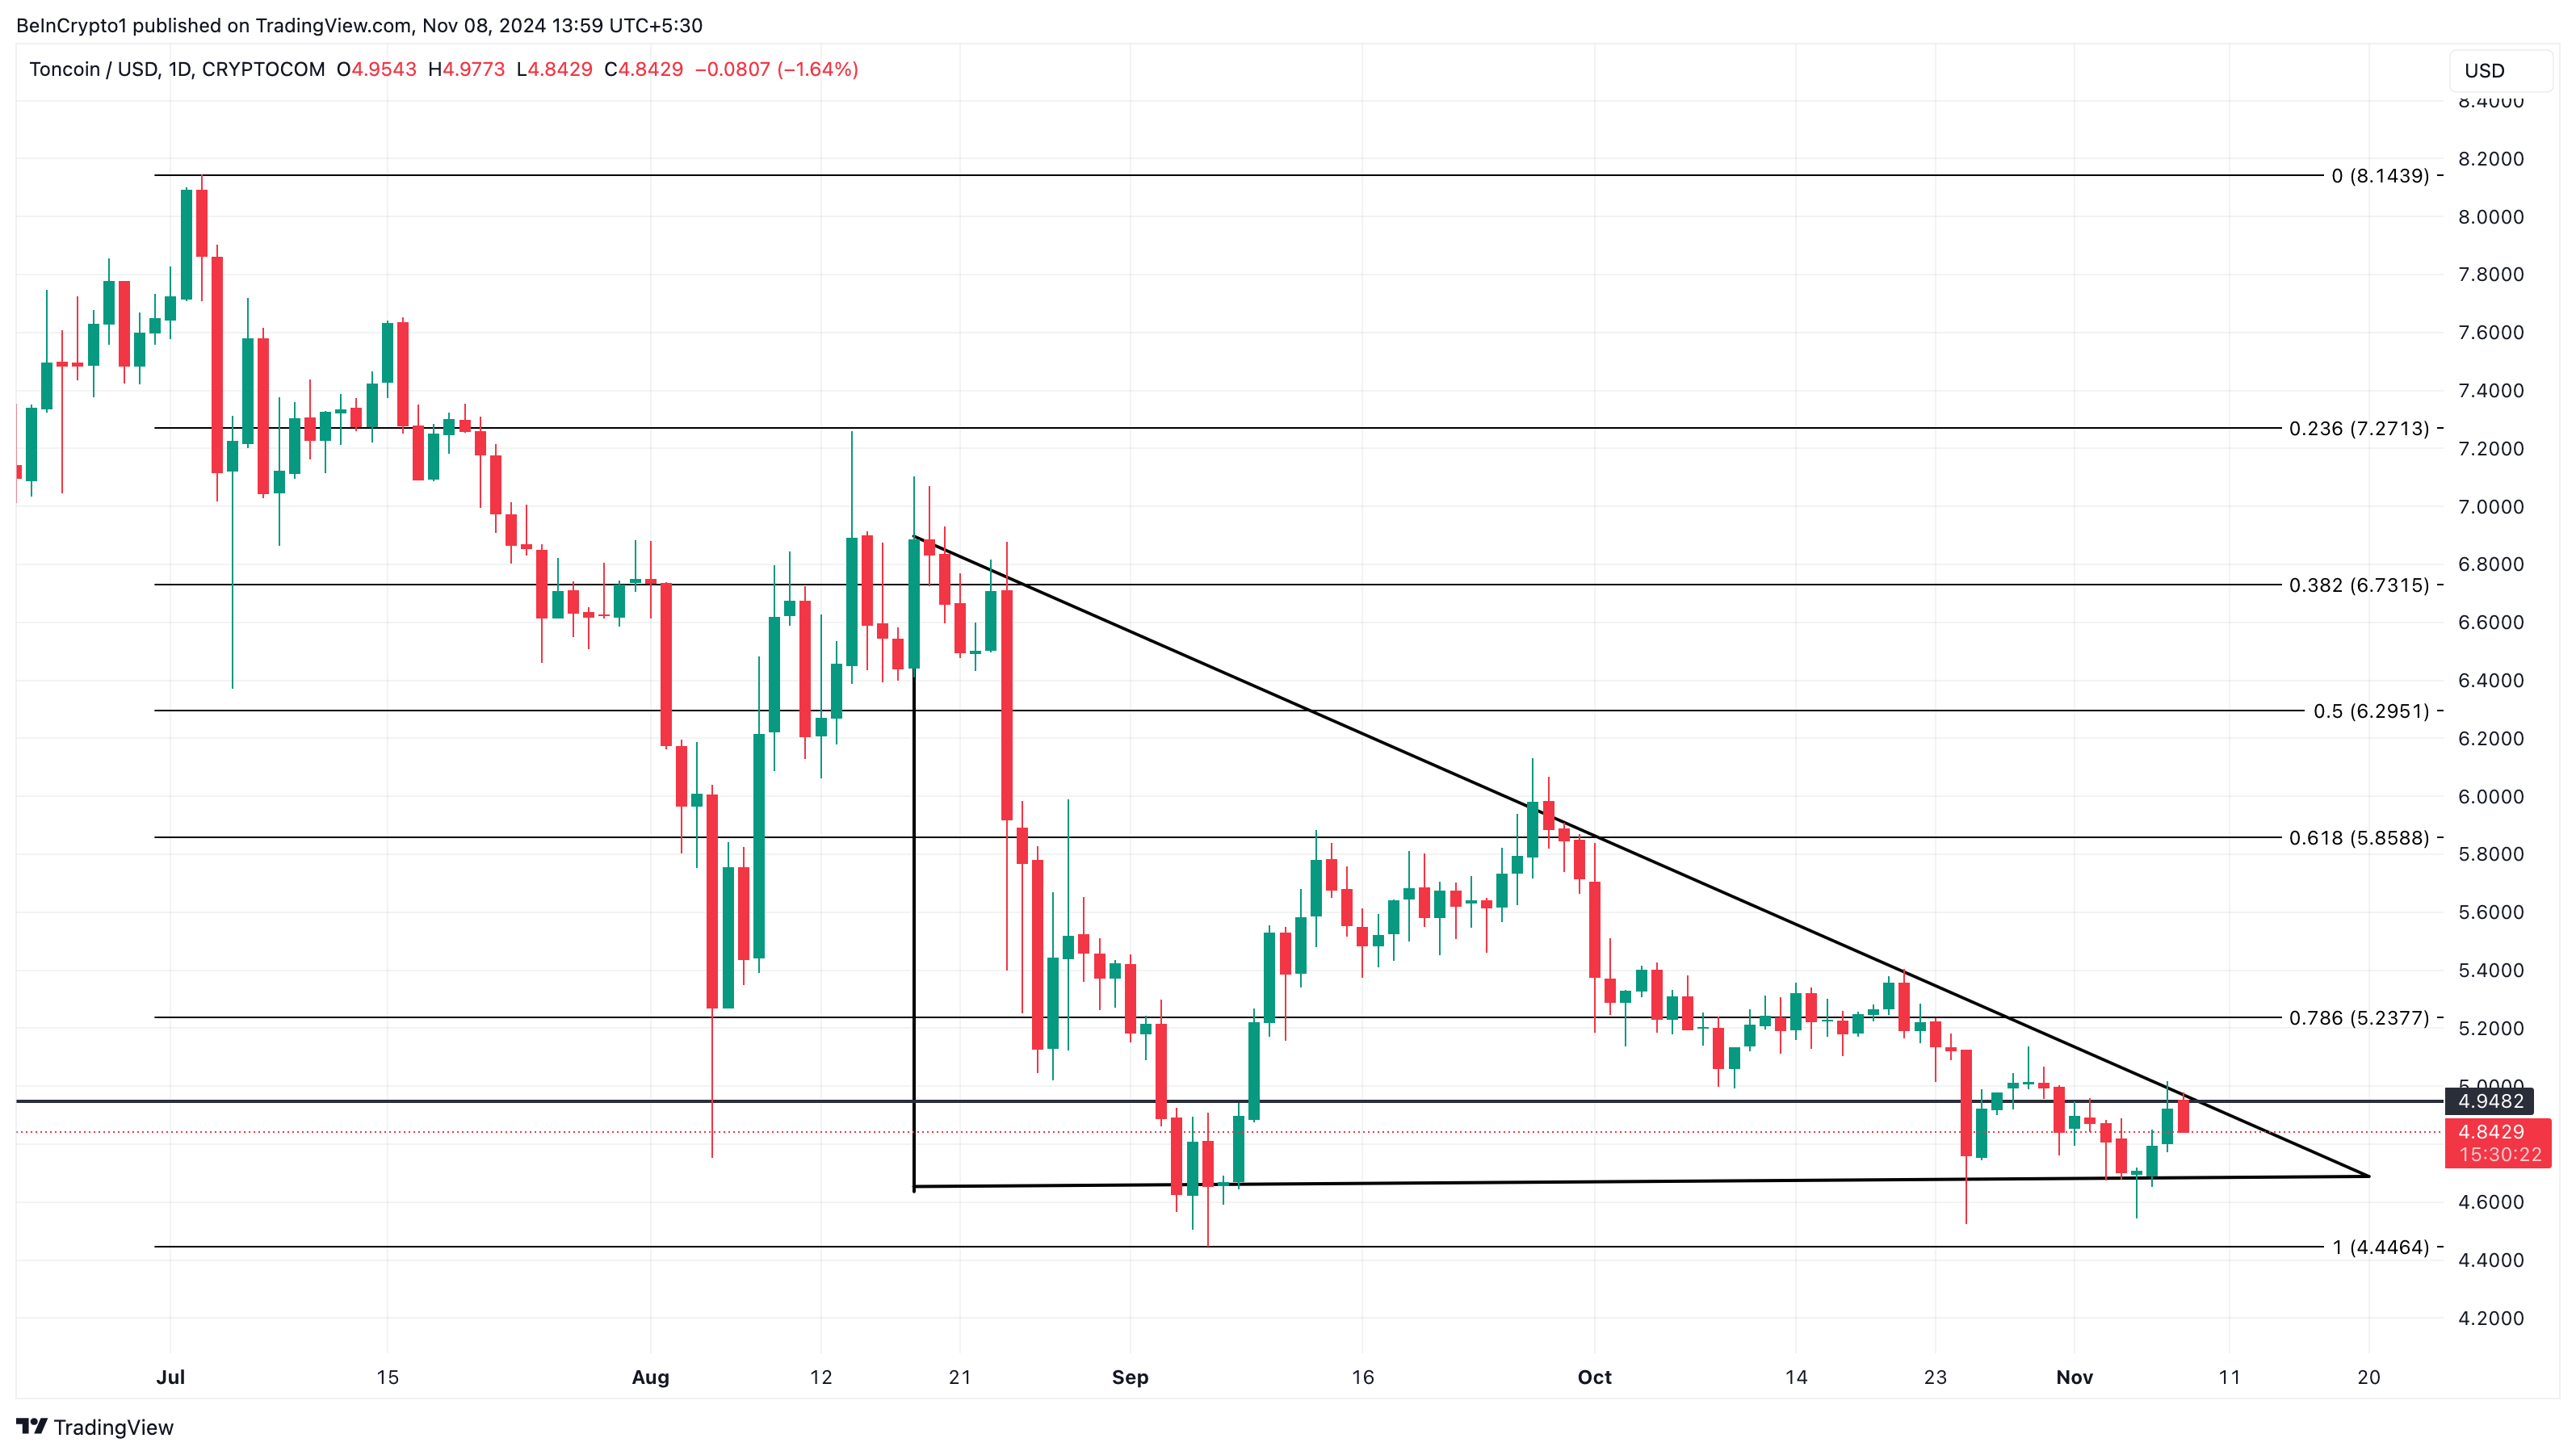
On the daily chart, TON’s price continues to trade within a descending triangle, which is unlike the breakout several altcoins have recently experienced.
A descending triangle is a bearish chart pattern characterized by a descending upper trendline and a flatter horizontal lower trendline. This pattern suggests that selling pressure is increasing, and if the price fails to break above the descending trendline, the value might continue to fall.
As seen below, Toncoin attempted to rise above the pattern. However, the rejection at $4.95 ensured that the effort was futile, and this led the token back to $4.84. Should bears continue to neutralize bulls’ attempts, the value might drop to $4.45.
Read more: 6 Best Toncoin (TON) Wallets in 2024

However, if these Toncoin metrics return to bullish territory, the trend might change. In that scenario, TON might rally to $7.27.
Disclaimer
In line with the Trust Project guidelines, this price analysis article is for informational purposes only and should not be considered financial or investment advice. BeInCrypto is committed to accurate, unbiased reporting, but market conditions are subject to change without notice. Always conduct your own research and consult with a professional before making any financial decisions. Please note that our Terms and Conditions, Privacy Policy, and Disclaimers have been updated.
Source link
Victor Olanrewaju
https://beincrypto.com/toncoin-metrics-align-to-keep-ton-far-away-from-7/
2024-11-08 12:00:00


