Mantra (OM) price recently broke a new all-time high on November 18 and has surged 155.29% in the last seven days. This explosive rally highlights the strong bullish momentum that has pushed OM to its highest levels yet.
However, recent indicators, including RSI and the Ichimoku Cloud, suggest the uptrend may be weakening.
OM RSI Shows The Neutral Zone
OM’s Relative Strength Index (RSI) is currently at 52.7, down from the overbought levels it reached between November 16 and November 18 when it stayed above 70 and Mantra price hit new all-time highs, as the narrative around real-world assets (RWA) keeps growing.
This decline indicates a slowdown in buying momentum, suggesting that the strong upward pressure seen earlier has eased. The shift reflects a more balanced market where buyers and sellers are now exerting similar influence on OM price.
RSI gauges the strength of price movements, with levels above 70 signaling high bullish momentum and potential overextension, while values below 30 indicate strong bearish pressure.
At 52.7, OM’s RSI is in a neutral range, suggesting the market is neither overheated nor oversold.
Ichimoku Cloud Shows Mantra Uptrend Is Weakening
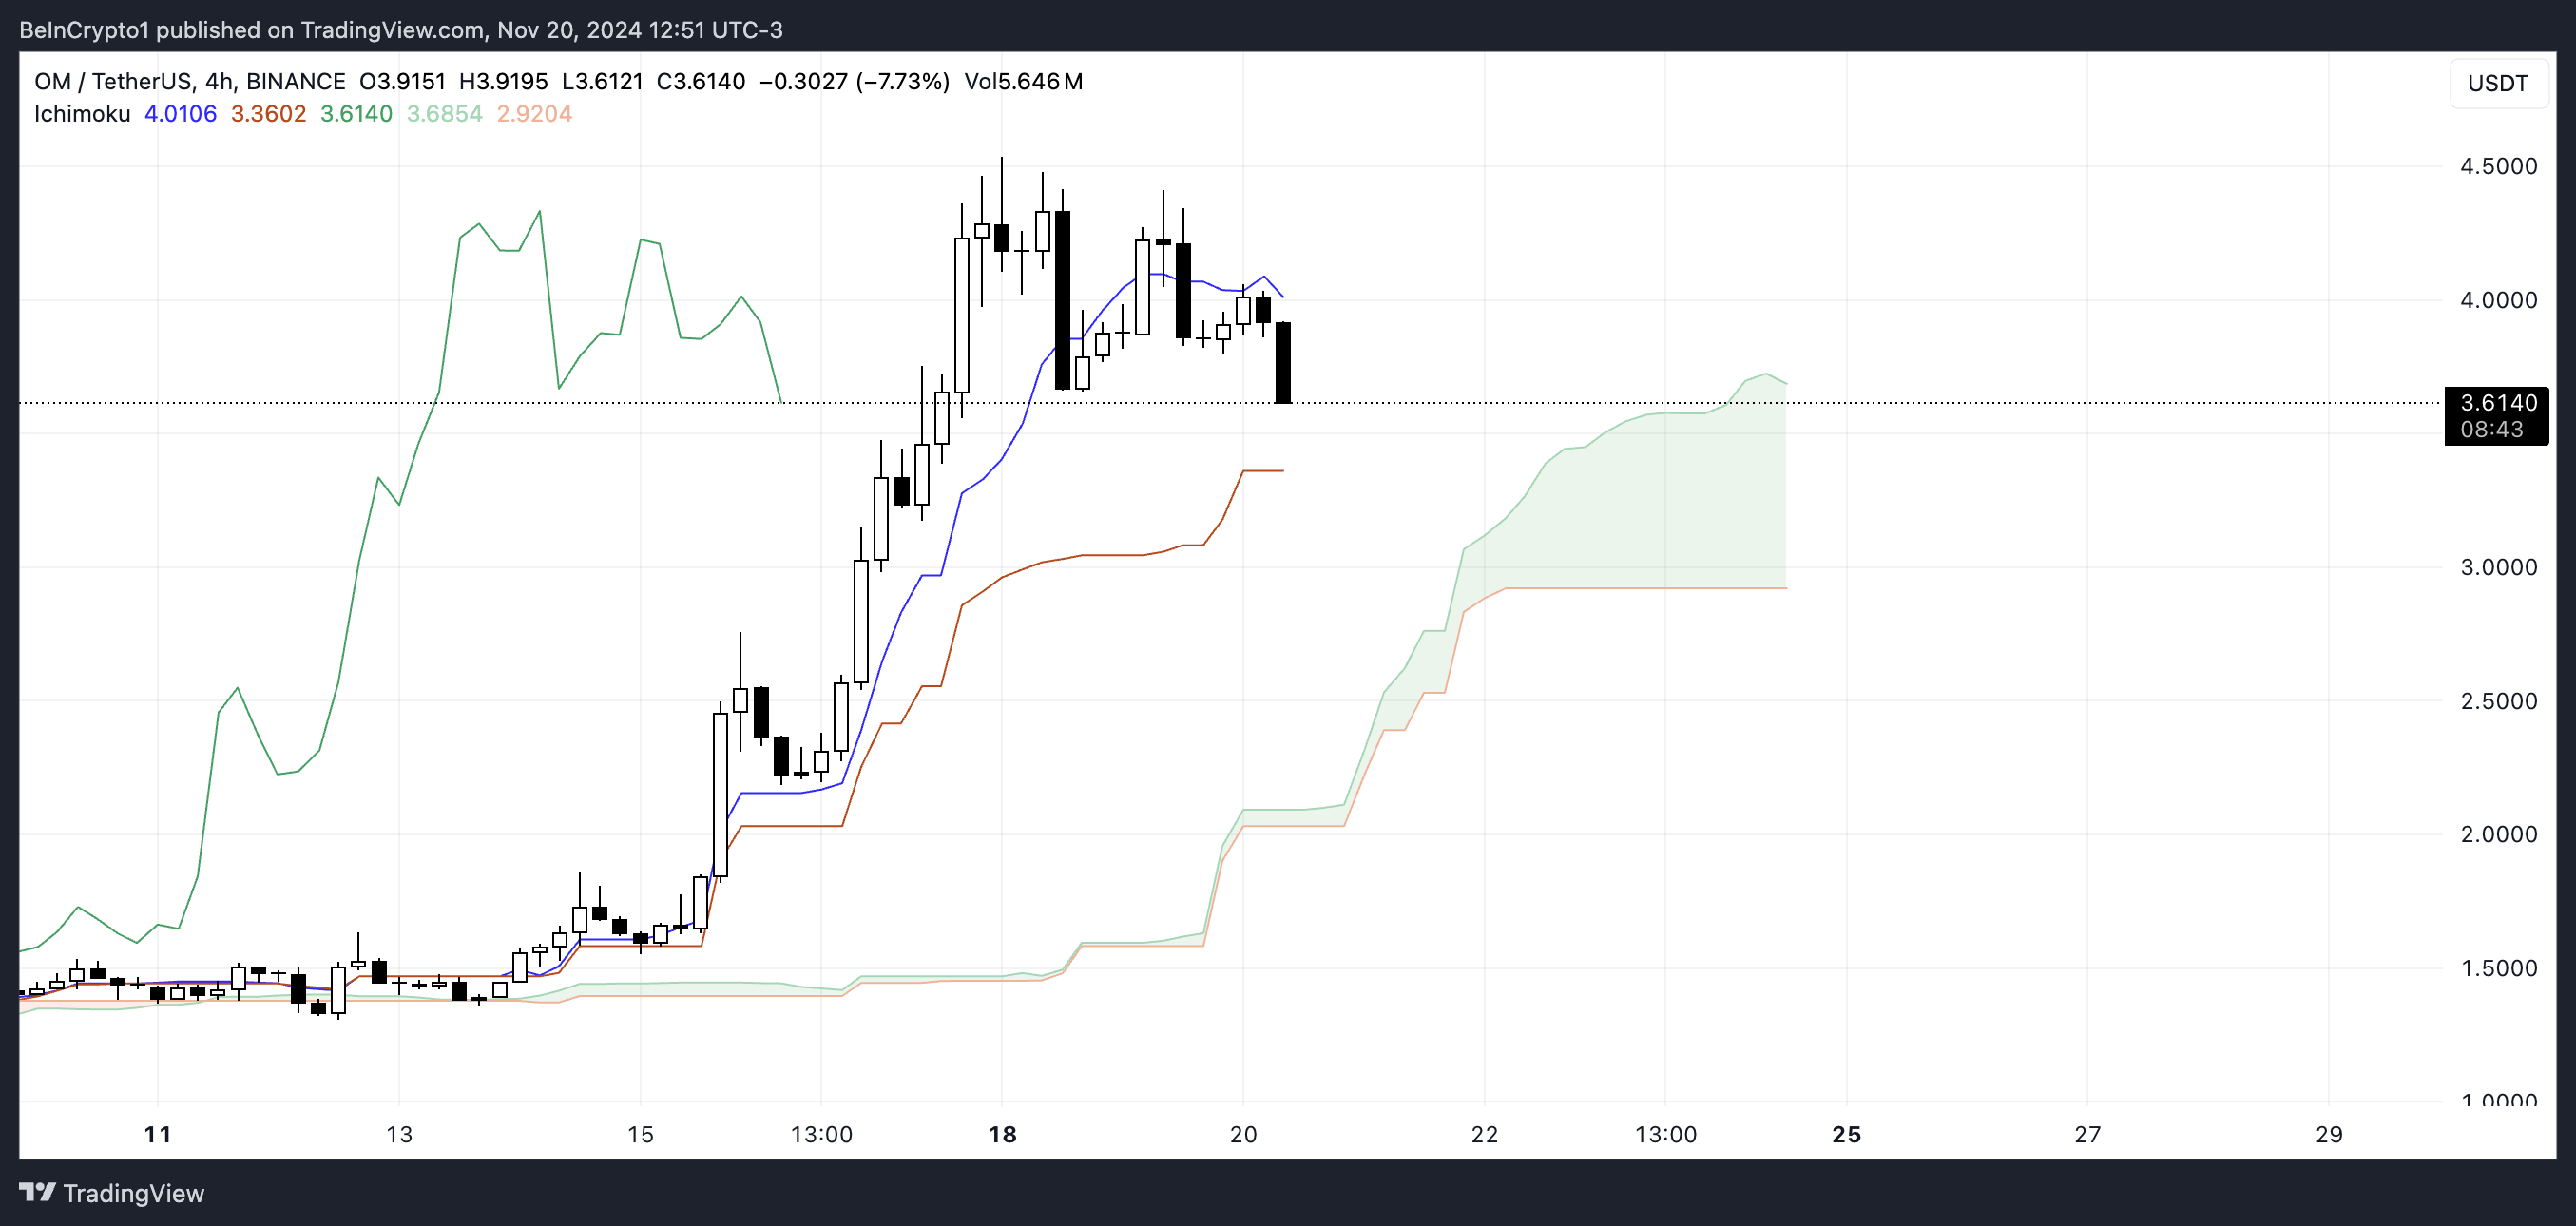
The Ichimoku Cloud chart for OM indicates that the price is showing signs of weakening. The price has fallen below the Tenkan-sen (blue line), signaling a loss of short-term momentum, and it is now approaching the lower boundary of the green cloud (Kumo).
A drop below the cloud would mark a transition into a bearish trend, as the cloud typically acts as a key support zone.

The green cloud ahead is still relatively thick, which suggests that while the overall trend may still have some support, this support is being tested.
If OM price closes below the cloud, it could indicate a potential reversal of the recent uptrend into a sustained downtrend.
OM Price Prediction: Can Mantra Go Below $3 In November?
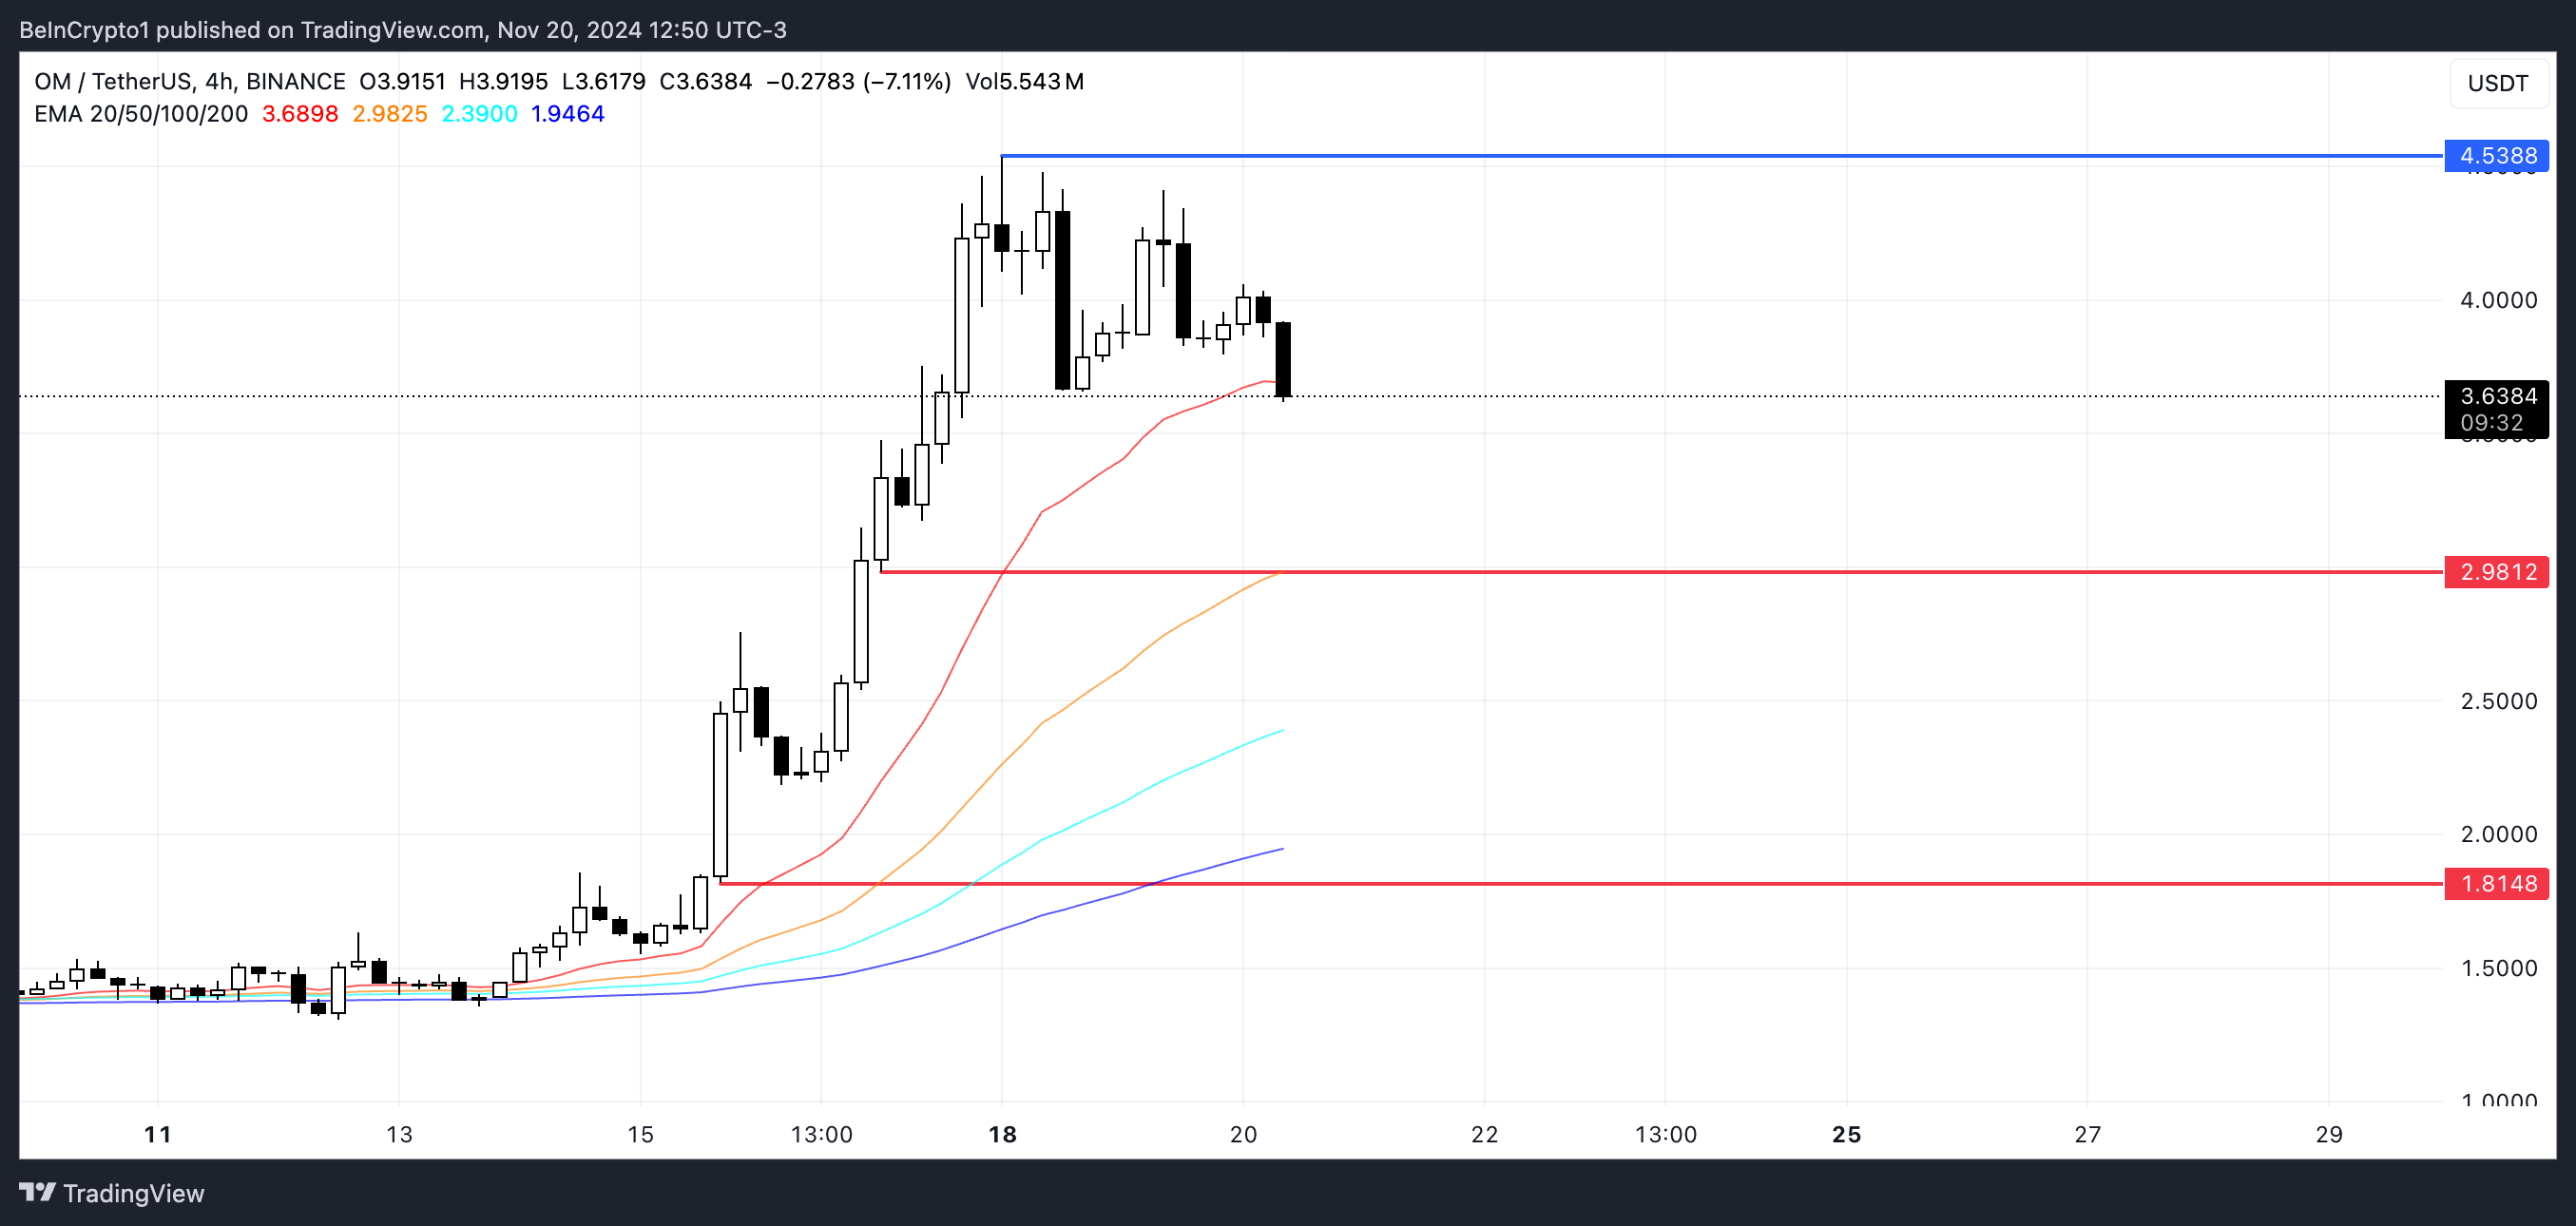
If OM’s downtrend continues to strengthen, it could test its closest support zone at $2.98. Should this level fail to hold, the price could drop further, potentially reaching as low as $1.81.
This scenario would signal a deeper bearish reversal and a significant loss of momentum.

On the other hand, if the uptrend recovers, OM price could aim for new highs by testing the $4.53 resistance zone.
Breaking through this level would likely allow OM to surpass its previous peak and set a new all-time high, establishing Mantra as one of the most relevant coins in the RWA ecosystem.
Disclaimer
In line with the Trust Project guidelines, this price analysis article is for informational purposes only and should not be considered financial or investment advice. BeInCrypto is committed to accurate, unbiased reporting, but market conditions are subject to change without notice. Always conduct your own research and consult with a professional before making any financial decisions. Please note that our Terms and Conditions, Privacy Policy, and Disclaimers have been updated.
Source link
Tiago Amaral
https://beincrypto.com/mantra-price-all-time-high-weakness/
2024-11-20 21:00:00


