Ethereum (ETH) derivatives traders have reacted to the altcoin’s failure to sustain the $3,500 level by increasing their short positions. This surge in bearish bets suggests that a majority of traders anticipate further price declines for ETH.
However, do other metrics align with this sentiment? This on-chain analysis explores whether these traders might be making the right call — or if the data hints at a potential rebound.
Ethereum Shorts Outpace Longs Amid Profit-Taking
As of this writing, the liquidation map reveals that Ethereum derivatives traders have opened short positions totaling $918 million since the cryptocurrency’s price drop yesterday.
In trading, going long or short represents a trader’s expectation of price movement. Opening a long position suggests the trader believes the price will rise. Going short, on the other hand, indicates that they expect a decline.
Currently, ETH long positions are valued at approximately $218 million, highlighting that shorts have significantly outpaced bullish exposure by $700 million. However, it is important to note that if Ethereum’s price rallies toward $3,700, most of these positions with high leverage might face liquidation.
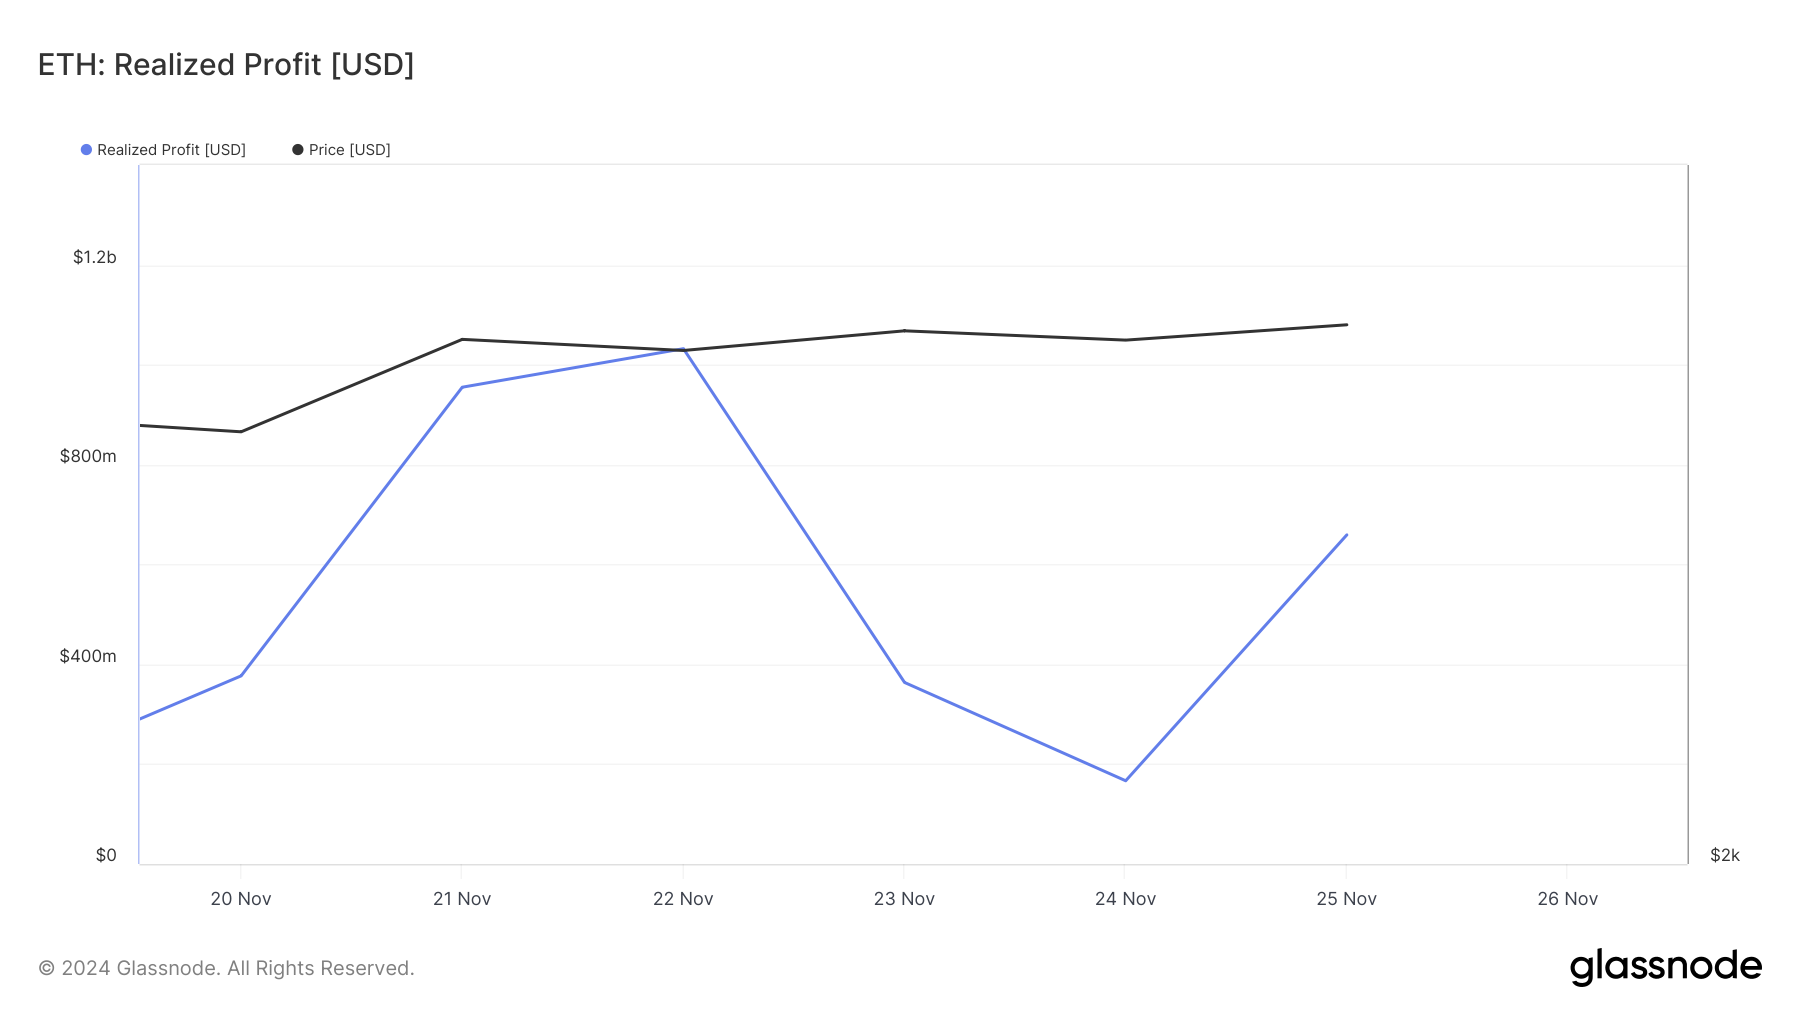
However, data from Glassnode suggests that these traders may not face liquidation unless a significant rebound occurs. This is primarily due to the rise in realized profits, which indicates that traders have locked in gains by selling or transferring assets at a higher price.
As of press time, Ethereum’s realized profits had surged to $659.22 million, suggesting that most shorts have capitalized on the price movement and may be less vulnerable to liquidation in the short term.

ETH Price Prediction: Bearish
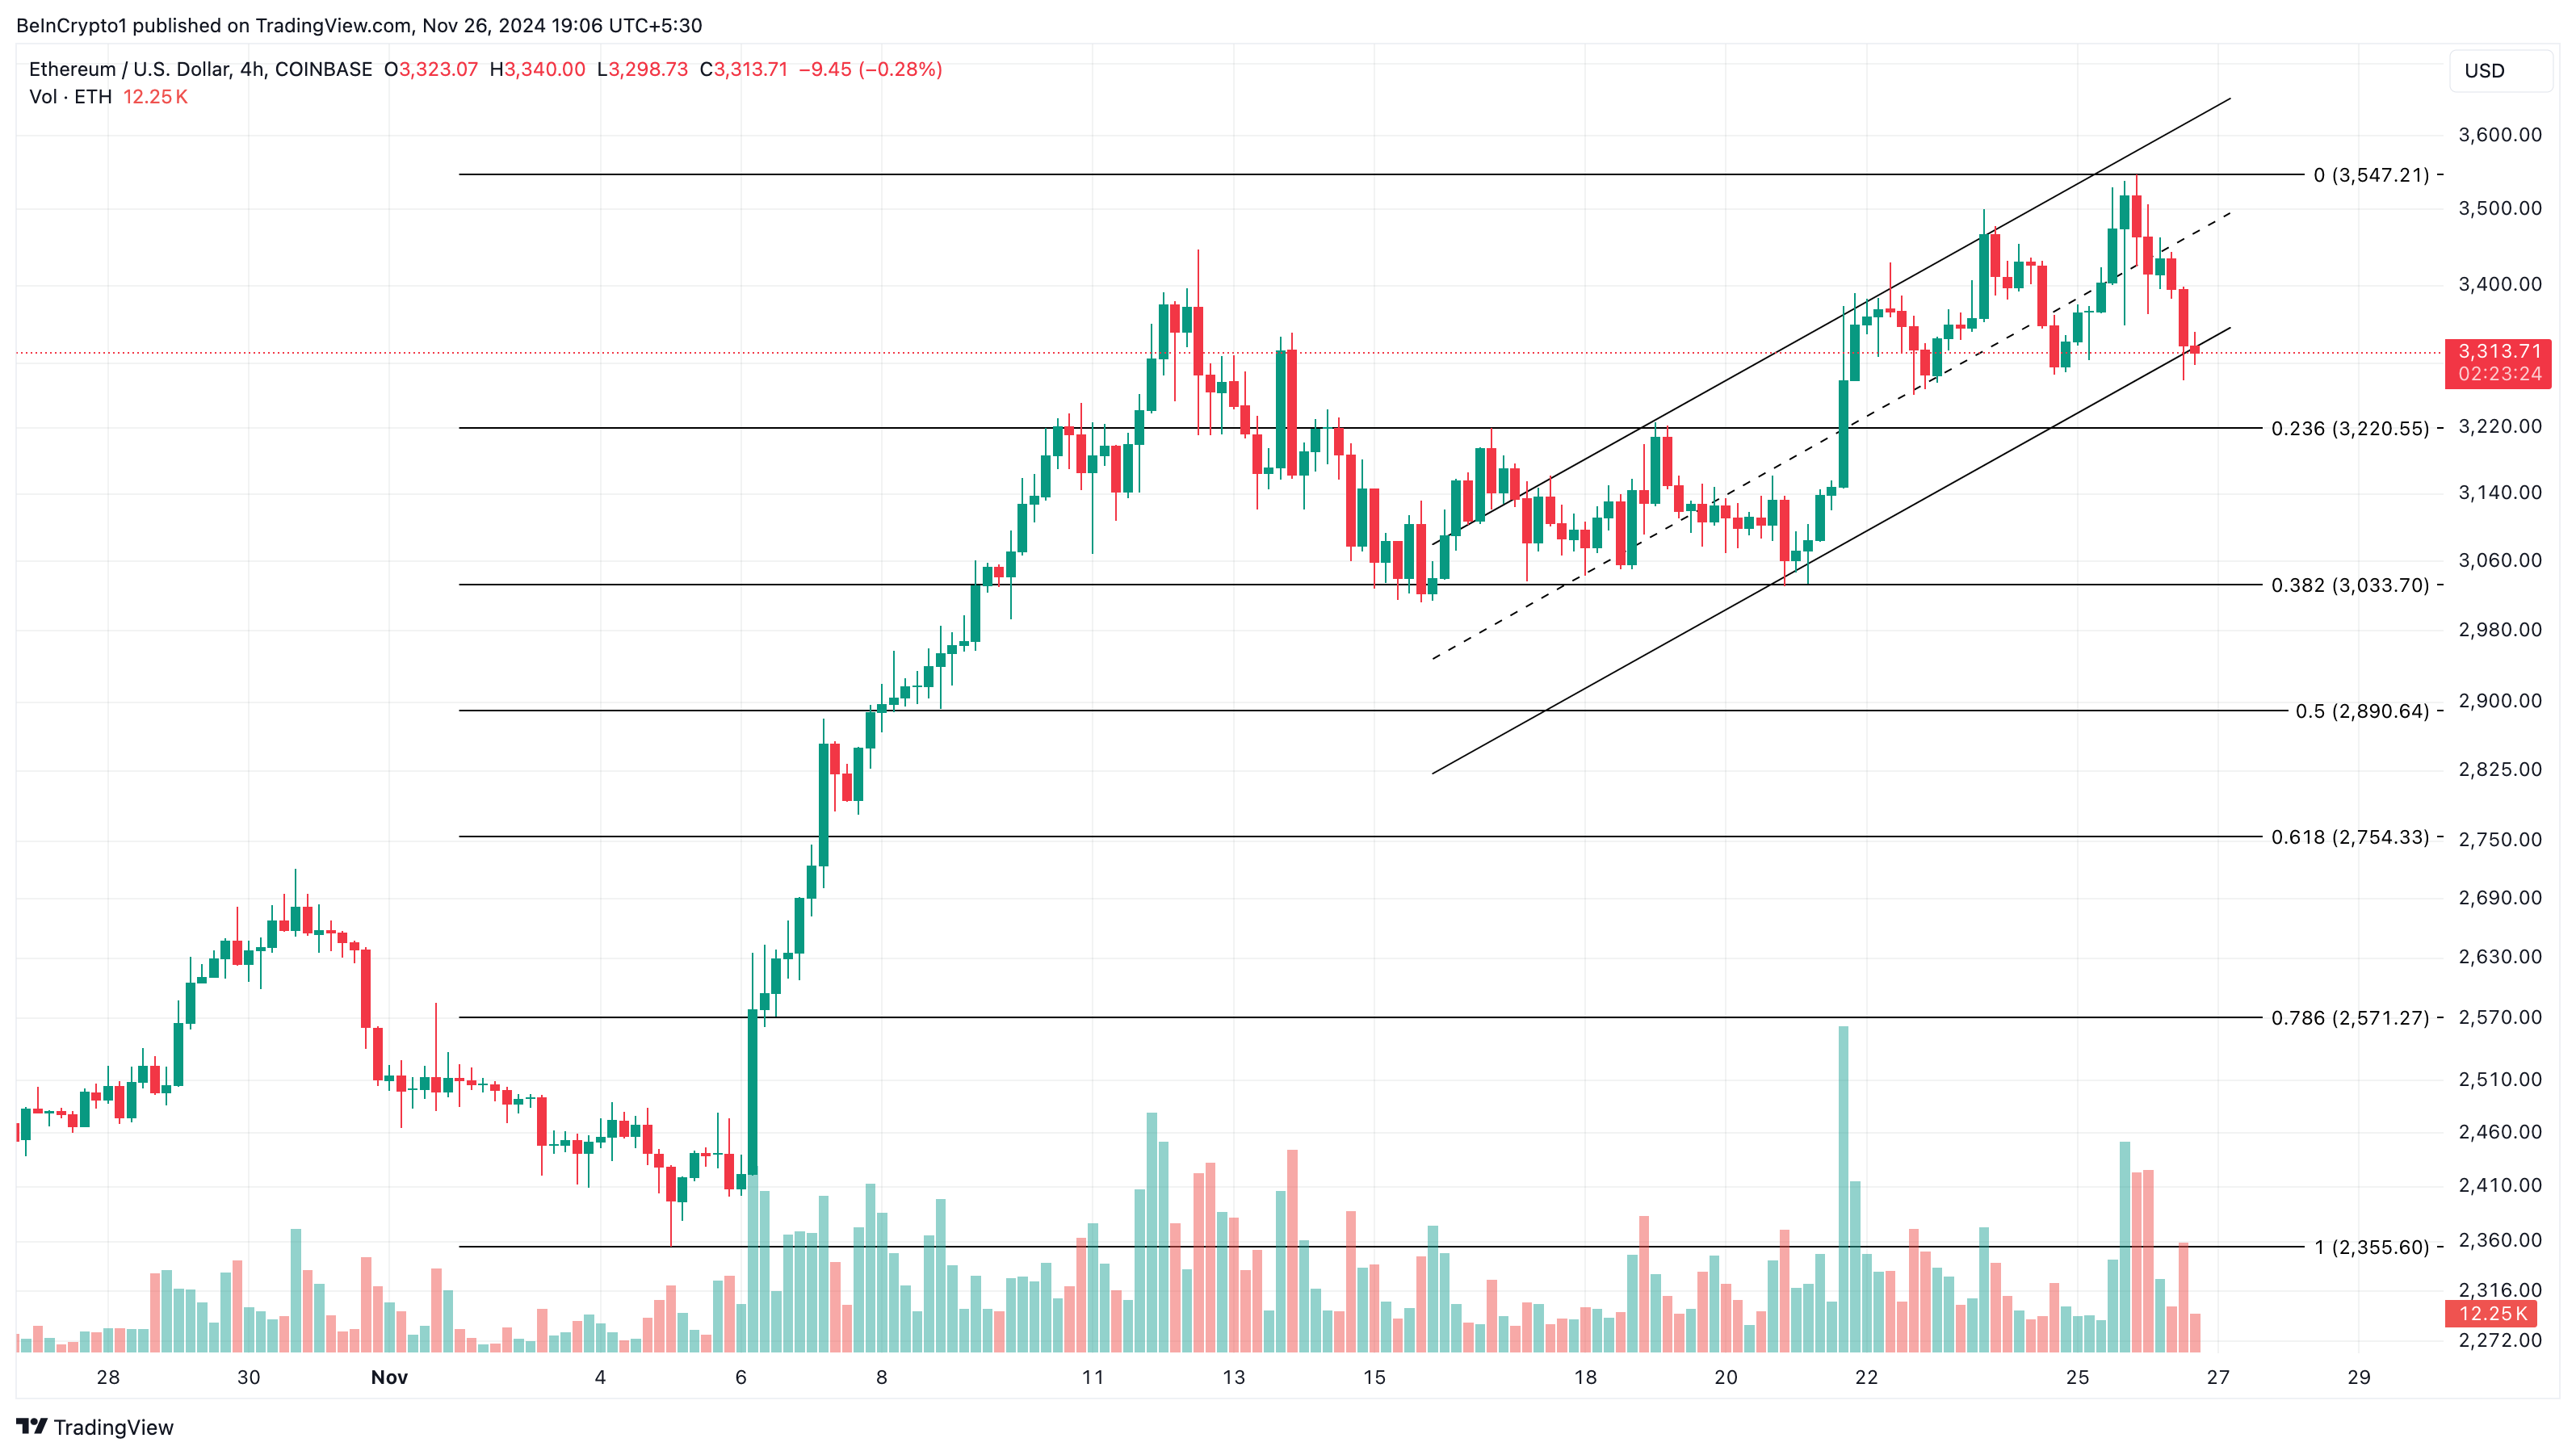
Since November 16, ETH’s price has been trading within an ascending channel. An ascending channel is a chart pattern formed by two upward trend lines, one drawn above the price (resistance) and the other below (support).
This pattern indicates that the price is moving higher within a defined range. The support line shows where the price tends to bounce higher, and the resistance line marks where the price faces selling pressure.
As seen below, ETH, at $3,314, has dropped below the support line. If selling pressure intensifies, the cryptocurrency’s value is likely to sink to $3,033.

However, Ethereum derivatives traders need to watch out. Should the altcoin fail to drop below $3,220, this might not happen. Instead, the value could rise to $3,547 and possibly climb to $4,000.
Disclaimer
In line with the Trust Project guidelines, this price analysis article is for informational purposes only and should not be considered financial or investment advice. BeInCrypto is committed to accurate, unbiased reporting, but market conditions are subject to change without notice. Always conduct your own research and consult with a professional before making any financial decisions. Please note that our Terms and Conditions, Privacy Policy, and Disclaimers have been updated.
Source link
Victor Olanrewaju
https://beincrypto.com/ethereum-derivatives-traders-respond-to-price-drop/
2024-11-26 18:30:00


