Helium (HNT) price is up roughly 150% this year and its market capitalization recently reached the $1 billion market cap. The Chaikin Money Flow (CMF) has turned positive at 0.15, signaling strong buying pressure and supporting recent price gains.
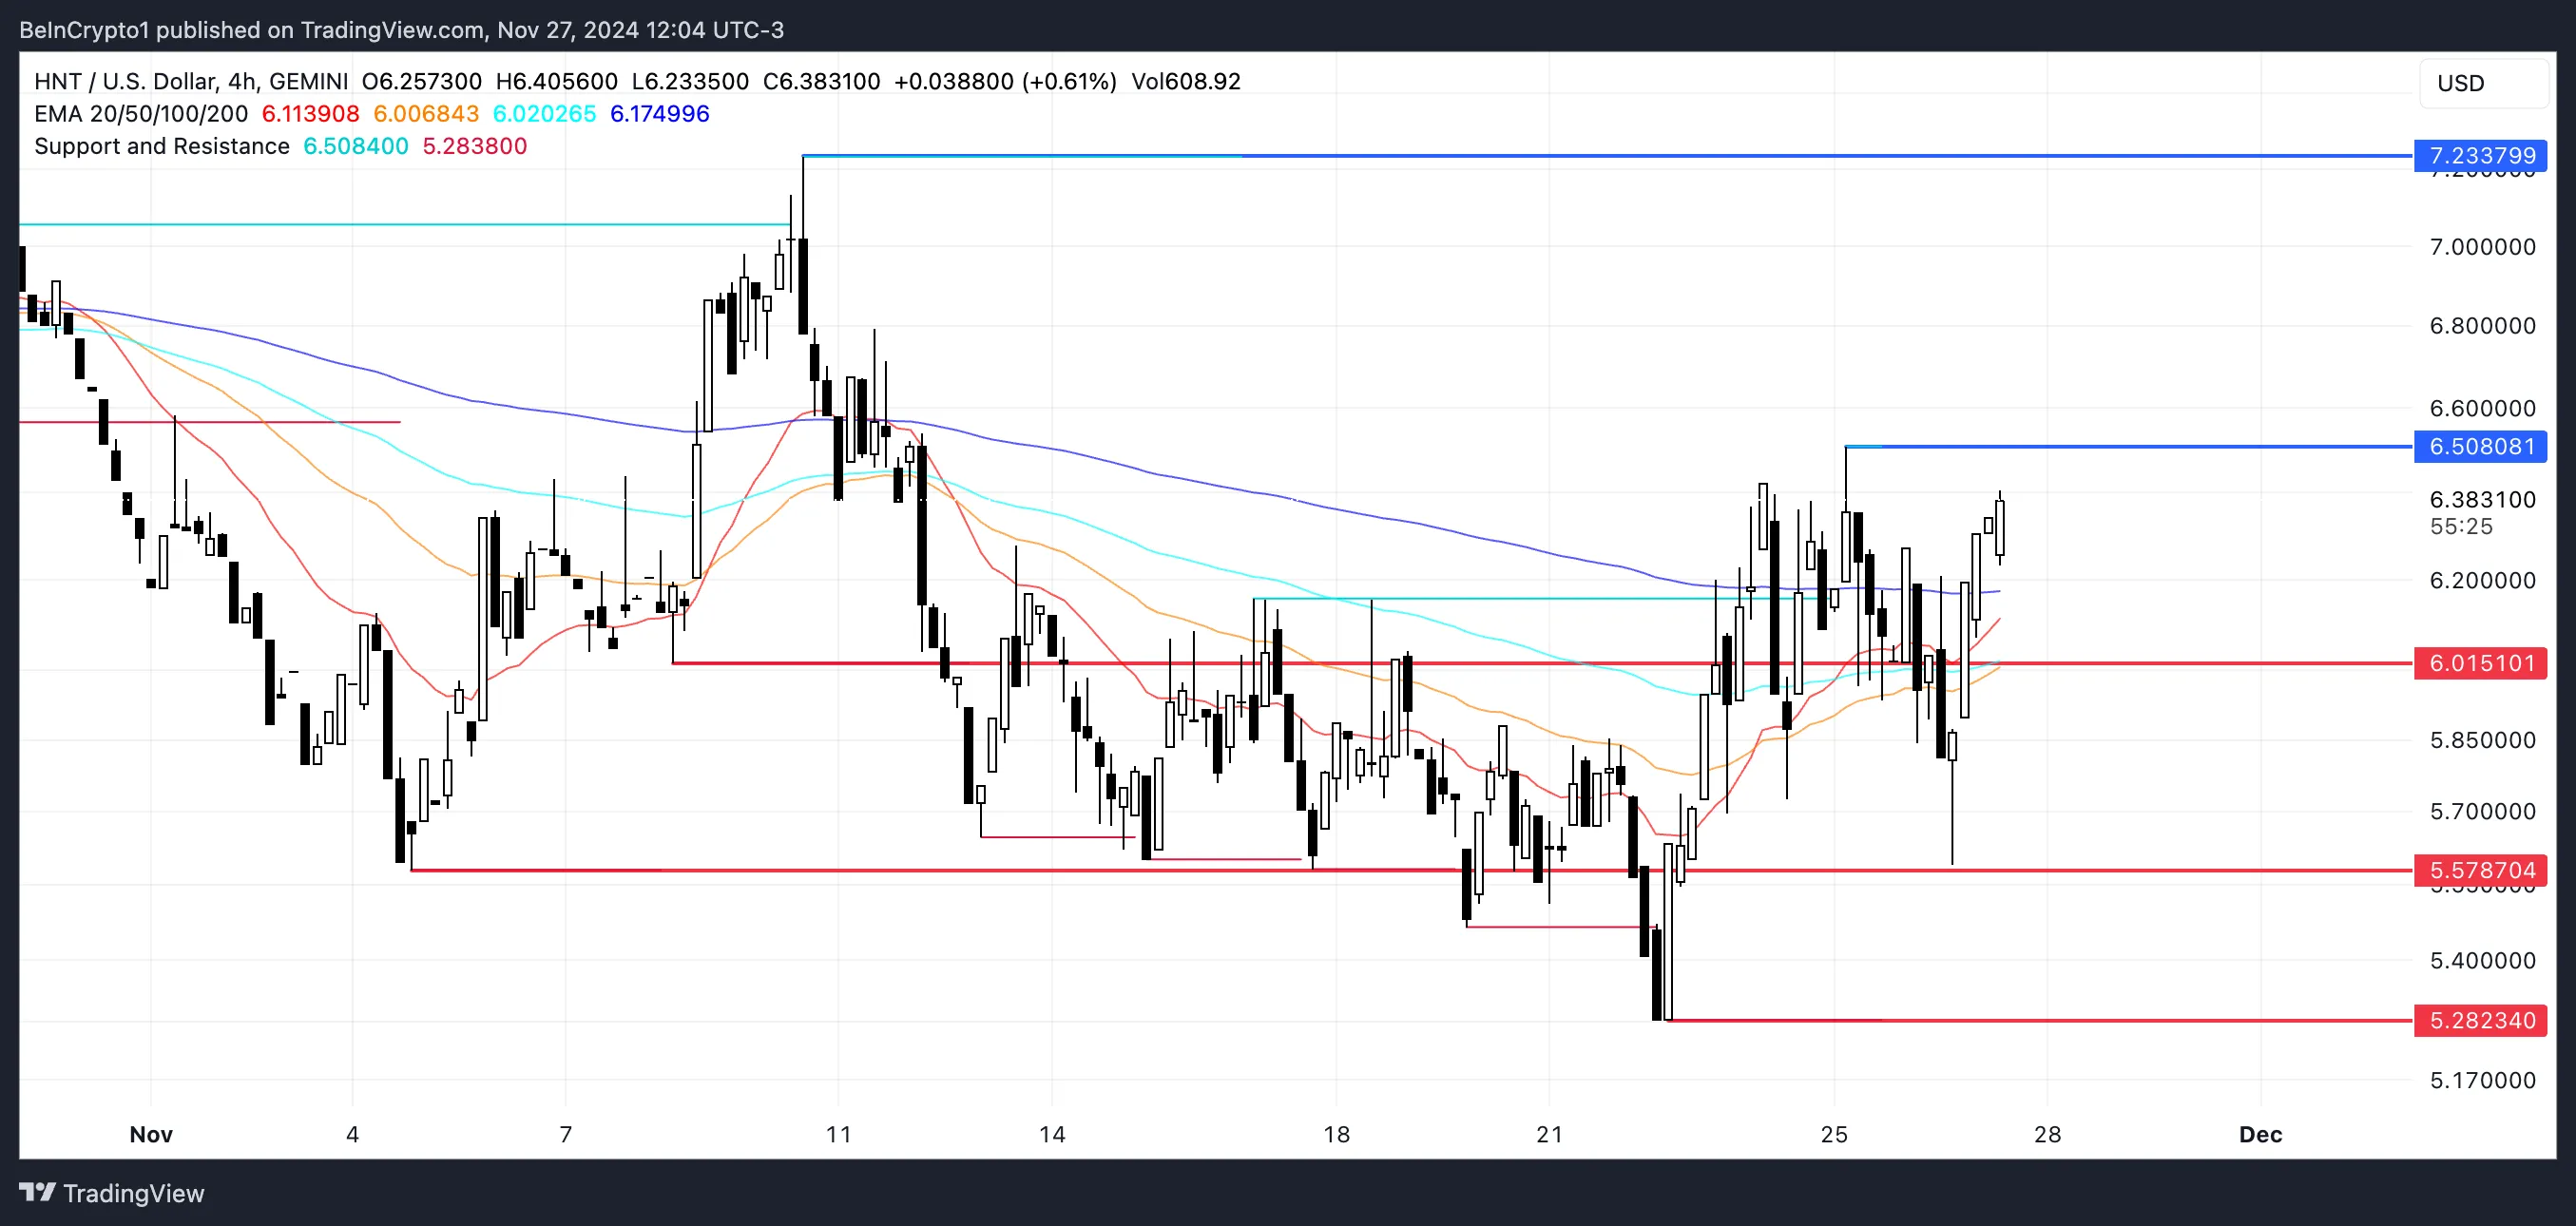
If the golden cross forms as EMA lines suggest, HNT could test resistances at $6.5 and $7.2, but a reversal might lead to support levels at $6 or as low as $5.28.
HNT CMF Is Now Positive
HNT CMF has surged to 0.15 from -0.06 in just one day, signaling a significant shift toward positive buying pressure. The CMF, or Chaikin Money Flow, measures the flow of capital into or out of an asset over a specific period, with values above 0 indicating net inflows (buying dominance) and values below 0 reflecting net outflows (selling pressure).
This sharp rise highlights growing confidence among buyers, supporting HNT’s recent 5% price increase.
A CMF of 0.15 indicates strong bullish sentiment, suggesting that the current uptrend has solid backing from capital inflows. If the CMF continues rising, it could signal further upward momentum for HNT, potentially resulting in additional price gains.
Helium RSI Shows Potential For More Price Increase
Helium RSI has climbed to 58 from 46 in just one day, reflecting growing bullish momentum. The RSI, or Relative Strength Index, measures the speed and magnitude of price changes on a scale from 0 to 100.
Values above 70 signal overbought conditions and a potential for a correction, while values below 30 indicate oversold levels, often leading to a rebound. An RSI of 58 suggests that HNT is in a healthy uptrend without approaching overbought territory yet.

With the RSI still well below 70, HNT’s current uptrend has room to continue before hitting overbought levels. This leaves space for further price growth as buying momentum builds.
If the RSI continues its upward trend, HNT price could see additional gains in the short term, supported by its current bullish sentiment.
HNT Price Prediction: Can HNT Reach $7 Soon?
HNT EMA lines show the potential formation of a golden cross, where a short-term EMA crosses above a long-term EMA. This pattern is a bullish signal, often indicating the start of a sustained uptrend.
If the golden cross forms and momentum continues, Helium price could break through the $6.5 resistance level and potentially climb to $7.2, reinforcing its bullish trajectory and the recent $1 billion market cap milestone. This would also reinforce HNT in the top 10 ranking among DePIN (Decentralized Physical Infrastructure) coins.
However, if the current uptrend weakens and reverses, HNT price may face critical support levels.
The price could first test $6, and if that fails, it might drop to $5.57 or even $5.28.
Disclaimer
In line with the Trust Project guidelines, this price analysis article is for informational purposes only and should not be considered financial or investment advice. BeInCrypto is committed to accurate, unbiased reporting, but market conditions are subject to change without notice. Always conduct your own research and consult with a professional before making any financial decisions. Please note that our Terms and Conditions, Privacy Policy, and Disclaimers have been updated.
Source link
Tiago Amaral
https://beincrypto.com/helium-billion-market-cap/
2024-11-27 21:30:00


