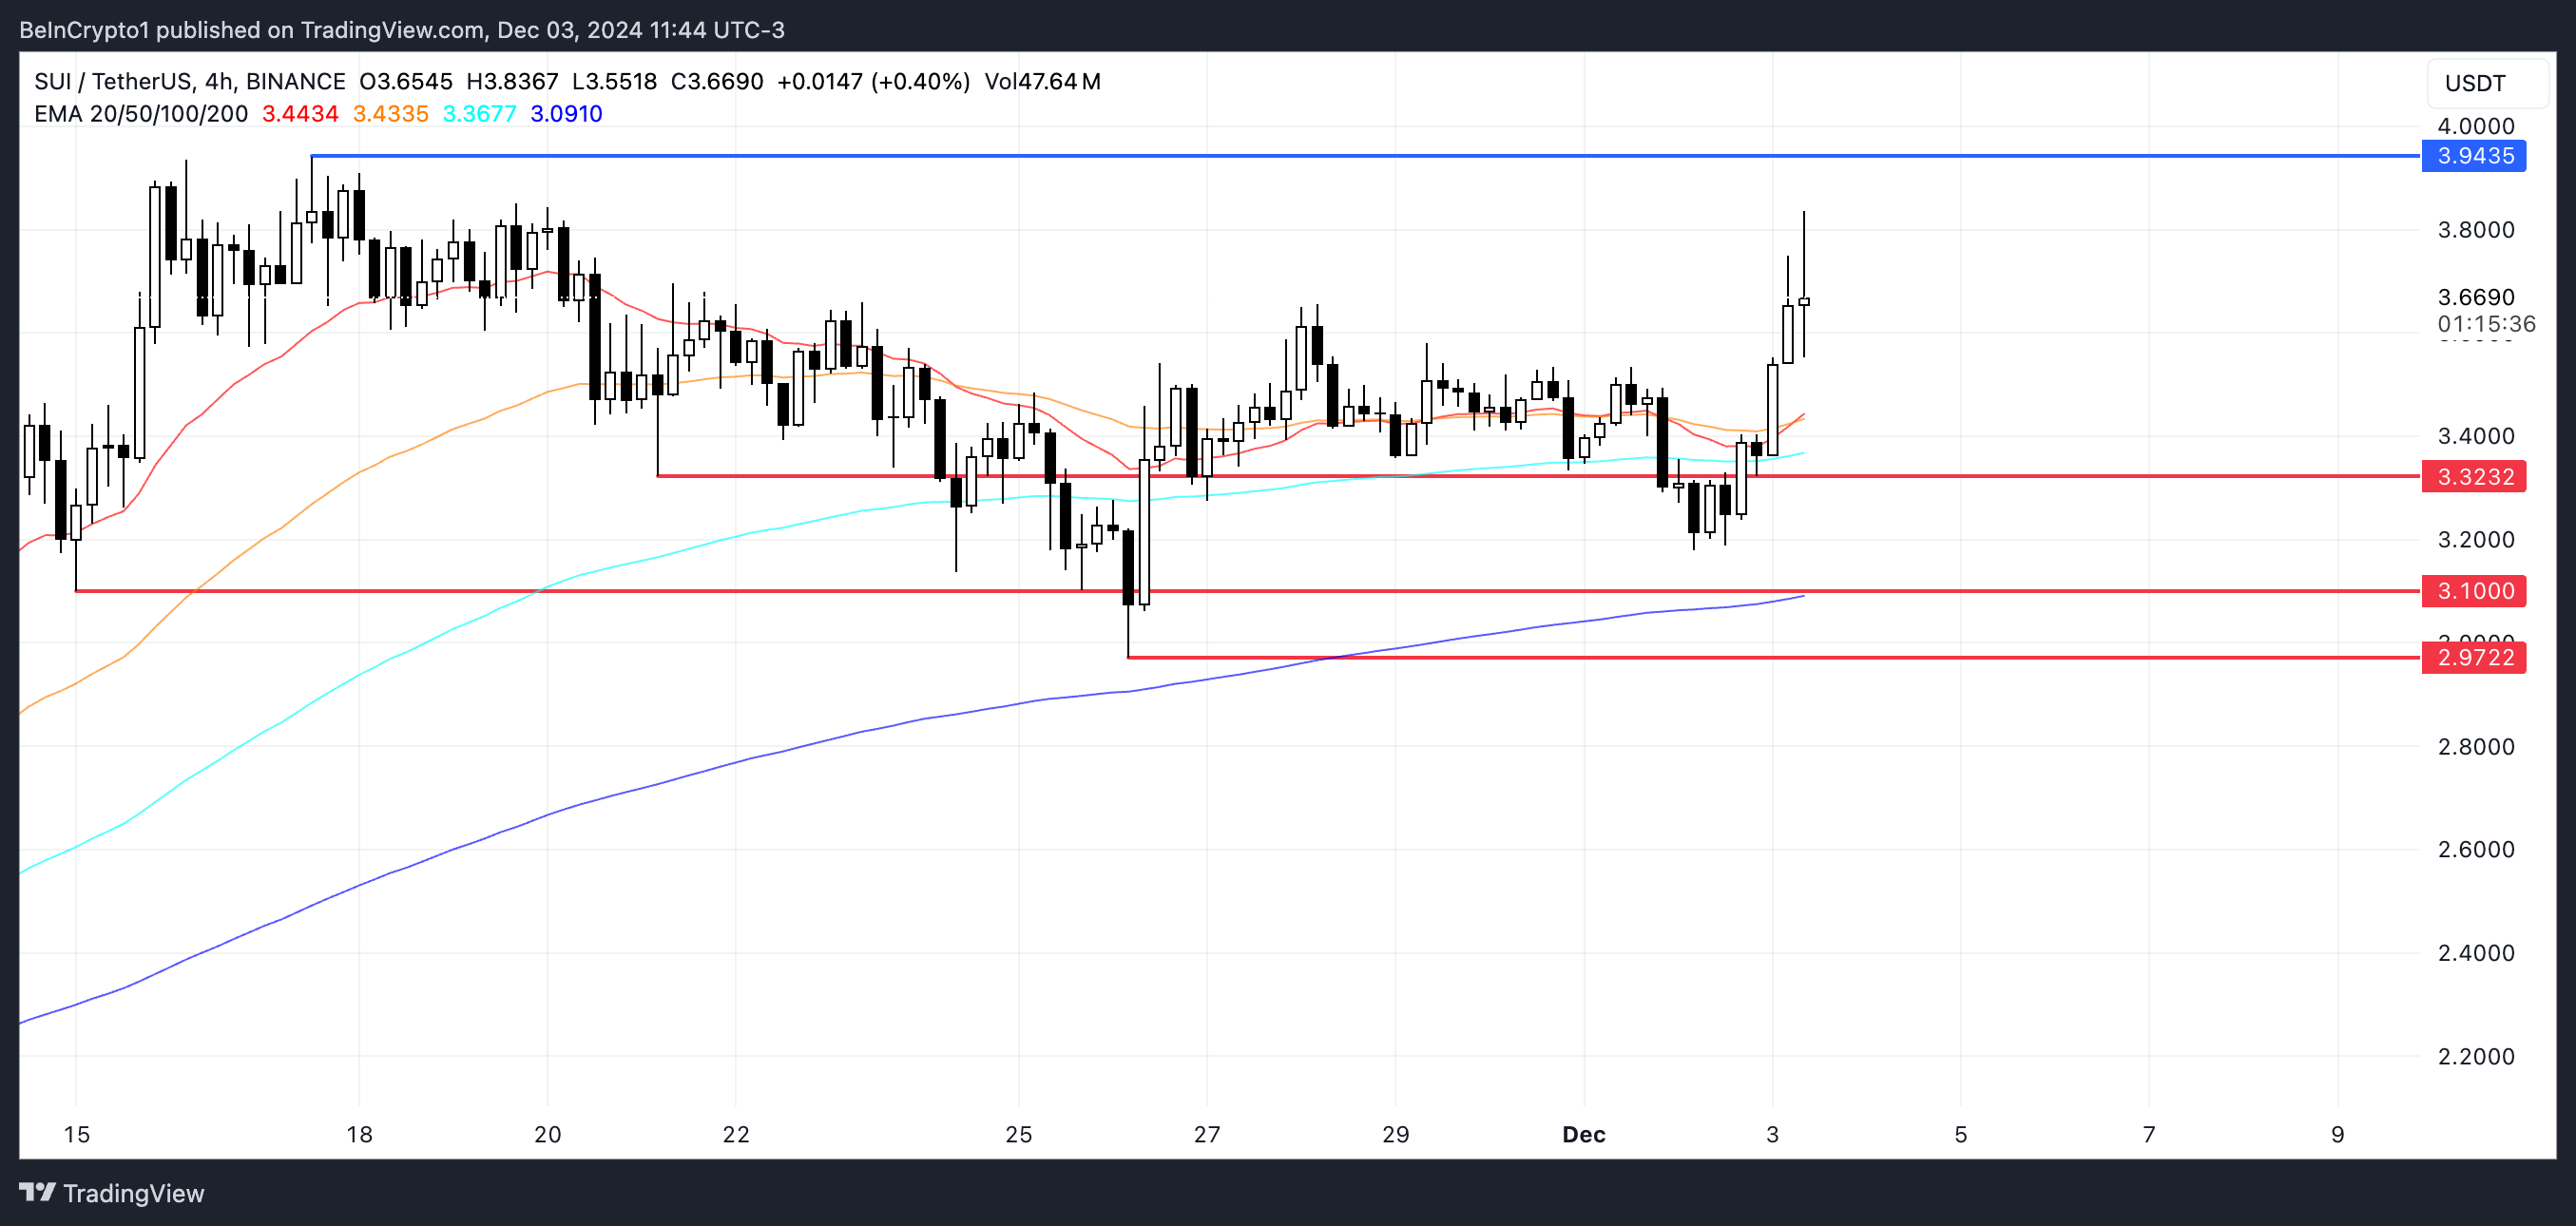
SUI price shows mixed signals after its meteoric rise, currently positioning just 6.5% below its all-time high. The coin’s impressive 97.10% surge in the last 30 days has been supported by significant growth in its DeFi ecosystem, with total value locked reaching $1.75 billion.
While technical indicators like BBTrend suggest short-term caution, the strong EMA alignment and sustained TVL levels above $1.4 billion point to underlying strength in SUI’s market structure. The coin faces a critical test at $3.94, with potential for new highs above $4.00 if bulls maintain control.
SUI TVL Is Stabilizing Above $1.4 Billion
SUI blockchain total value locked (TVL) surged from $665 million to $1.75 billion in just nine days. This dramatic increase indicates strong investor confidence and growing adoption of SUI ecosystem, as users lock more assets into smart contracts for staking, lending, and liquidity provision.
The TVL, which is currently at $1.45 billion and currently at $1.64 billion, suggests that the growth is sustainable rather than speculative. Sustained high TVL typically correlates with upward price pressure, as locked assets reduce circulating supply while increasing network utility.
With strong platform usage and diminished liquid supply, SUI price could see continued upward momentum if these TVL levels persist.
BBTrend Turned Negative After 4 Days
SUI BBTrend (Bollinger Bands Trend) indicator just turned negative and is approaching -1, signaling a significant shift in market momentum.
BBTrend measures price volatility and trend direction by analyzing how price moves relative to Bollinger Bands. Positive values indicate upward pressure, and negative values suggest downward momentum.

The shift from positive to nearly -1 suggests SUI price is moving below the lower Bollinger Band, indicating increased selling pressure.
This technical warning sign could lead to a short-term price correction as traders often use BBTrend crossovers into negative territory as sell signals. However, extreme negative readings can also indicate oversold conditions that sometimes precede price bounces once selling exhausts.
SUI Price Prediction: Is $4 the Next Target?
SUI price currently shows strong bullish momentum with the EMA (Exponential Moving Average) lines aligned in a favorable pattern.
The price has room for significant upside potential, with immediate targets at the previous all-time high of $3.94 and a psychological resistance at $4.00. This would represent a new all-time high for SUI.

However, the market faces key support levels that need to be held back to maintain the uptrend. A bearish reversal could trigger a cascade of support tests at $3.32 and $3.10, with $2.97 serving as a critical floor for SUI price.
Breaking below these levels could accelerate selling pressure, though the current EMA configuration suggests bulls still maintain overall control of the market momentum.
Disclaimer
In line with the Trust Project guidelines, this price analysis article is for informational purposes only and should not be considered financial or investment advice. BeInCrypto is committed to accurate, unbiased reporting, but market conditions are subject to change without notice. Always conduct your own research and consult with a professional before making any financial decisions. Please note that our Terms and Conditions, Privacy Policy, and Disclaimers have been updated.
Source link
Tiago Amaral
https://beincrypto.com/sui-nears-all-time-high/
2024-12-03 20:00:00


