Solana (SOL) traders seem confident that the recent decline in the altcoin’s price is only a brief decline instead of a long-haul choppy period. This is evident from the position Solana longs has taken since the broader market liquidation, which ran into hundreds of thousands of dollars.
But do indicators agree with this sentiment? Here is a thorough analysis of the potential SOL price movement.
Solana Traders Confident in the Altcoin’s Recovery
According to Coinglass, the Solana Long/Short ratio is 1.14. As the name implies, the long/short ratio acts as a barometer of traders’ expectations in the market. When the ratio is below, it means there are more shorts than longs in the market.
A reading above 1, however, signifies more longs than shorts. For context, longs are traders with positions anticipating a price increase. Shorts, on the other hand, are traders expecting a decrease.
Therefore, the current ratio indicates that Solana longs are dominant in the market. Hence, the average sentiment is bullish and, if validated, could turn profitable for these traders. Interestingly, this is happening at a time when the market faced the highest number of liquidations in the last few days.
Over the past 24 hours, SOL liquidations have totaled approximately $60 million. Of this amount, long positions accounted for over $57 million, while shorts made up the rest. Liquidations occur when a trader’s margin falls short, prompting the exchange to close the position to prevent further losses.
This wave of liquidations was triggered by Solana’s price dropping below $215, sparking a cascade of margin calls and forced closures.

SOL Price Prediction: Not Yet Time for a Rebound
On the daily chart, the SOL price has dropped below the 20 and 50 Exponential Moving Averages (EMA), which are technical indicators that measure trend direction.
When the price is above the EMA, the trend is bullish. On the other hand, if the price is below the EMA, the trend is bearish, which is the case with the SOL price.
Another noticeable trend on the chart below is that the SOL price is trading below the demand zone at $210. If the altcoin fails to recover above this zone, the correction might intensify, and the token’s value might decline to $189.36.
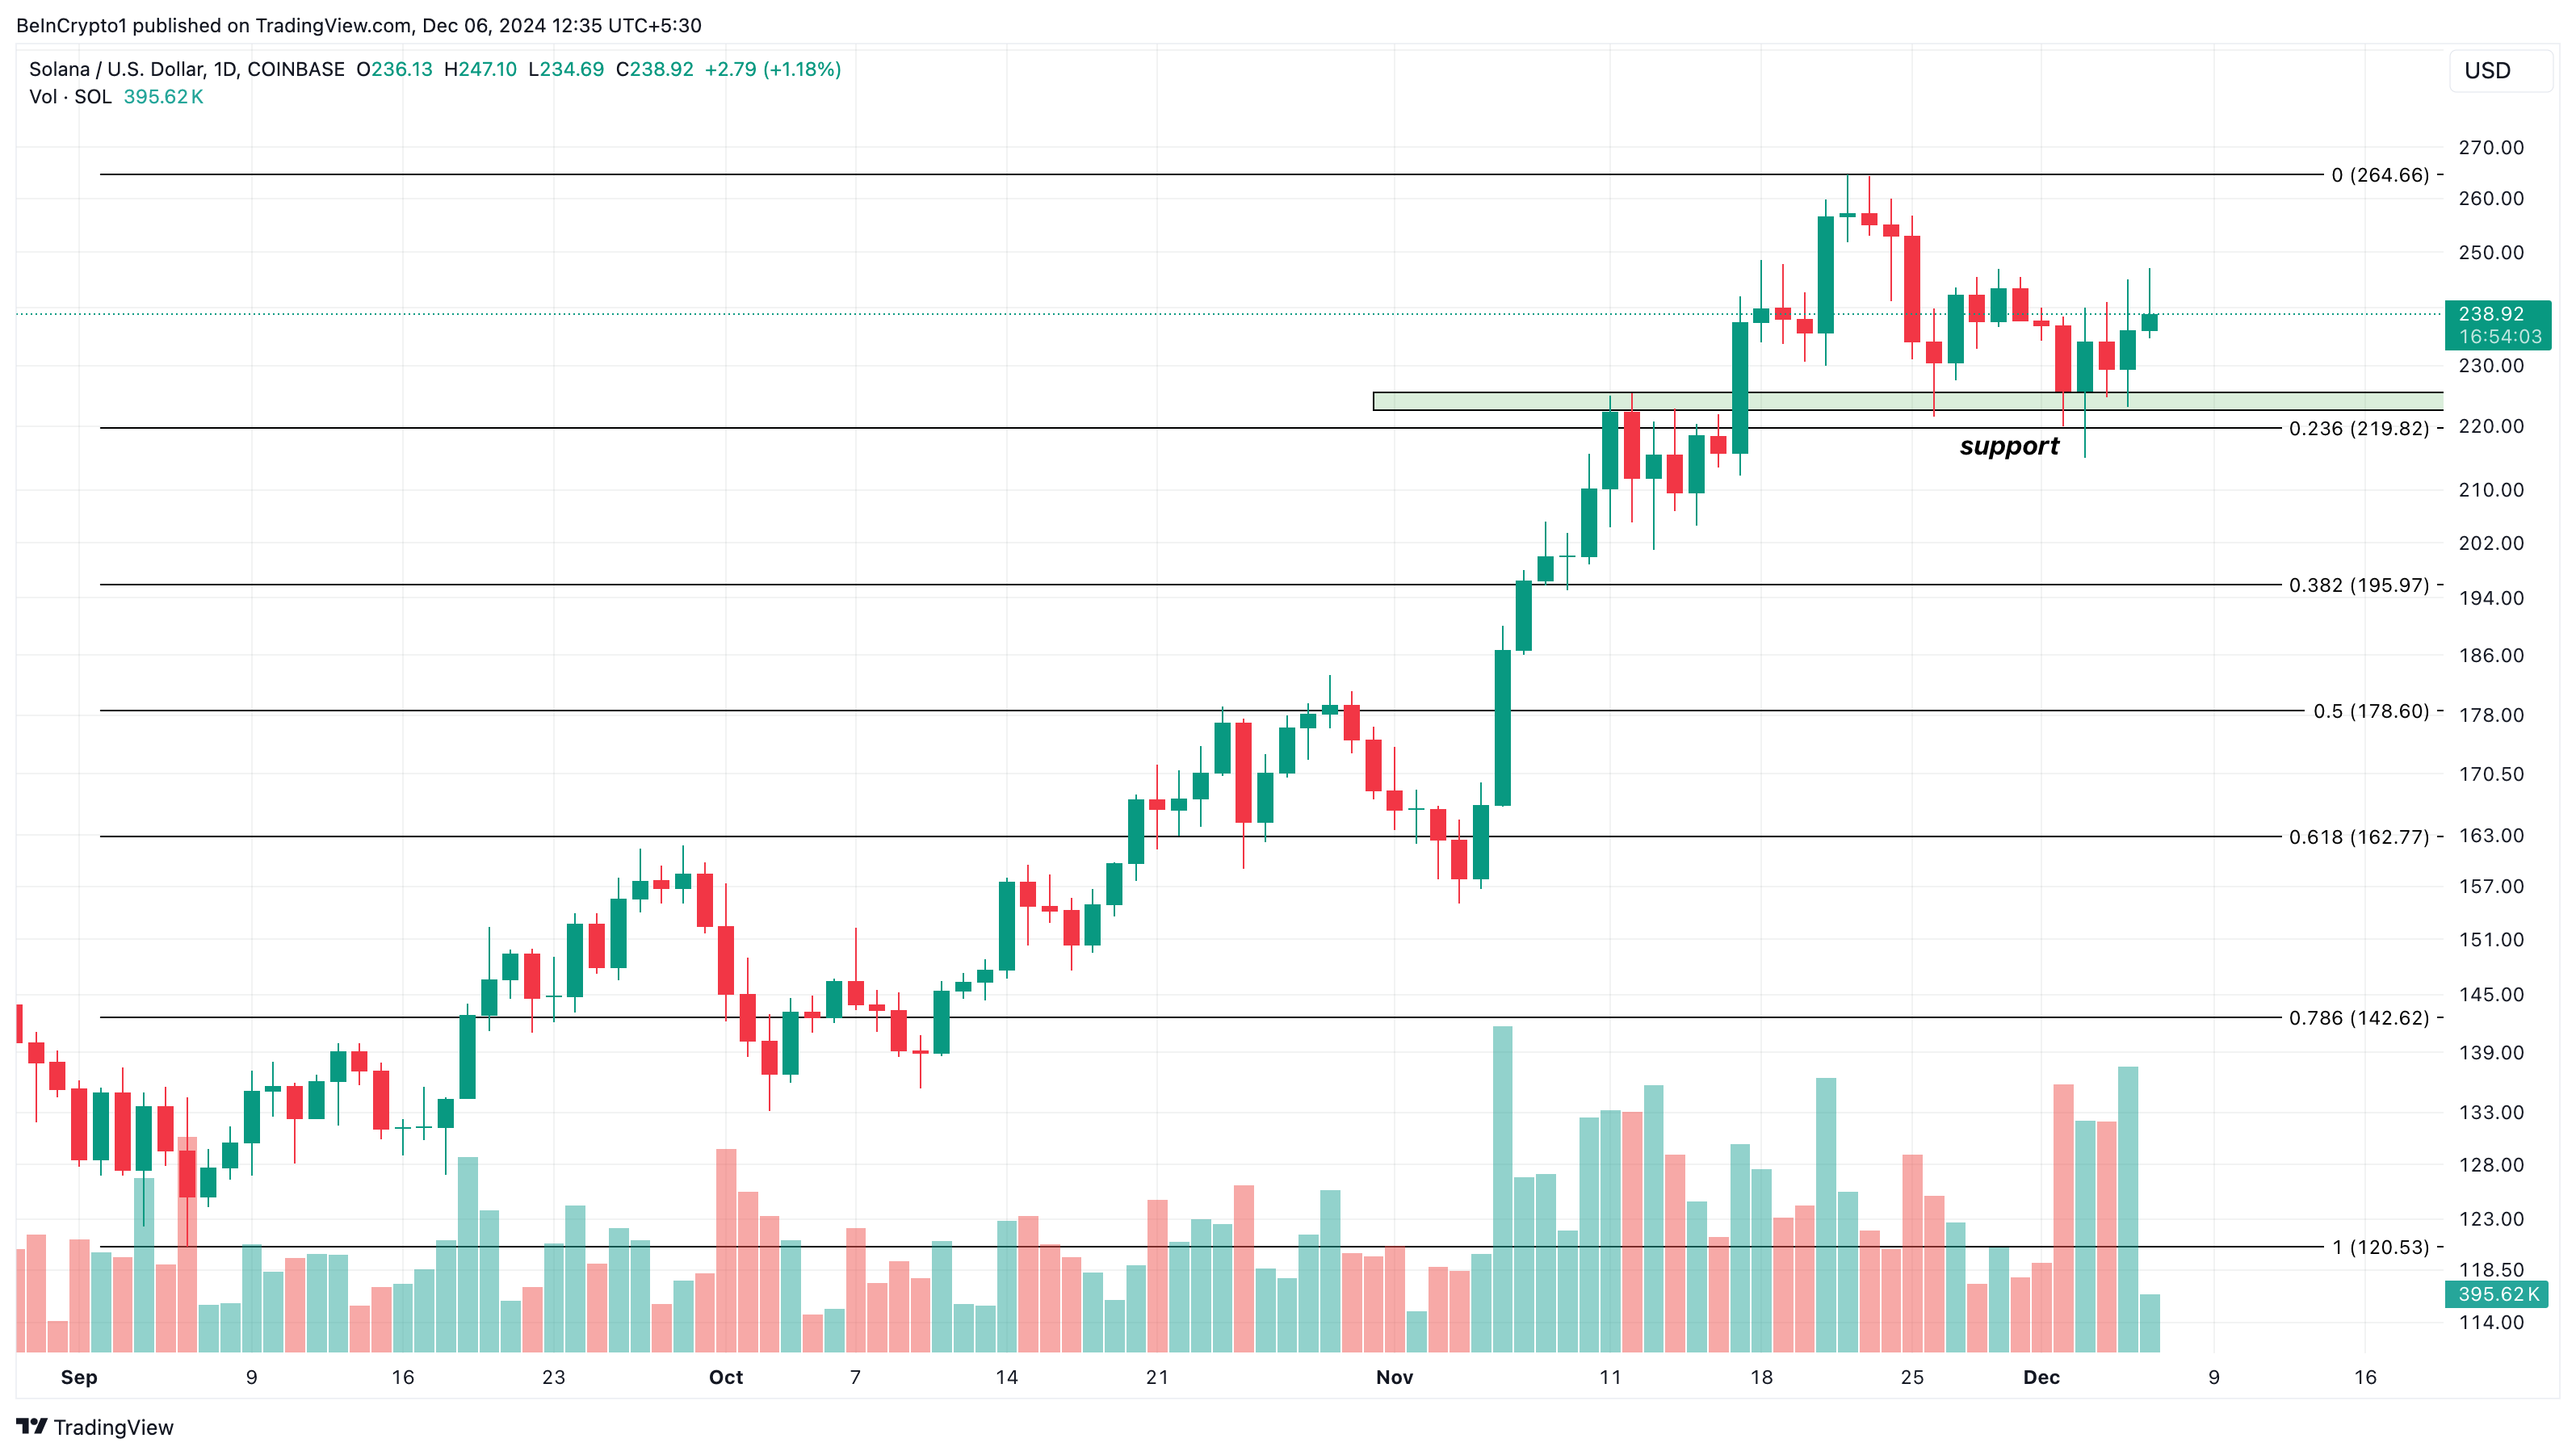
However, if Solana sees increased buying pressure, the trend might reverse, and it could rally toward $264.66.
Disclaimer
In line with the Trust Project guidelines, this price analysis article is for informational purposes only and should not be considered financial or investment advice. BeInCrypto is committed to accurate, unbiased reporting, but market conditions are subject to change without notice. Always conduct your own research and consult with a professional before making any financial decisions. Please note that our Terms and Conditions, Privacy Policy, and Disclaimers have been updated.
Source link
Victor Olanrewaju
https://beincrypto.com/solana-longs-seek-recovery-liquidation/
2024-12-10 20:30:00


