Leading meme coin Shiba Inu has noted a 10% price fall in the past 24 hours. This drop follows a surge in profit-taking by traders, who cashed out a staggering $426 million on Tuesday, its biggest single-day selloff since 2022.
With continued profit-taking, SHIB’s price could extend its decline. Here is why.
Shiba Inu Sellers Offload Coins For Profit
On January 7, SHIB’s Network Realized Profit/Loss (NPL) totaled $426 million, marking its highest single-day value since February 2022.
A coin’s NPL measures the difference between the price at which the asset was last moved or sold and the current market price. It tells us how much profit or loss users on the network “realize.”
When an asset’s NPL spikes upward, it indicates that a significant portion of the cryptocurrency held by its investors is being sold at a profit. This sudden influx of selling pressure can exert downward pressure on the asset’s price, especially when the market cannot absorb the increased supply.
Further, SHIB’s Relative Strength Index (RSI) confirms this surge in selling pressure. At press time, it is below the 50-neutral line at 41.96 and in a downward trend.
The RSI indicator measures an asset’s oversold and overbought market conditions. It ranges between 0 and 100, with values above 70 indicating that the asset is overbought and due for a decline. On the other hand, values below 30 suggest that the asset is oversold and may witness a rebound.
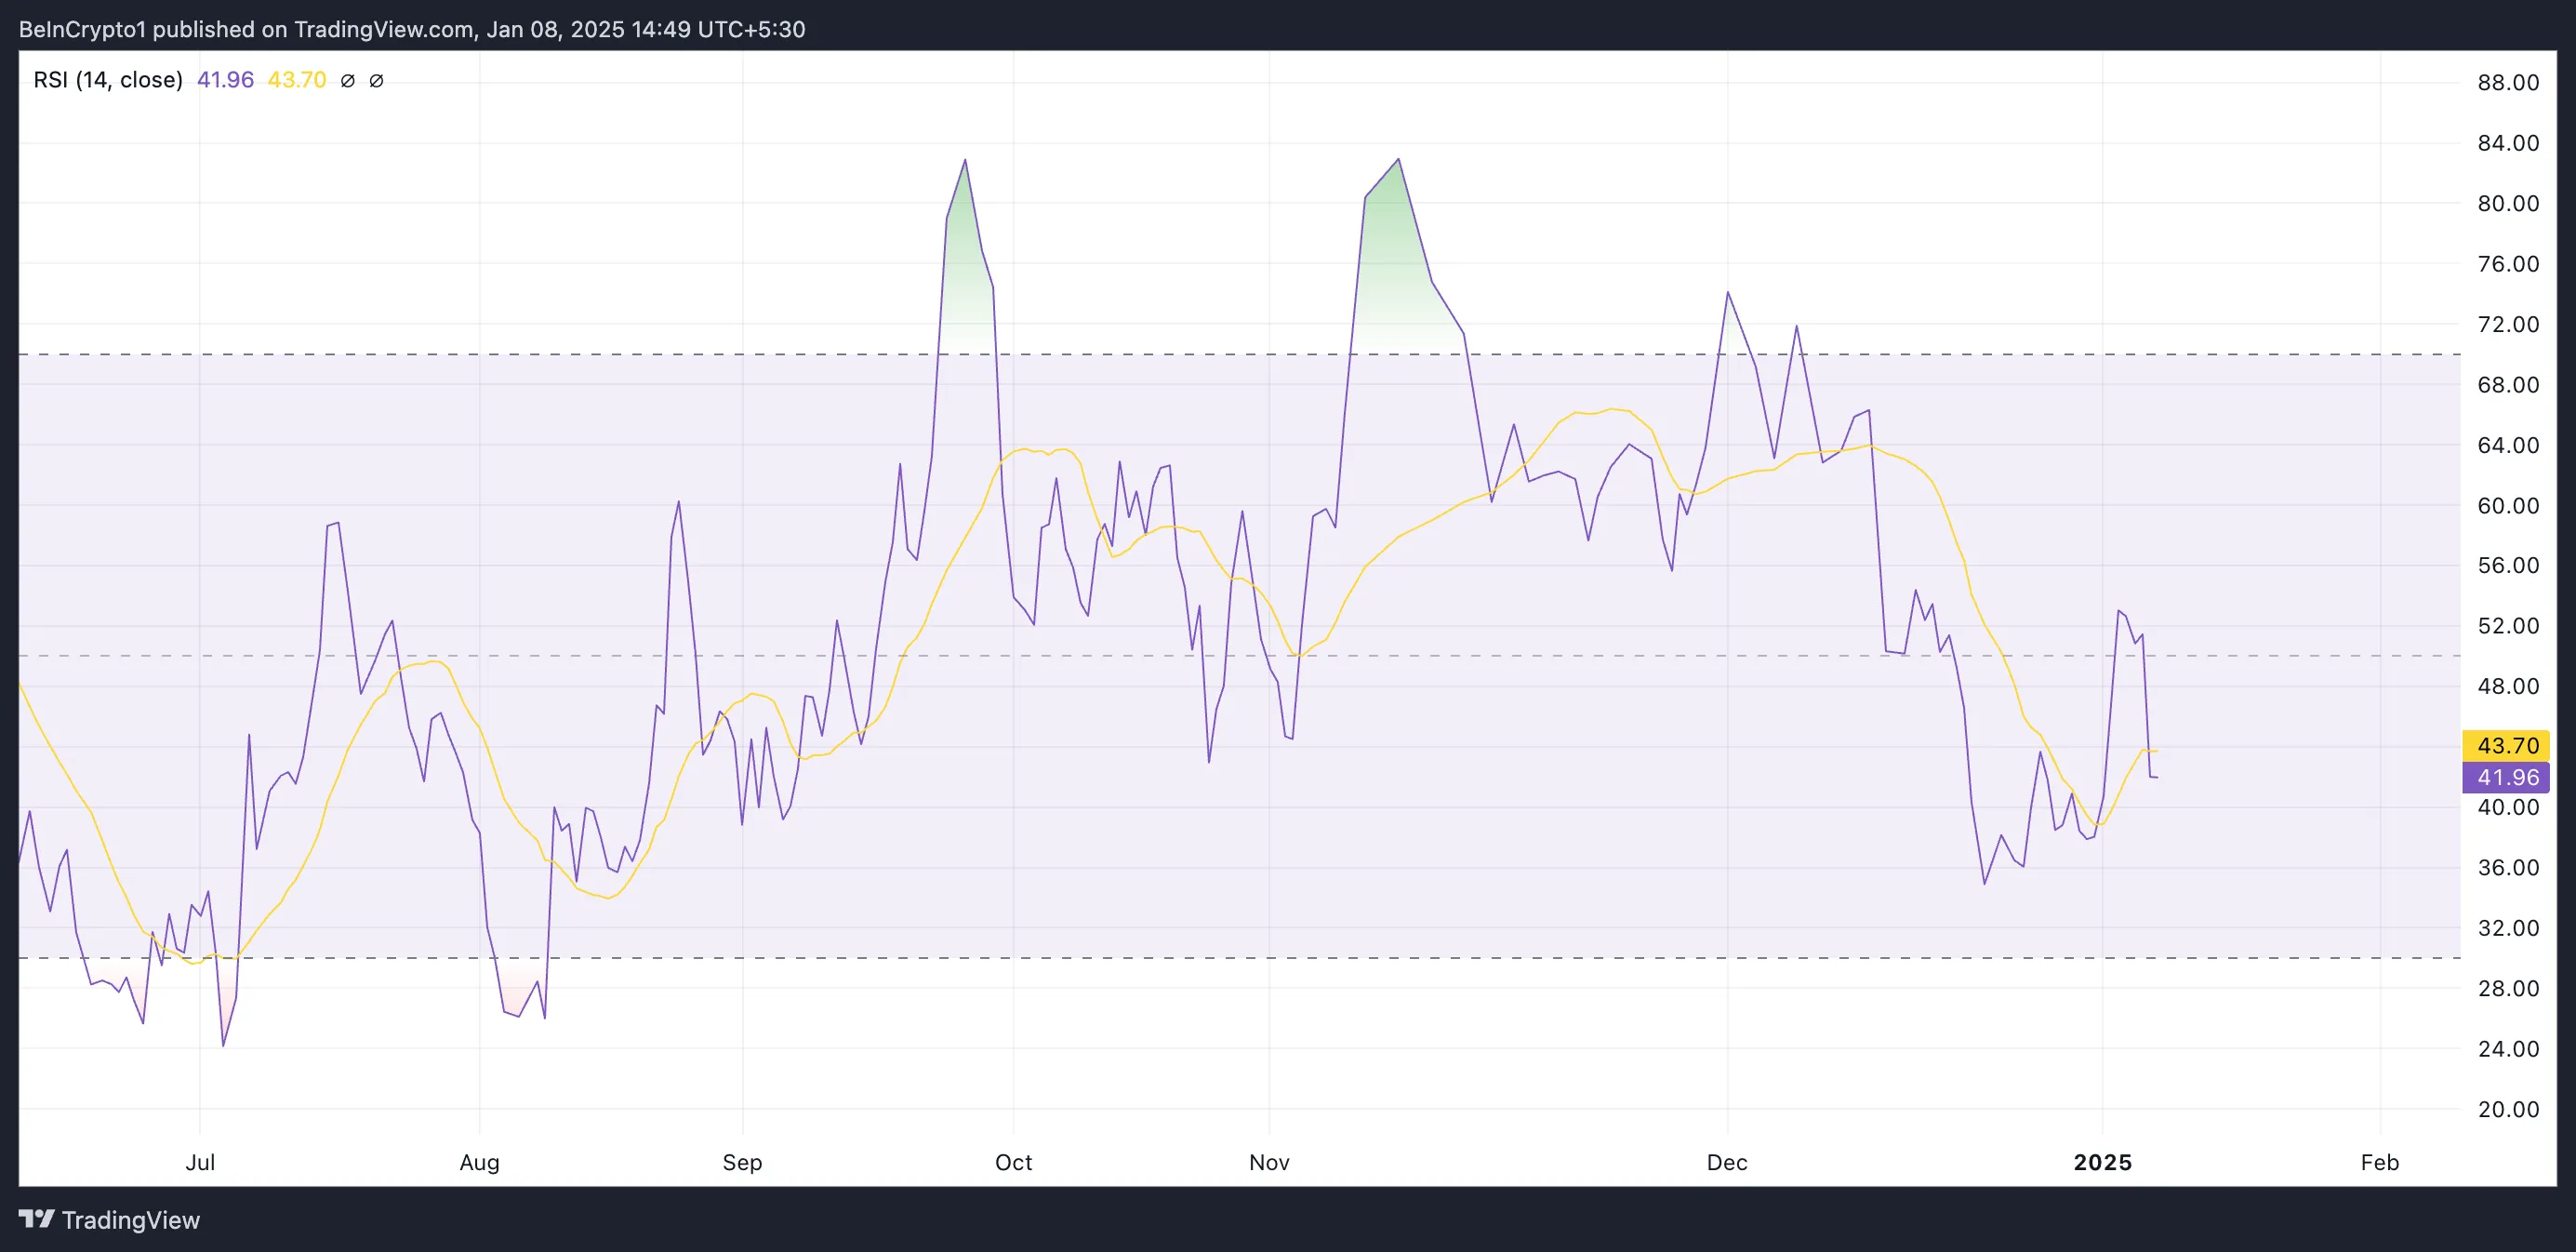
SHIB’s RSI reading of 41.96 suggests increasing selling pressure, which is a sign of market weakness. If the RSI continues to decline toward 30, the meme coin’s price may drop further.
SHIB Price Prediction: More Declines Lie Ahead
On the daily chart, SHIB has traded within a descending parallel channel for the past 30 days — a bearish pattern formed by two downward-sloping, parallel trendlines that indicate consistent lower highs and lower lows. This suggests sustained selling pressure. If SHIB remains in this pattern, its price could drop to $0.000018.
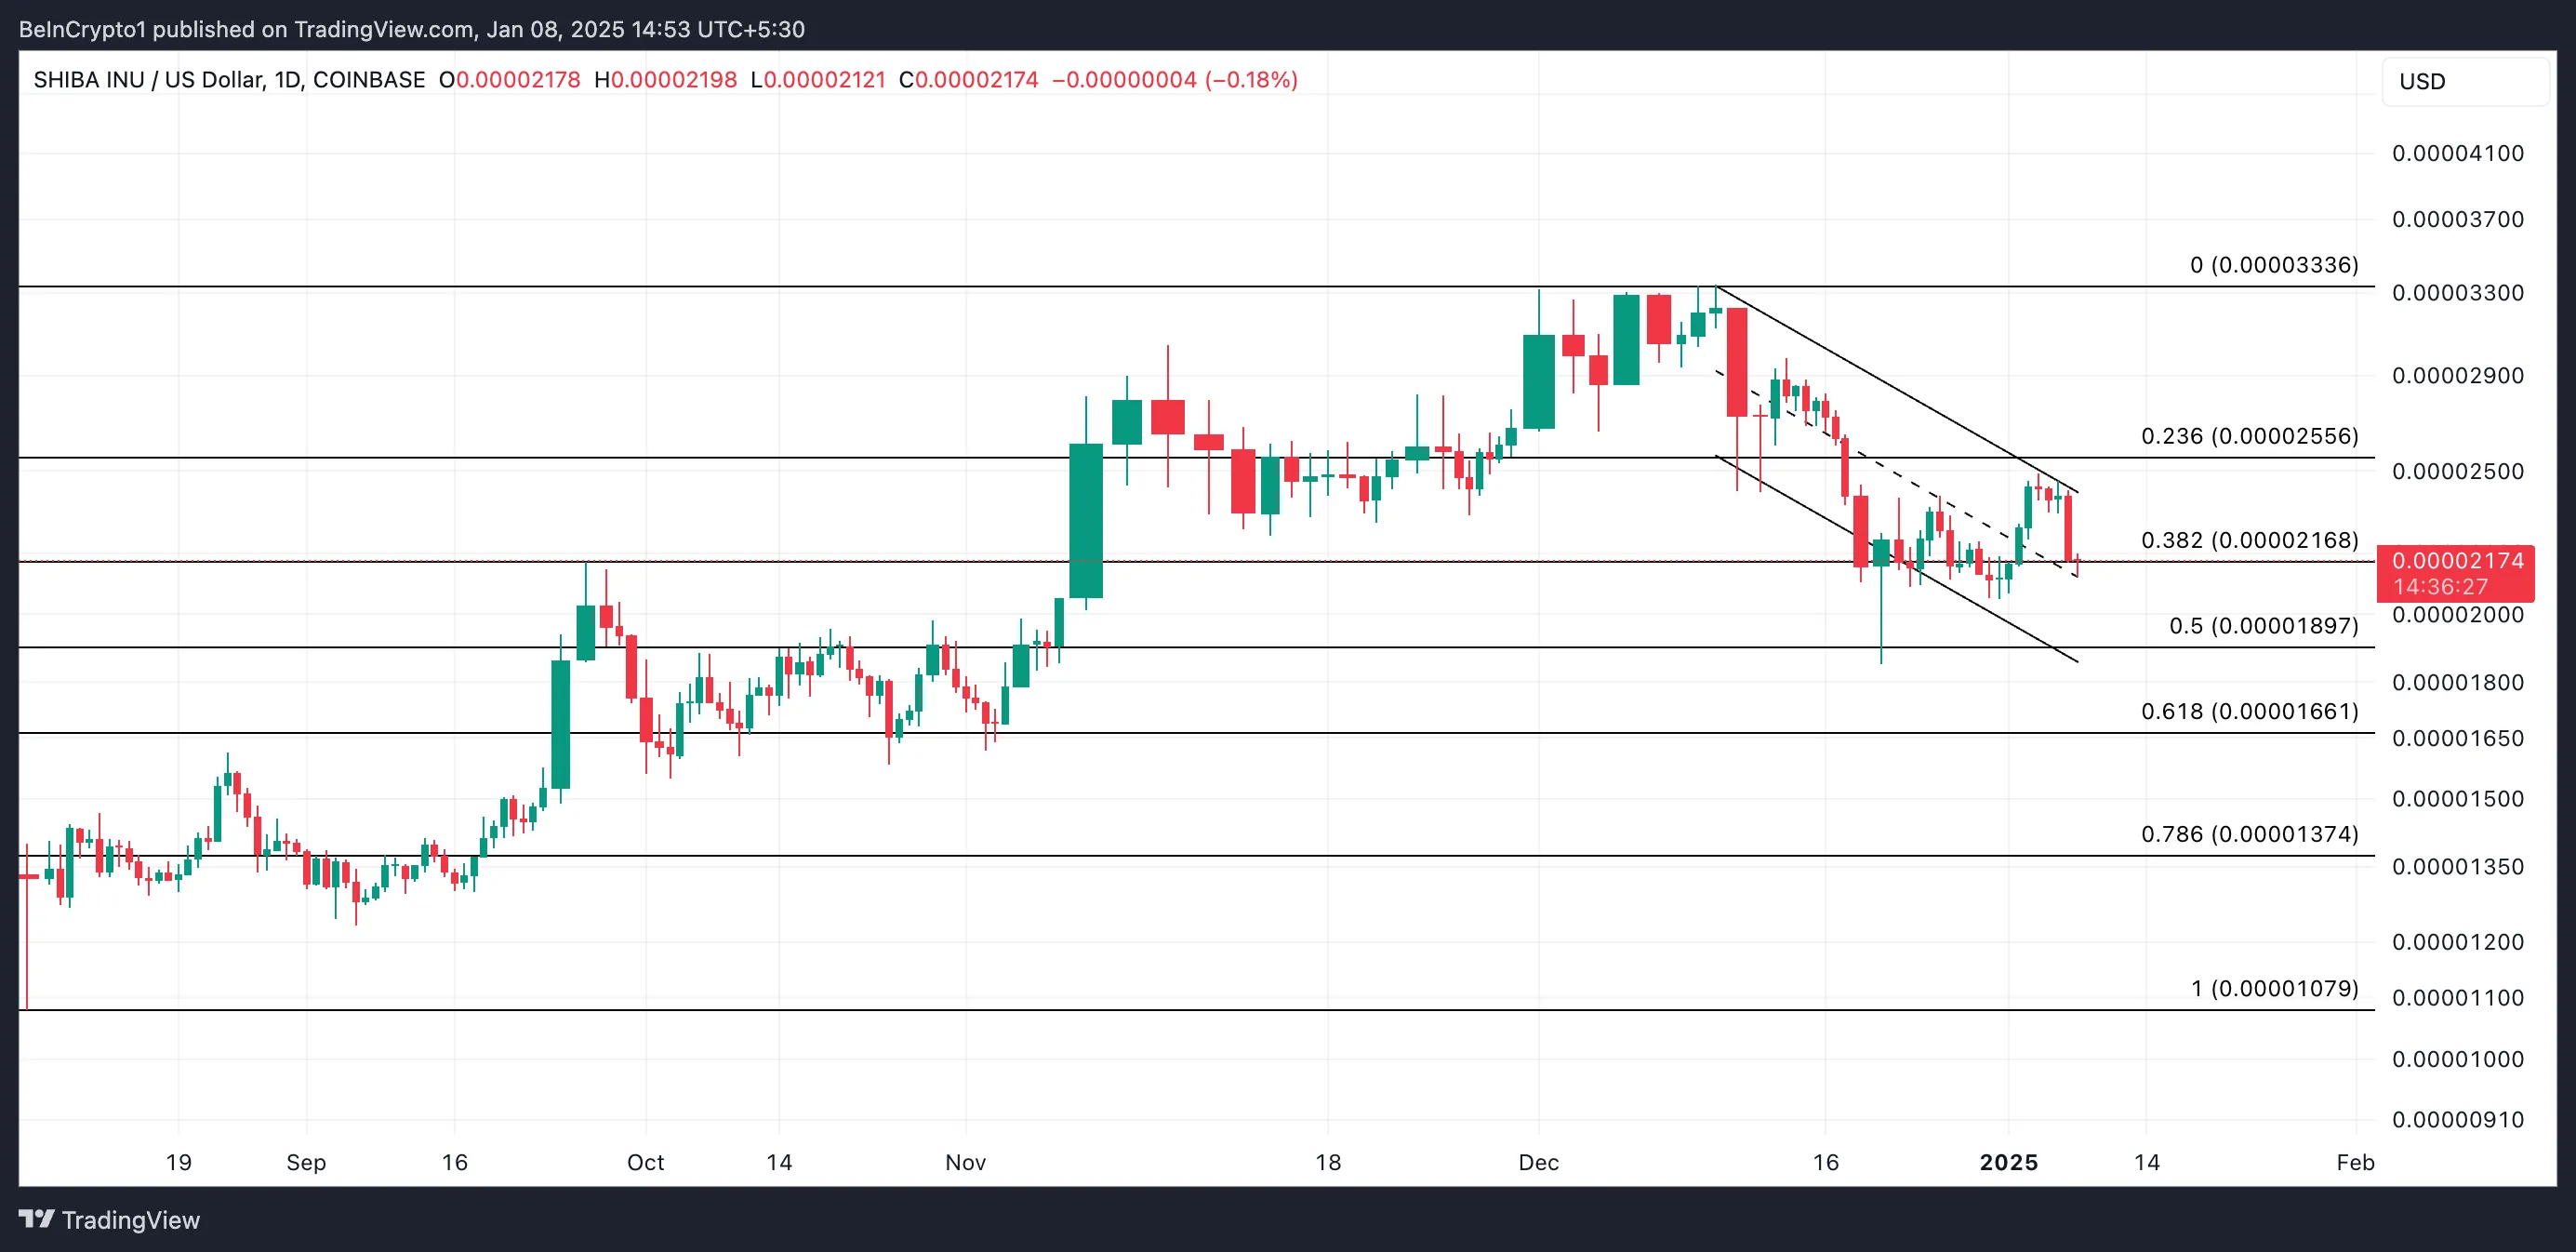
However, if selloffs reduce and traders start to accumulate the meme coin, this bearish outlook would be invalidated. In that case, SHIB’s price may rally to $0.000025 and toward $0.000033.
Disclaimer
In line with the Trust Project guidelines, this price analysis article is for informational purposes only and should not be considered financial or investment advice. BeInCrypto is committed to accurate, unbiased reporting, but market conditions are subject to change without notice. Always conduct your own research and consult with a professional before making any financial decisions. Please note that our Terms and Conditions, Privacy Policy, and Disclaimers have been updated.
Source link
Abiodun Oladokun
https://beincrypto.com/shiba-inu-biggest-single-day-selloff/
2025-01-08 13:00:00


