Ethereum recently found support at $2.1K following a significant cascade and experienced a slight bullish rebound.
However, the price is now retracing towards the wedge’s broken lower boundary, indicating a potential pullback completion. This move hints at a possible bearish continuation in the coming days.
By Shayan
The Daily Chart
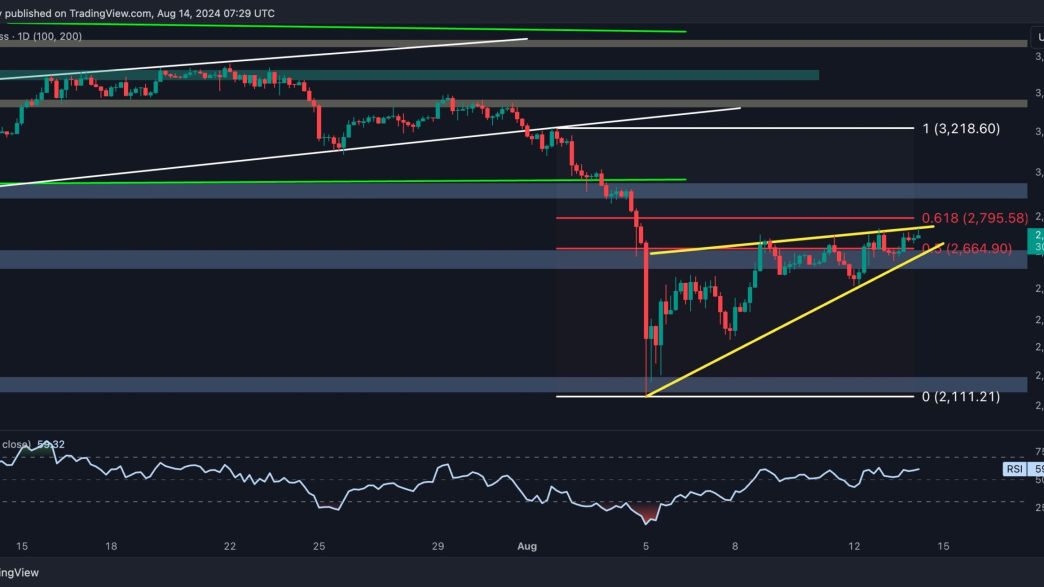
A closer look at ETH’s daily chart reveals that following a significant market turmoil, the cryptocurrency broke below the wedge’s lower boundary at $2.8K and experienced a notable cascade. Nevertheless, the price found support at the crucial $2.1K support zone, leading to a bullish reversal. Subsequently, buying pressure emerged, leading to a period of slight bullish retracements toward a notable resistance threshold.
This threshold marks the previously broken wedge’s lower boundary, where prevailing supply has the potential to halt upward momentum and reject the price in the upcoming days.
Yet, if Ethereum is unable to reclaim this crucial resistance, a pullback will be completed, leading to a potential bearish continuation aiming for significant support of $2.5K.
The 4-Hour Chart
On the 4-hour chart, ETH’s bullish revival is apparent. The price experienced a period of upward retracements, marking higher highs and higher lows.
However, the cryptocurrency is now facing a formidable resistance region between the $2.6K and $2.8K Fibonacci levels.
This range serves as the main target for the corrective stage of the market, having the potential to reject the price in the upcoming days. On the other hand, during the recent retracements, ETH has emerged inside a bearish continuation triangle pattern, further emphasizing the bearish continuation scenario.
Nevertheless, if the price faces rejection and breaks below the triangle’s lower boundary, the continuation of the bearish trend toward $2.1K will become imminent. Overall, the action in the upcoming days will be crucial in determining Ethereum’s next move, with current indicators favoring a bearish outlook.
By TradingRage
Following the recent drop, many investors have suffered significant losses, especially in the perpetual futures market. As a result, analyzing the updated state of the futures market could be beneficial for a better understanding of current market dynamics.
This chart presents the Ethereum Open Interest metric, which measures the number of open futures positions, both shorts and longs. Higher values are usually associated with more volatility, while lower OI mostly leads to better price stability.
As the chart suggests, Open Interest has dropped significantly following the recent price decline, indicating a massive number of liquidations. If sufficient demand is present in the spot market, this can result in a good outcome, as the market can experience a more sustainable uptrend
Binance Free $600 (CryptoPotato Exclusive): Use this link to register a new account and receive $600 exclusive welcome offer on Binance (full details).
LIMITED OFFER 2024 at BYDFi Exchange: Up to $2,888 welcome reward, use this link to register and open a 100 USDT-M position for free!
Disclaimer: Information found on CryptoPotato is those of writers quoted. It does not represent the opinions of CryptoPotato on whether to buy, sell, or hold any investments. You are advised to conduct your own research before making any investment decisions. Use provided information at your own risk. See Disclaimer for more information.
Cryptocurrency charts by TradingView.
Source link
CryptoVizArt
https://cryptopotato.com/ethereum-price-analysis-eth-facing-key-resistance-at-2-8k-bears-look-to-resurface/
2024-08-14 11:24:05


