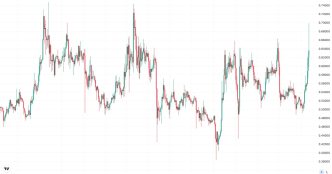
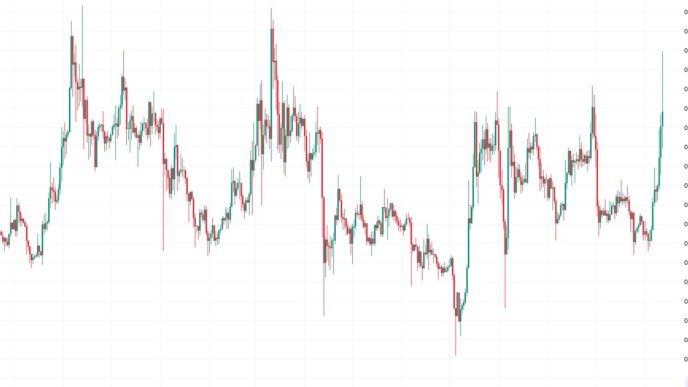
AIOZ, the native token of the AIOZ Network — a decentralized platform that leverages a global network of nodes to deliver content — has experienced a remarkable 45% price surge in the past 24 hours.
This rally positions AIOZ as the second-highest gainer of the day. It is surpassed only by Dogecoin (DOGE), whose value has risen by 52%. However, while significant buying activity remains underway, AIOZ may soon begin to shed its recent gains.
AIOZ Gains, But There Is a Catch
AIOZ’s double-digit rally has pushed its price to $0.73. At this press level, the altcoin trades above its Ichimoku Cloud, which tracks the momentum of its trends and identifies potential support/resistance levels.
When an asset’s price stays above the cloud, it signals a strong bullish trend, indicating that buyers dominate and market sentiment is positive.
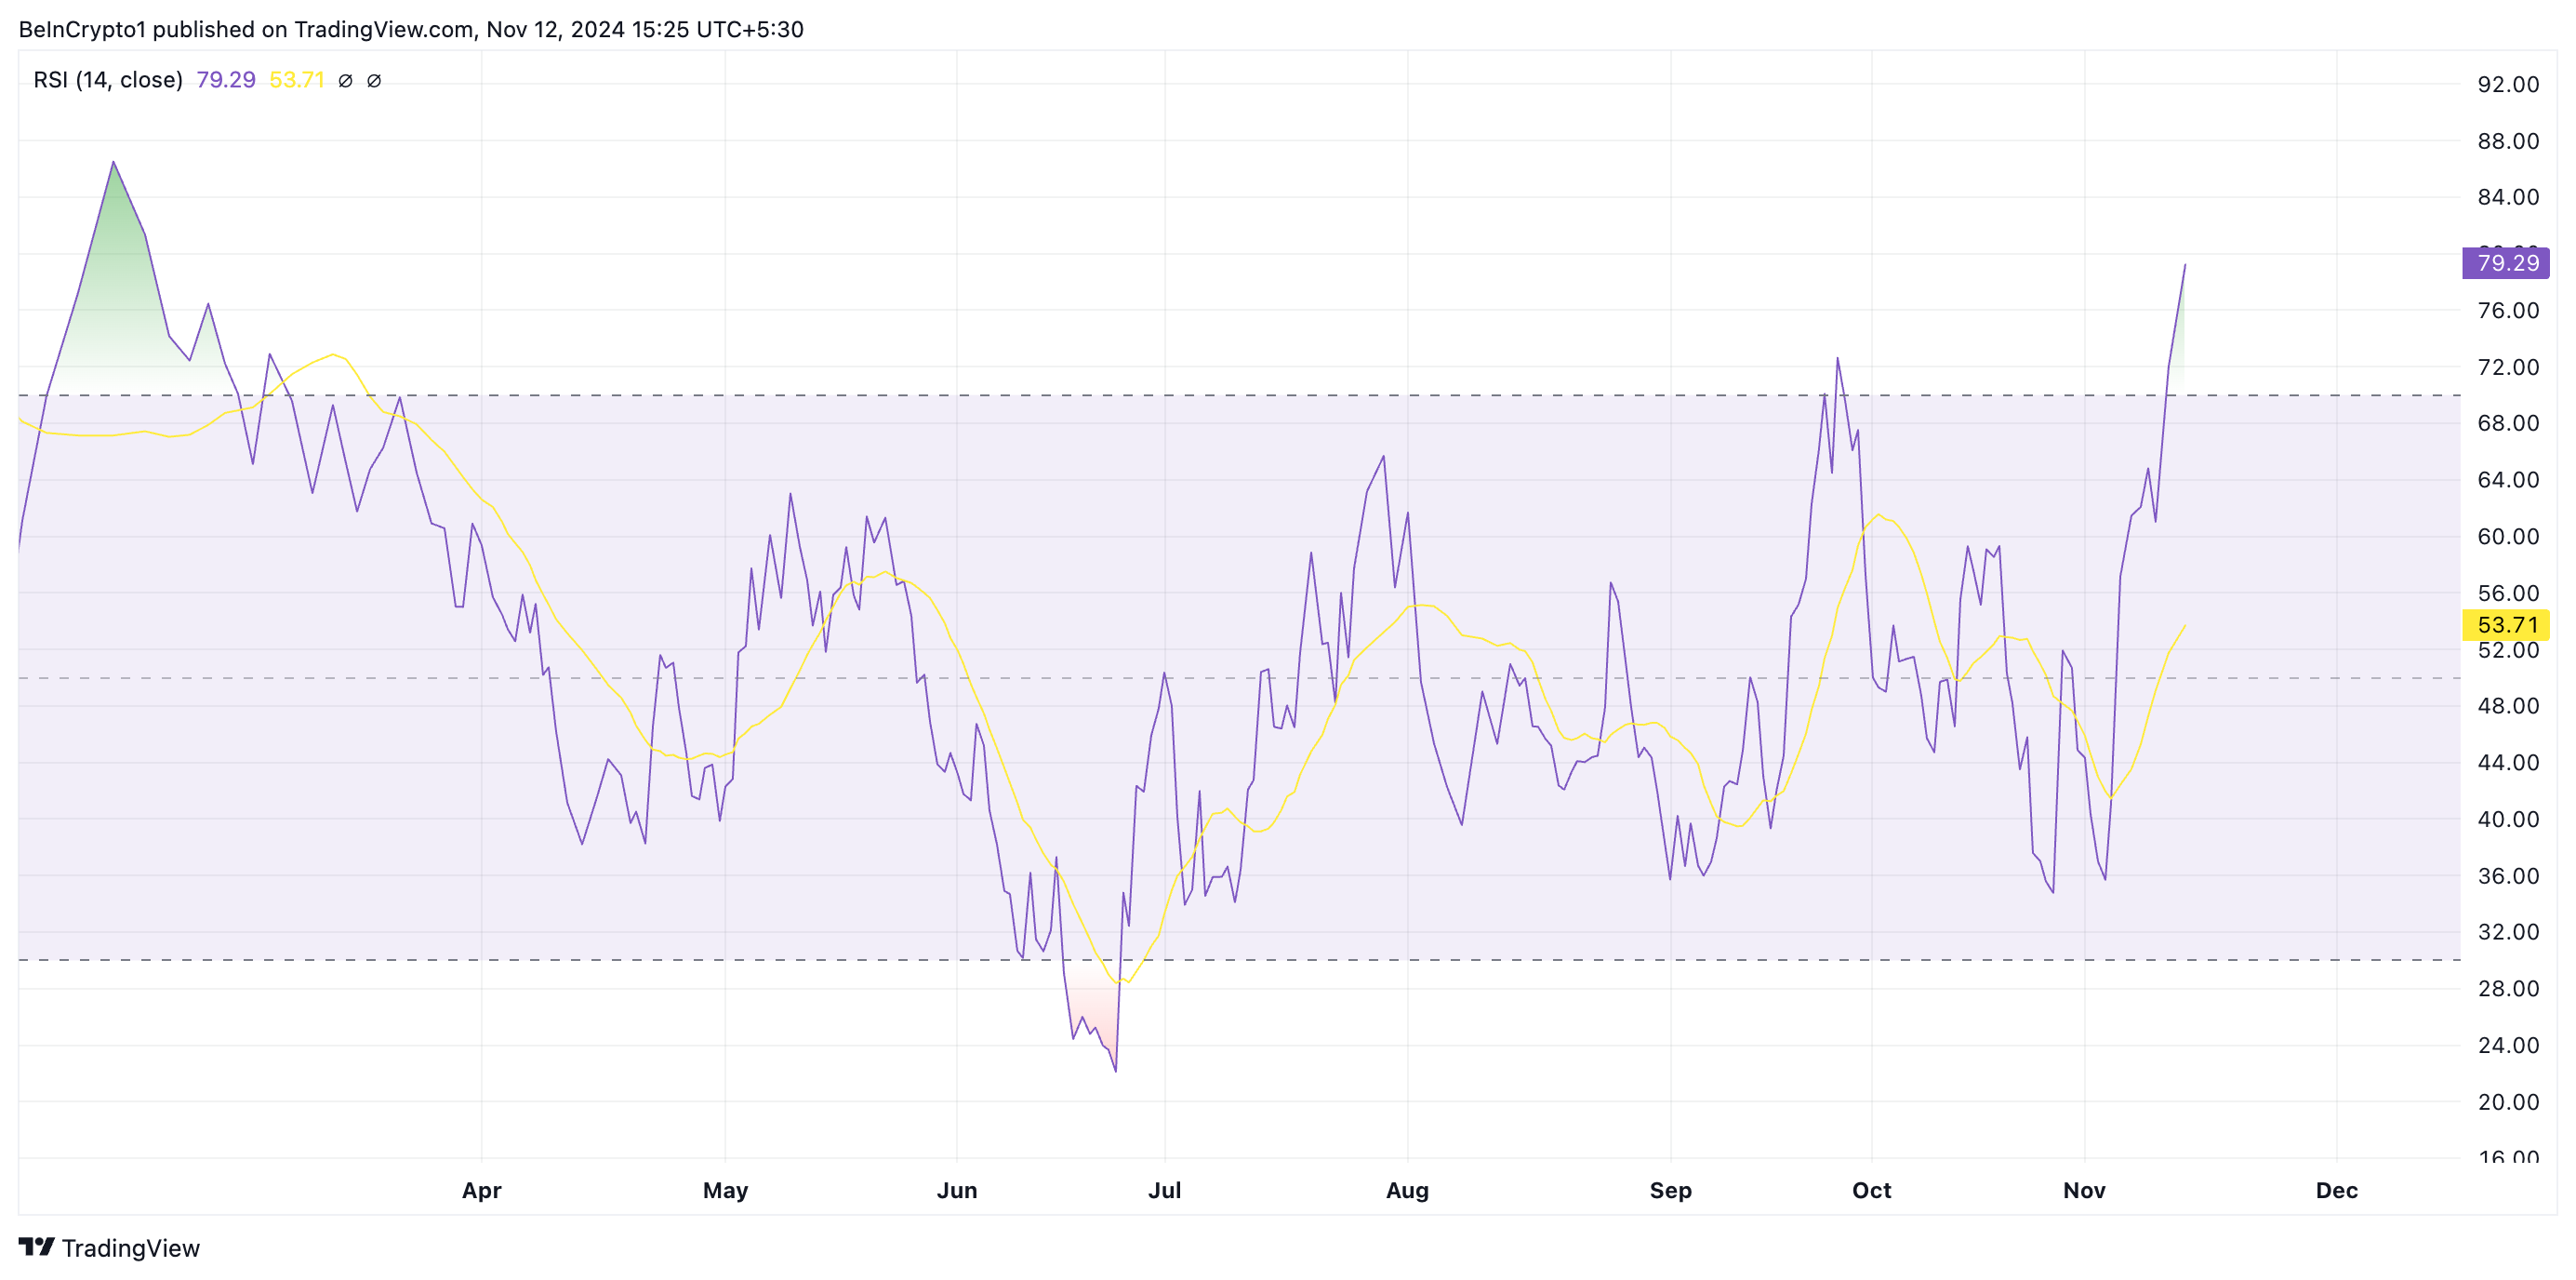
However, with overbought readings from AIOZ’s key momentum indicators, these buyers may soon begin to witness exhaustion. The altcoin’s Relative Strength Indicator is a notable indicator of this. As of this writing, AIOZ’s RSI is at 79.29 and remains in an uptrend.
The RSI indicator measures an asset’s overbought and oversold market conditions. The scale ranges from 0 to 100; values above 70 suggest the asset is overbought and may face a correction, while values below 30 indicate it’s oversold and could be set for a rebound.
The RSI reading of 79.86 signals that traders have pushed AIOZ prices too high, suggesting that a correction or pullback may occur as buying pressure weakens.
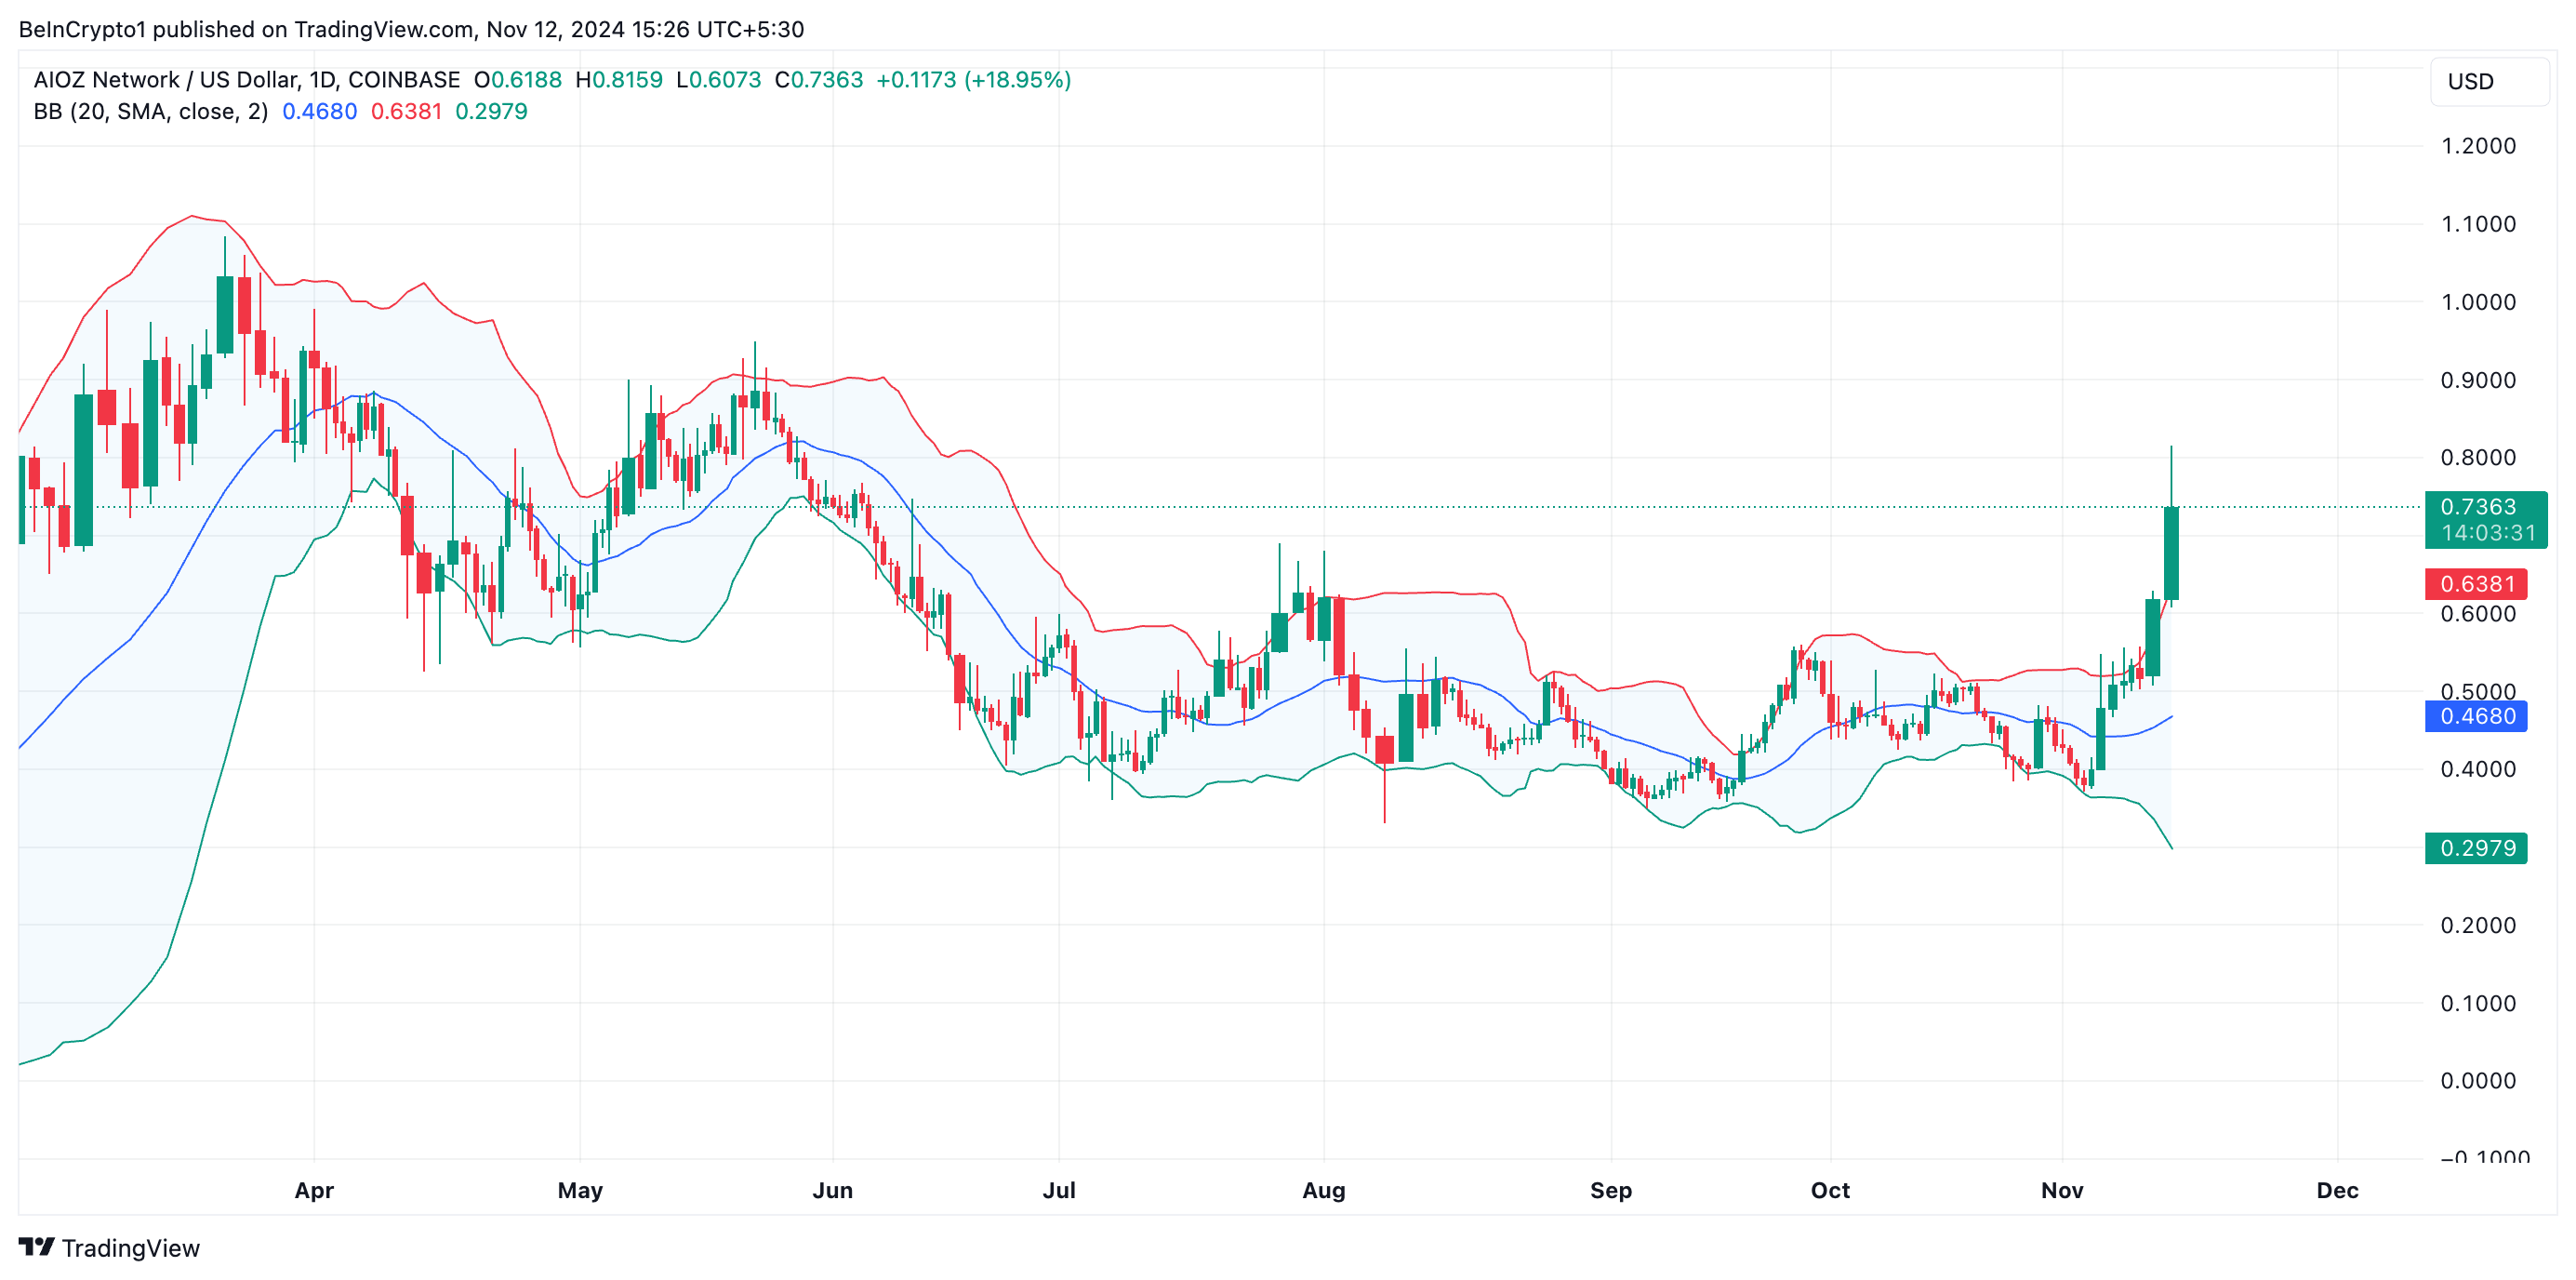
Furthermore, AIOZ trades above the upper band of its Bollinger Bands indicator, confirming its overbought state. This indicator gauges an asset’s market volatility and highlights potential buy and sell signals. It consists of three main components: the middle band, the upper band, and the lower band.
When an asset’s price moves above the upper band, the asset is overbought and possibly overextended. Traders often view this as a signal to anticipate potential downward pressure, prompting them to sell and secure their gains.
AIOZ Price Prediction: Decline Is Imminent
Once buyer exhaustion sets in, AIOZ’s price will likely begin to shed its recent gains. According to the Fibonacci Retracement tool, its price is expected to decline toward the $0.61 resistance level, which it recently broke above. If this level fails to hold as support, AIOZ’s price could drop further to $0.49.
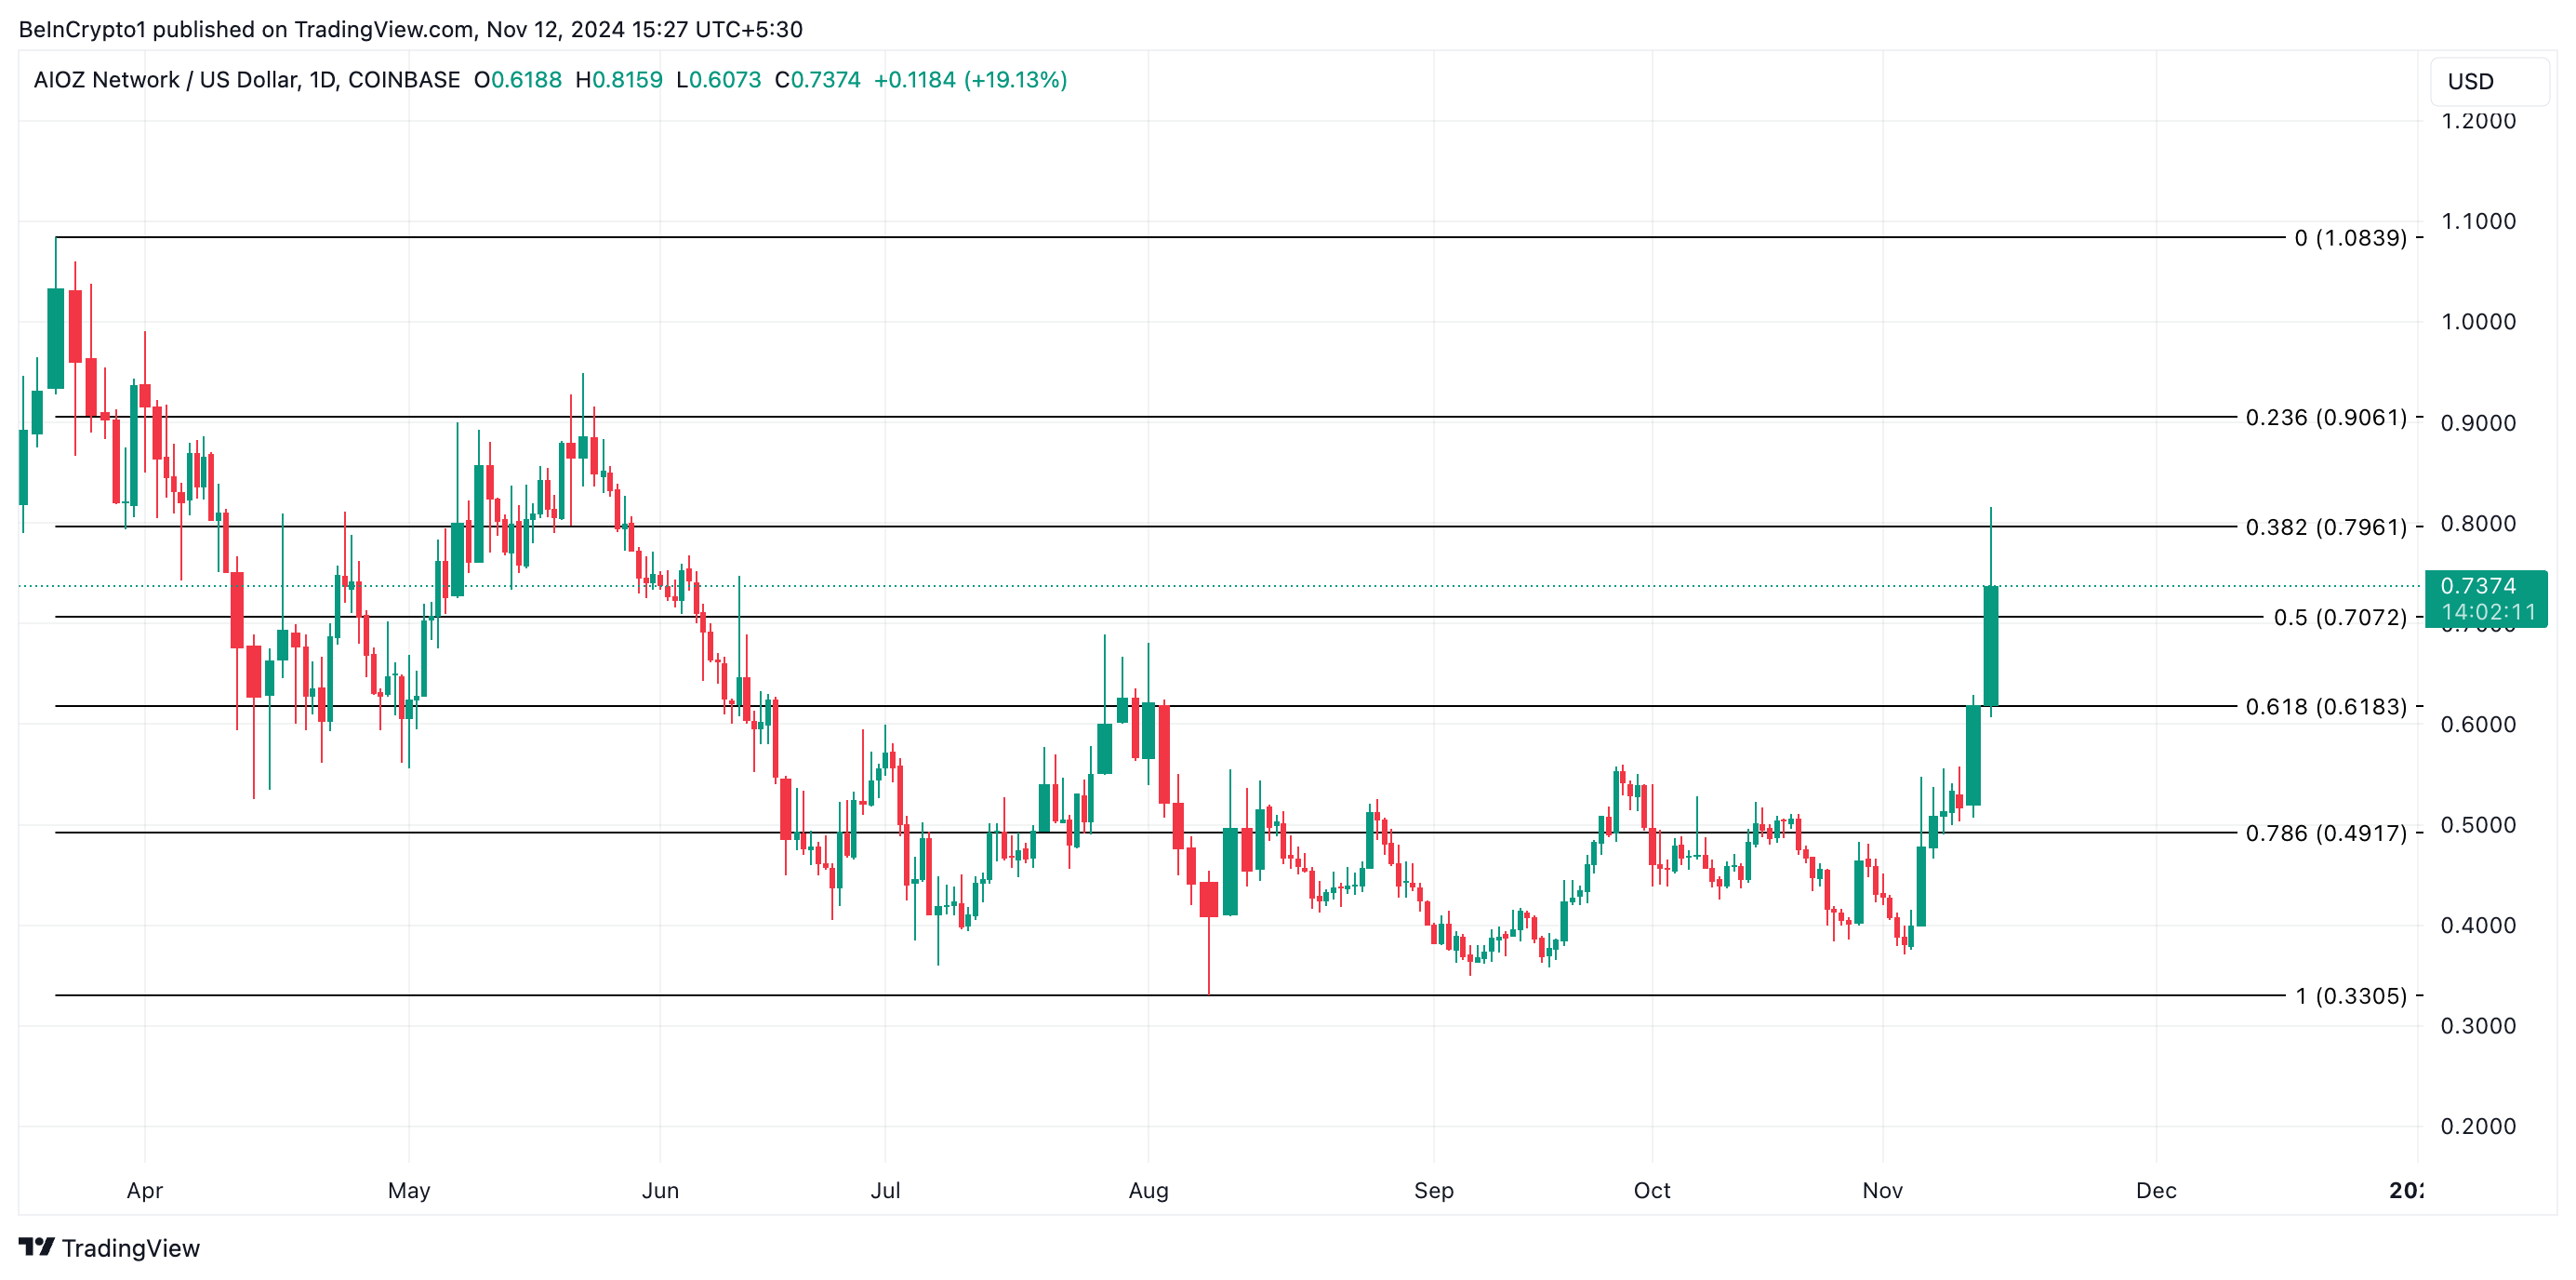
However, if buying pressure intensifies and demand remains strong, buyers could sustain the uptrend, potentially driving AIOZ’s price toward its year-to-date high of $1.08.
Disclaimer
In line with the Trust Project guidelines, this price analysis article is for informational purposes only and should not be considered financial or investment advice. BeInCrypto is committed to accurate, unbiased reporting, but market conditions are subject to change without notice. Always conduct your own research and consult with a professional before making any financial decisions. Please note that our Terms and Conditions, Privacy Policy, and Disclaimers have been updated.
Source link
Abiodun Oladokun
https://beincrypto.com/aioz-price-correction-ahead/
2024-11-12 13:00:00

