Bitcoin (BTC) price has gained 6% over the last 30 days. However, the current trend strength, as indicated by the ADX, shows signs of weakening. Additionally, recent netflows of BTC into exchanges suggest a shift towards caution among holders.
BTC must break above the $68,506 resistance to push for a new all-time high, but failure to hold key supports could lead to a pullback.
BTC Current Trend Is Not Strong As It Was Days Ago
The ADX for Bitcoin (BTC) is currently at 33.55, indicating moderate trend strength. The Average Directional Index (ADX) measures the strength of a price trend, regardless of whether it’s moving up or down.
A value above 20 suggests a trend is gaining traction, while readings over 50 indicate a very strong trend. BTC’s ADX being at 33.55 means the trend is still present but not overwhelmingly strong.
Read more: Bitcoin (BTC) Price Prediction 2024/2025/2030
BTC is currently in an uptrend, though the current trend is much weaker than when the ADX recently climbed above 50. This reduction in trend strength signals that the momentum driving BTC higher has lost some steam.
A weakening trend means less confidence in a continued upward movement, increasing the chances that BTC could consolidate or experience a pullback rather than continuing sharply higher.
BTC Netflow Shows An Interesting Scenario
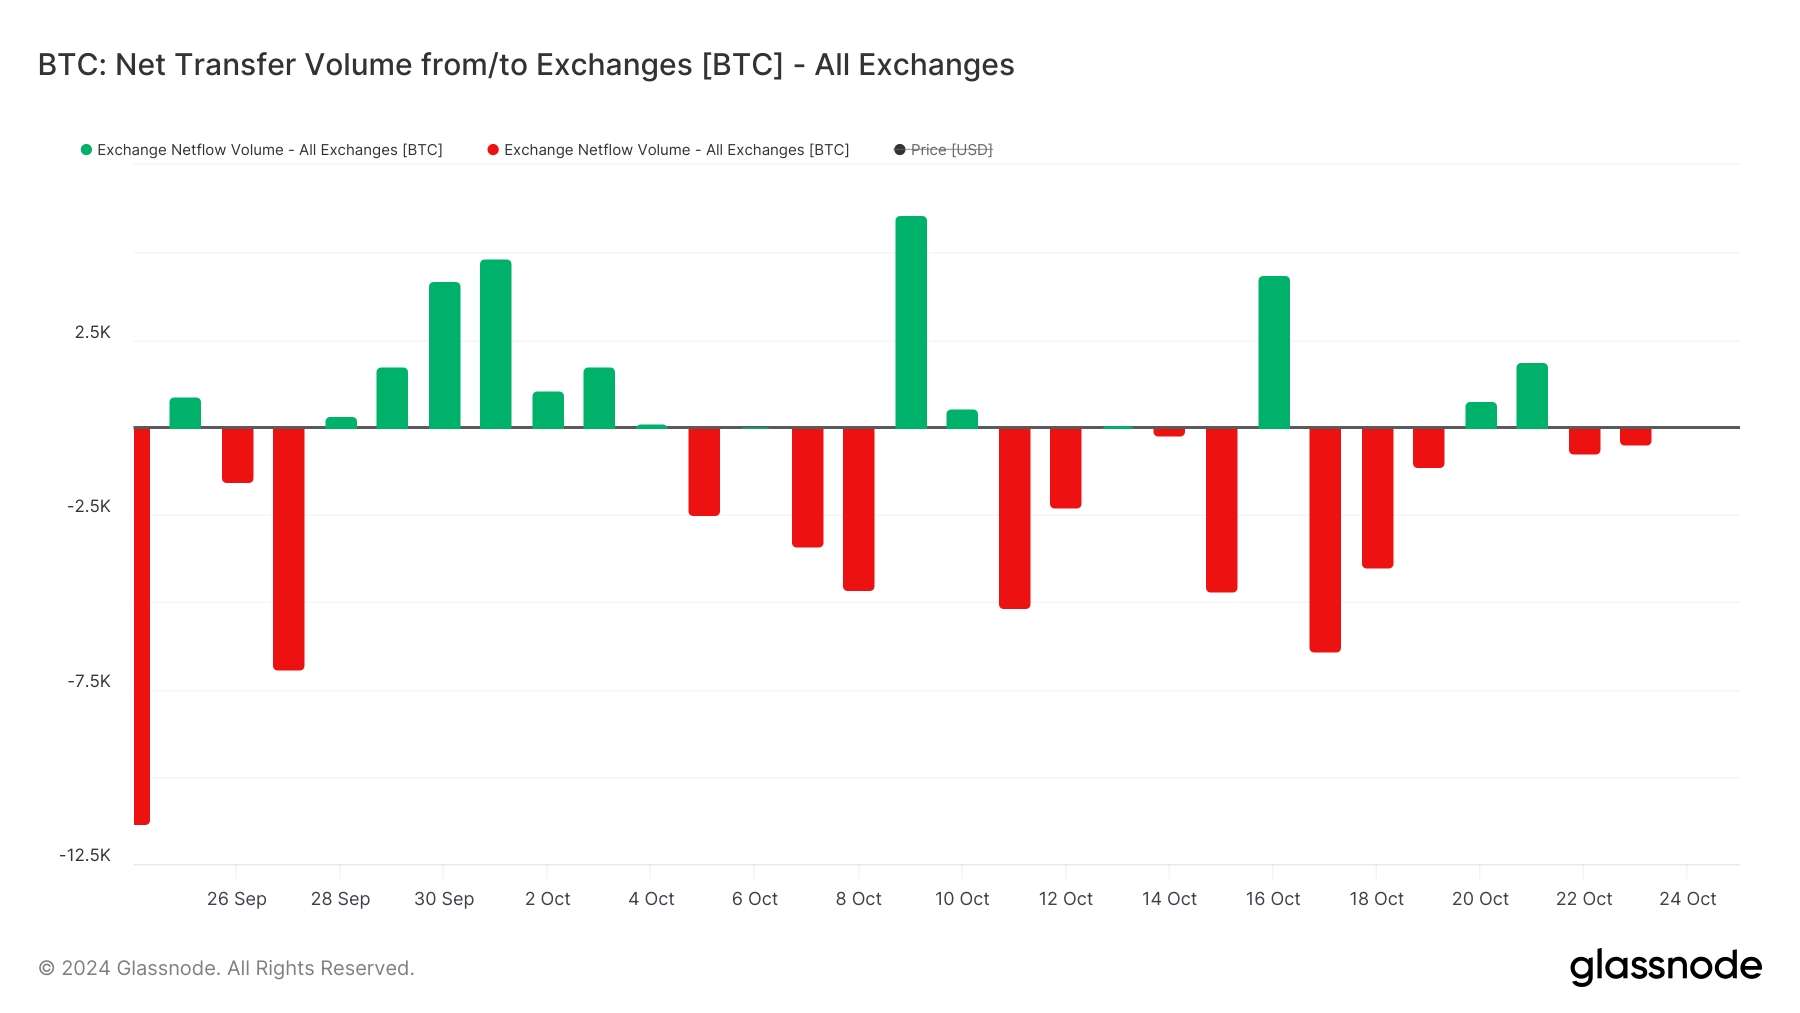
Between October 17 and October 19, BTC’s net transfer volume to exchanges was around 12,000 BTC, indicating significant net inflows. Typically, when users move assets off exchanges, it is considered a bullish signal, as it suggests they are not planning to sell.
Conversely, rising net inflows to exchanges can imply that holders are preparing to sell their BTC, which may lead to increased selling pressure.

After three days of negative netflows — meaning more BTC left exchanges than entered — the trend turned positive briefly and has fluctuated in the last two days. While recent netflows have turned negative again, the volume is much lower compared to the surge seen between October 17 and October 19.
This change suggests that holders may not be as confident as before, and sentiment could be shifting towards more caution, limiting the chance of strong bullish momentum in the short term.
BTC Price Prediction: Is It Headed To A New All-Time High Soon?
The BTC price chart reveals that the short-term EMA lines are still above the long-term ones, which is a bullish signal. However, the gap between these EMAs has narrowed compared to a few days ago, indicating that bullish momentum is weakening.
This could suggest that the uptrend may be losing steam and the market is at a more cautious phase.
Read more: What Is a Bitcoin ETF?

If BTC can break the resistance level at $68,506, it has the potential to rise further and reach $70,036, marking a new all-time high.
On the downside, if the current trend reverses, BTC price could retest the support level at $62,648. Should this level fail to hold, BTC might drop further, with the next major support around $57,830.
Disclaimer
In line with the Trust Project guidelines, this price analysis article is for informational purposes only and should not be considered financial or investment advice. BeInCrypto is committed to accurate, unbiased reporting, but market conditions are subject to change without notice. Always conduct your own research and consult with a professional before making any financial decisions. Please note that our Terms and Conditions, Privacy Policy, and Disclaimers have been updated.
Source link
Tiago Amaral
https://beincrypto.com/bitcoin-btc-price-new-ath/
2024-10-25 00:30:00


