

Recent trading activities reveal that Ethereum is approaching a crucial point in its trading as it forms a bearish triangle pattern, signaling a potential significant breakout. If the cryptocurrency breaks below the lower boundary of this triangle, it could lead to a sharp decline towards the $2,160 target.
This article aims to provide readers with a detailed technical analysis of Ethereum’s price action, emphasizing the importance of the bearish triangle pattern that has emerged on the charts. It will also explore how this pattern indicates a potential downward move toward the $2,160 support level.
In the past 24 hours, Ethereum has gone up by 2.11%, reaching around $2,642, with a market capitalization of over $317 billion and a trading volume exceeding $21 billion at the time of writing. ETH’s market cap has increased by 2.32%, while its trading volume has surged by 33.62%
Analyzing Current Price Actions Within The Bearish Triangle
On the 4-hour chart, ETH’s price is currently trading below the 100-day Simple Moving Average (SMA) and is moving closer to the lower boundary of a bearish triangle, with several bearish candlesticks forming. This indicates a prevailing bearish sentiment in the market and suggests the potential for further price declines.
Additionally, an examination of the 4-hour Composite Trend Oscillator reveals that both the signal line and the SMA line are currently in the overbought zone, with the signal line attempting to cross below the SMA line. This suggests that bearish pressure is building up for the cryptocurrency, potentially resulting in more price declines.
On the 1-day chart, Ethereum remains below the 100-day SMA and, with a single bearish candlestick, is approaching the lower boundary of the bearish triangle. Given the current price action on the daily timeframe, it appears that bearish momentum is increasing, which could potentially lead to a price breakout.
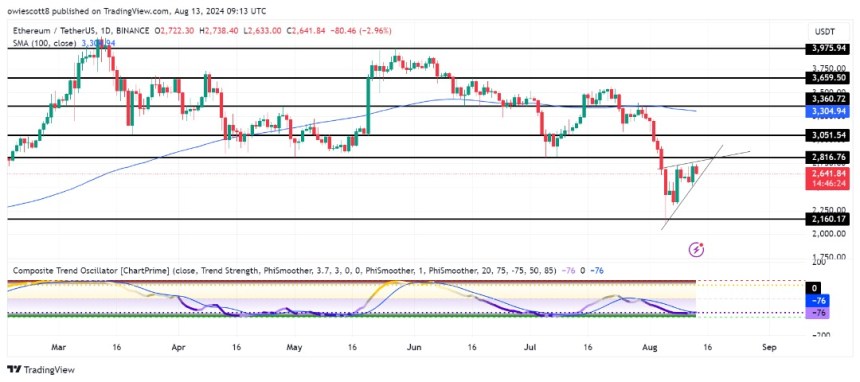
Finally, the composite trend oscillator on the 1-day chart also suggests a potential for continued bearish movement, with both the signal line and the SMA line in the oversold zone, showing no signs of crossing above.
Potential Scenarios For Ethereum Following A Breakout
If Ethereum’s current trading activities lead to a breakout below the bearish triangle, the price may continue to descend toward the $2,160 support level. When the crypto asset reaches this level and breaks below, it could lead to a further bearish move toward other lower levels.
However, if Ethereum fails to break below, it might start moving toward the upper boundary of the bearish triangle. Should the cryptocurrency break above this upper boundary, ETH could continue to rise to test the $2,816 resistance range and possibly advance to challenge higher levels if the price surpasses this resistance.
Featured image from iStock, chart from Tradingview.com
Source link
Godspower Owie
https://www.newsbtc.com/news/ethereum/ethereum-nears-key-bearish-triangle-apex-breakdown-to-2160-target-looms/
2024-08-13 12:30:22