

Chainlink (LINK) price is facing challenges as technical indicators show bearish momentum. LINK’s EMA lines recently formed a death cross, indicating continued bearish pressure.
Whale activity and the MVRV ratio provide mixed signals about LINK’s future.
Whale Activity Signals LINK Recovery
Users holding between 100,000 and 1,000,000 LINK tokens seem to be recovering after the recent correction. Tracking these whales is crucial because they often significantly influence market direction. Whales have the power to sway prices due to the large volumes they control, making their behavior a key indicator of market sentiment.
When whales accumulate or hold large amounts of a token, it can signal strong confidence in the asset, while a reduction in whale holdings can indicate bearish sentiment or uncertainty. Their numbers grew from 489 on October 1 to 502 on October 8, showing a notable recovery in whale activity.
This increase suggests that whales are once again accumulating LINK, which could point to an expectation of future gains.
Read more: Chainlink (LINK) Price Prediction 2024/2025/2030
The recent surge in whale holdings, though modest, could be a positive sign for LINK’s price, suggesting renewed confidence among large holders and the potential for upward pressure. A rise in whale activity often indicates accumulation, which may precede a price rally as buying pressure mounts.
Large holders returning to the market can create a more solid foundation for LINK price to regain lost ground, especially if broader market conditions begin to stabilize or turn bullish. Moreover, whale activity is often a precursor to significant market moves.
As more whales return, it can create a ripple effect, driving renewed interest among retail investors and smaller traders, ultimately contributing to a sustained price rally.
MVRV Ratio Suggests Potential for LINK Rebound
The LINK 7-day MVRV ratio is currently at -4.41%, down from 8.12% on September 27. This decline is important because the MVRV ratio helps gauge market sentiment and potential price movements. A declining MVRV ratio indicates that more holders are now at a loss, which can shift investor behavior.
The 7-day MVRV ratio measures the average profit or loss of LINK tokens that have been held for the last seven days, providing insights into short-term investor behavior. When the ratio turns negative, it often signals that the asset is oversold, which could lead to reduced selling pressure and increased buying interest from investors looking for a bargain.
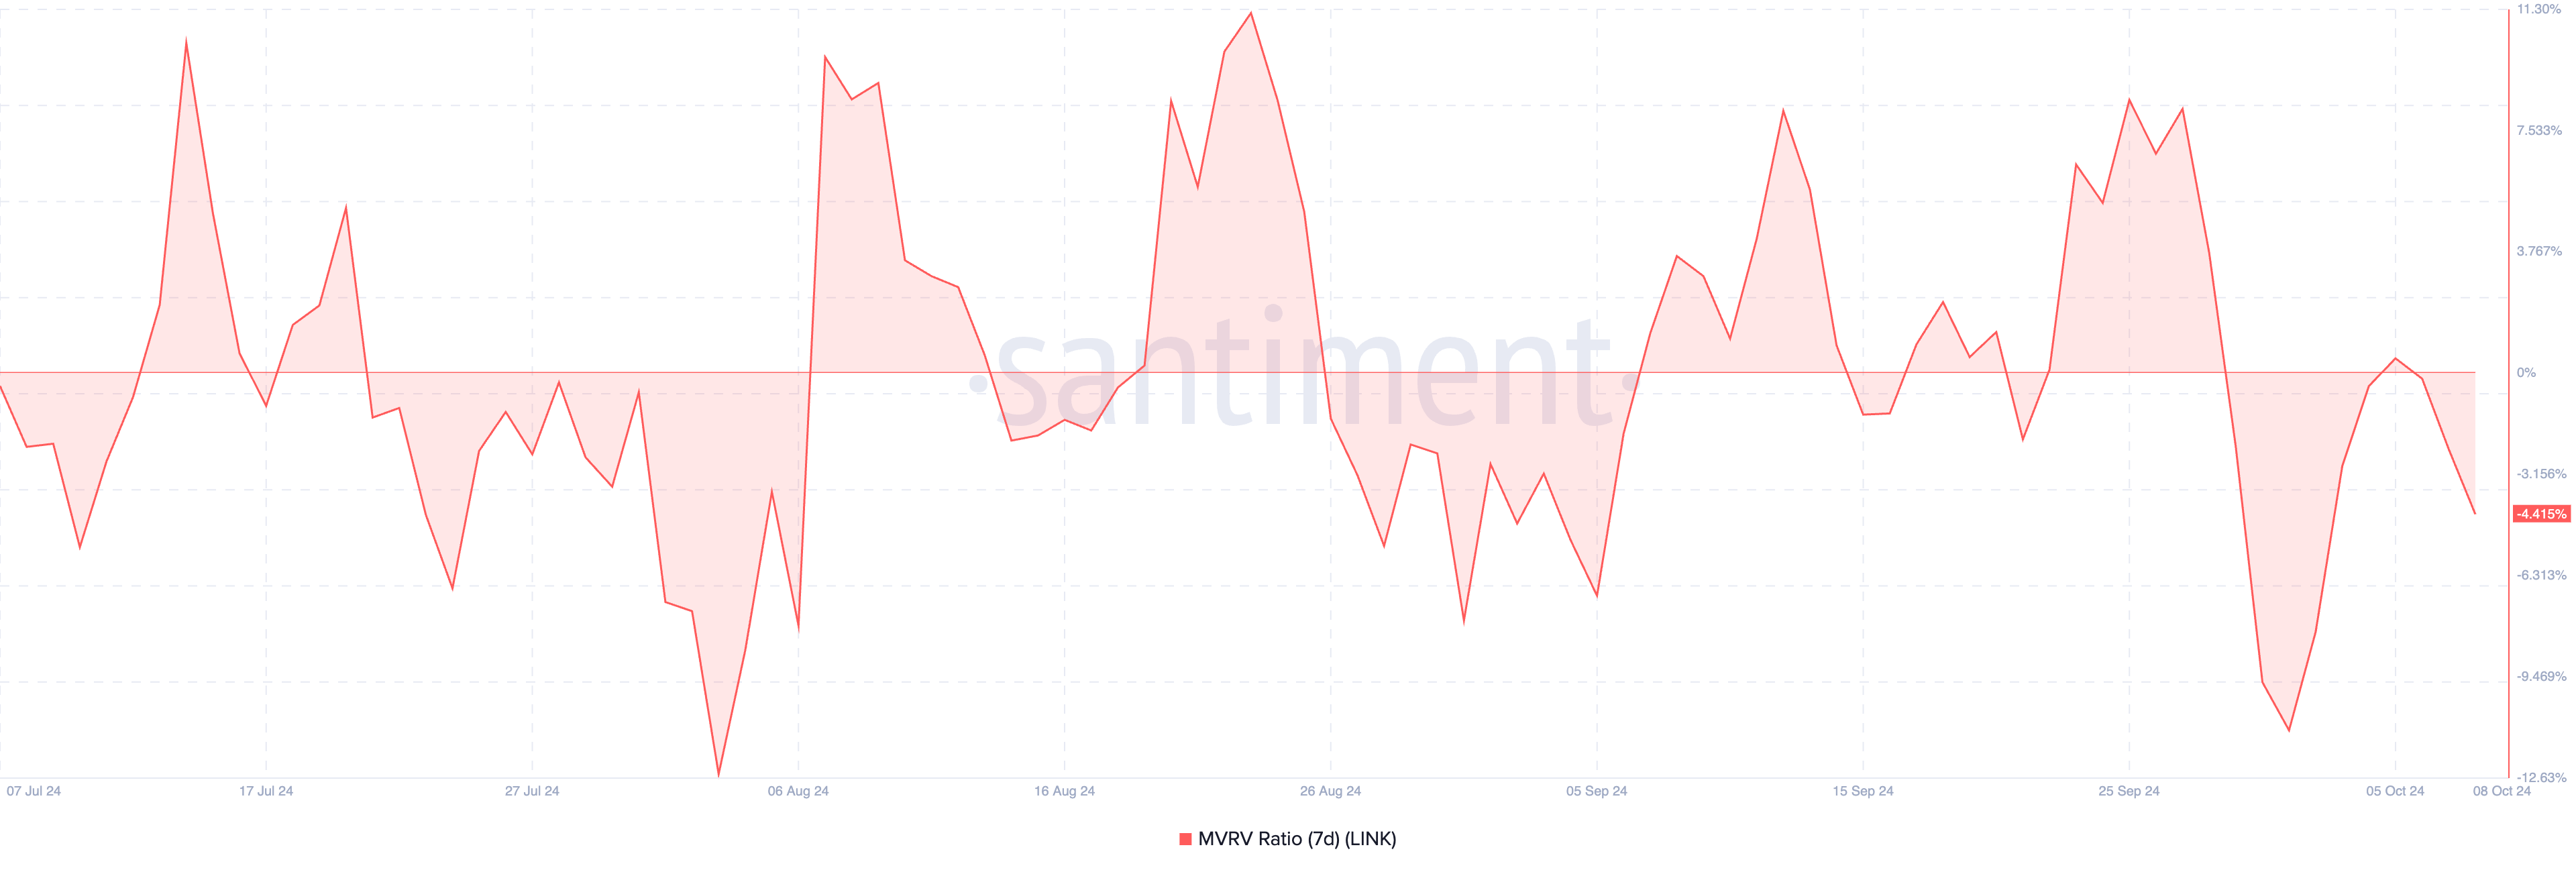
A value of -4.41% means that, on average, recent LINK holders are at a loss, indicating a period of market stress. Historically, when the 7-day MVRV ratio drops below -6%, LINK has shown a tendency to rebound. This suggests that as losses deepen, selling pressure decreases, and the likelihood of a price recovery increases.
When the ratio reaches deeply negative levels, it often attracts opportunistic buyers who see the potential for upside, leading to increased accumulation and a subsequent rebound in LINK price. If the current trend continues and the ratio falls further, it could set the stage for a potential LINK price rebound.
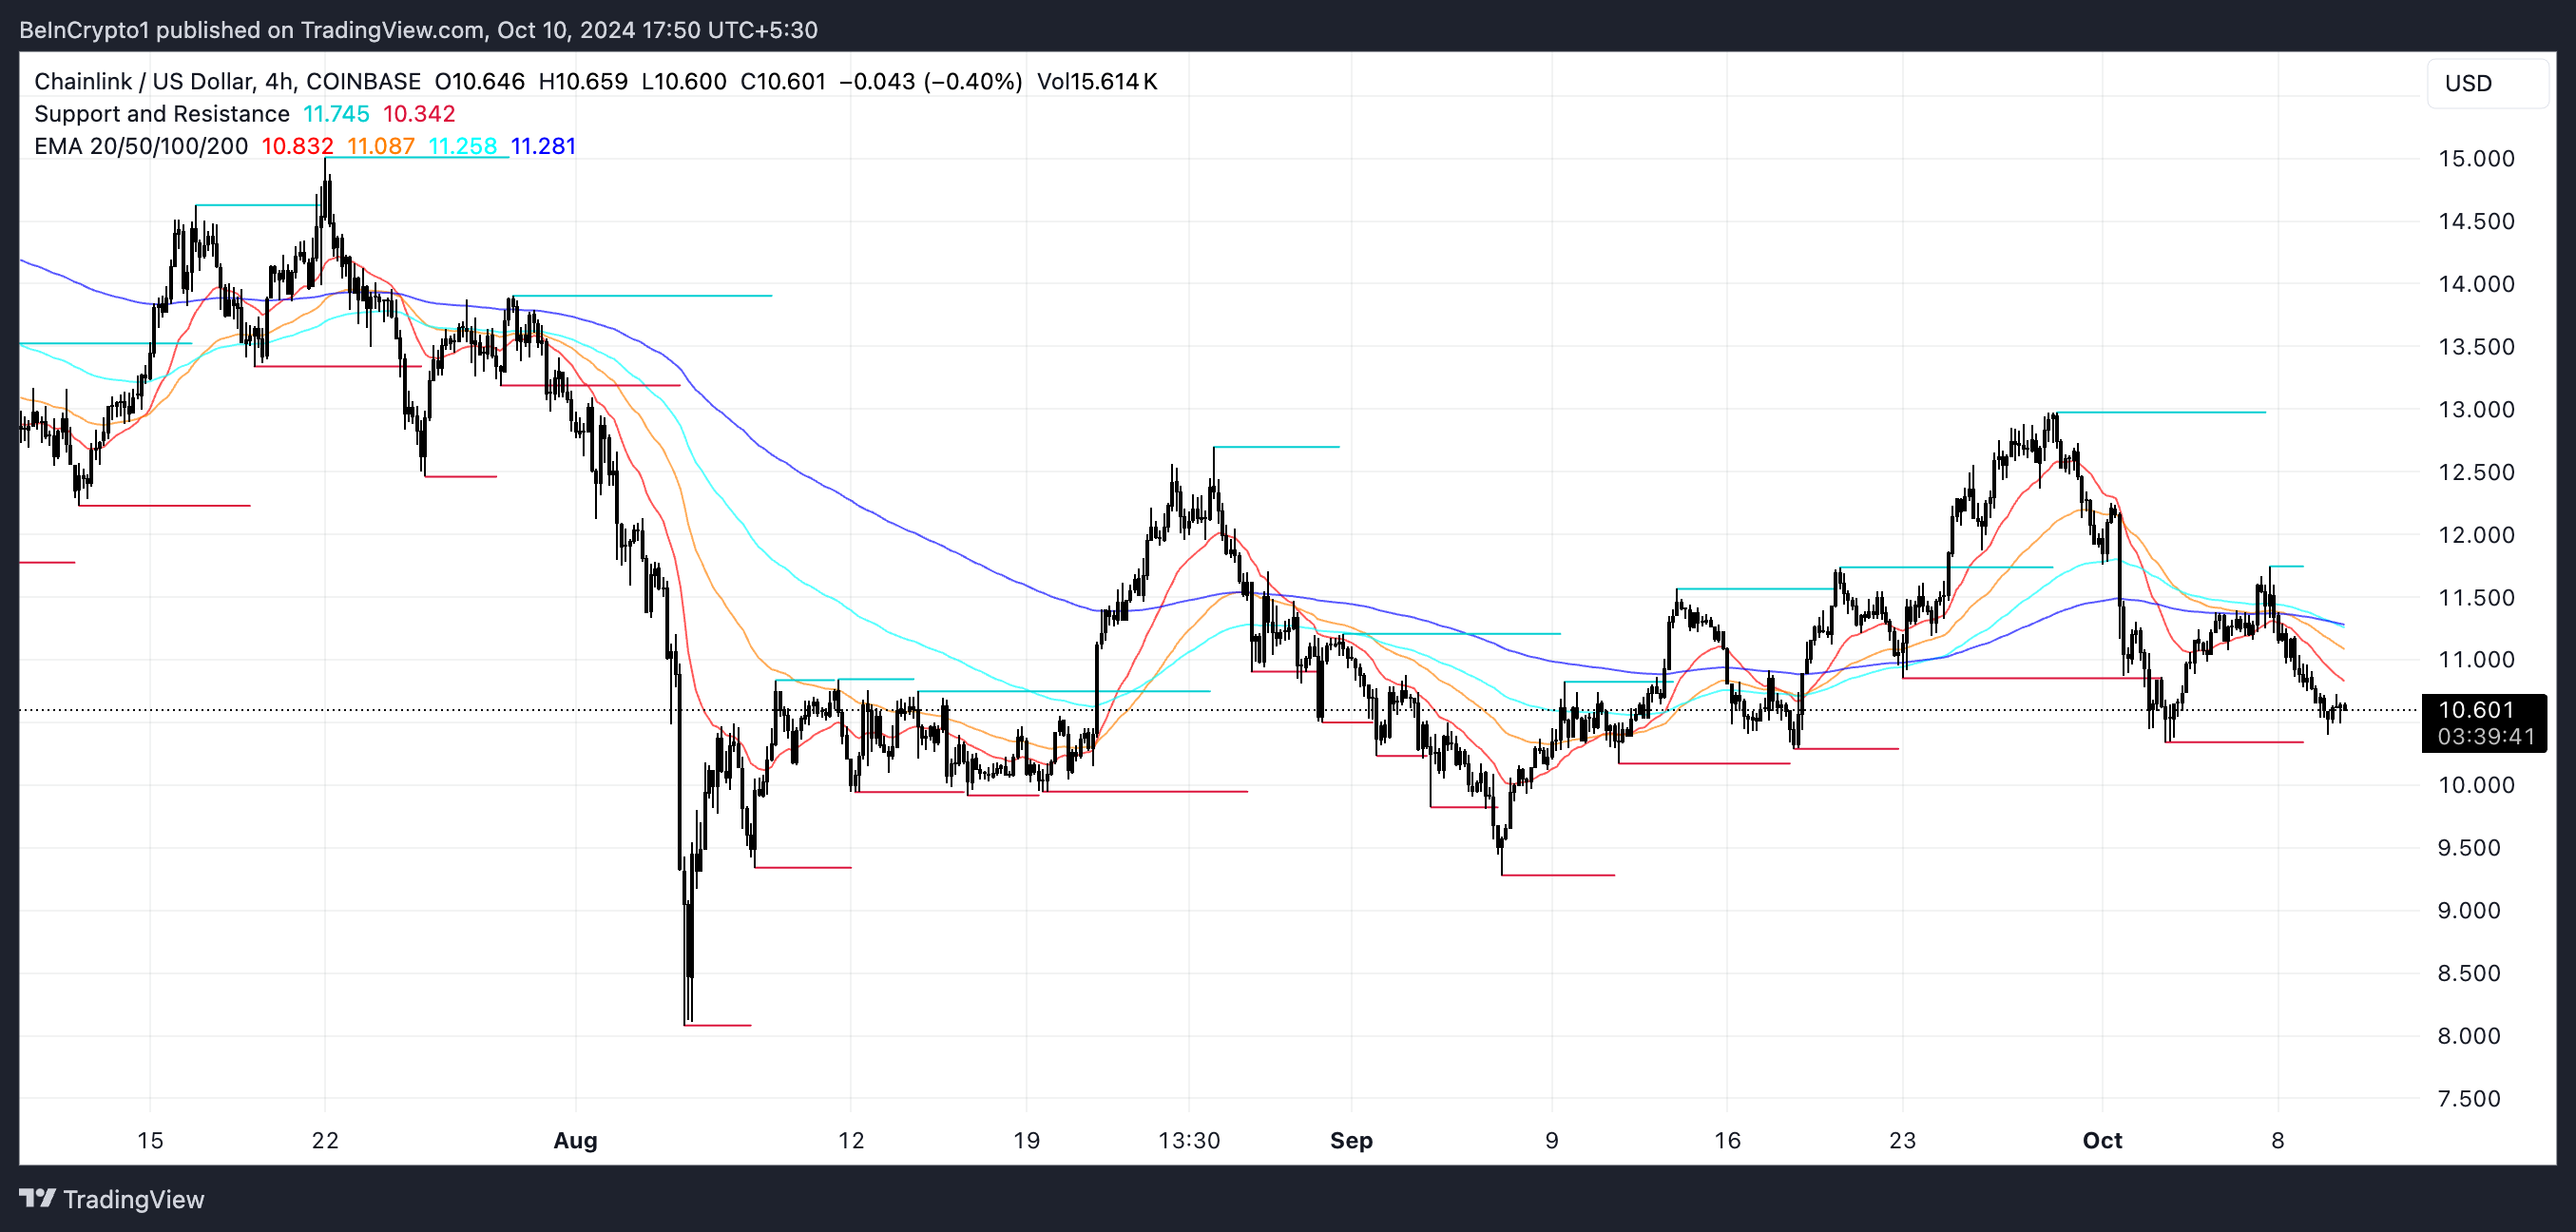
LINK Price Prediction: Bearish EMA Lines Indicate Potential LINK Price Challenges
LINK’s EMA lines are currently in a bearish state. On October 1, they formed a death cross, a bearish technical signal that occurs when a short-term EMA crosses below a long-term EMA. On October 7, LINK attempted to recover, but the short-term lines were unable to cross above the long-term EMA, and the bearish pattern continued.
EMA lines, or Exponential Moving Averages, are a type of moving average that gives more weight to recent prices, making them responsive to recent market conditions.
Read more: How to Buy Chainlink (LINK) With a Credit Card: A Step-By-Step Guide
Based on other metrics, such as whale activity and the MVRV ratio, in addition to the EMA lines, LINK’s correction could continue in the next few days. However, whale accumulation and historical behavior indicate that LINK might be getting ready for a rebound once the selling pressure eases.
If the downtrend continues, LINK price will likely test support levels around $9.9 and $9.3. If these supports fail, the price could fall as low as $8, which would represent a potential 23.8% decline. On the other hand, if the trend reverses, as it almost did recently, LINK’s price could rise back to $11.7. Should that resistance break, the next target would be around $13, representing a potential 23% gain.
Disclaimer
In line with the Trust Project guidelines, this price analysis article is for informational purposes only and should not be considered financial or investment advice. BeInCrypto is committed to accurate, unbiased reporting, but market conditions are subject to change without notice. Always conduct your own research and consult with a professional before making any financial decisions. Please note that our Terms and Conditions, Privacy Policy, and Disclaimers have been updated.
Source link
Tiago Amaral
https://beincrypto.com/chainlink-whale-accumulation-price-recovery/
2024-10-10 20:00:00