
BRETT price has been experiencing significant momentum, with the current uptrend showing strength across multiple technical indicators. The trend appears to be intensifying, supported by a strong surge in price over the last few days.
However, there are signs that the asset could be overbought, which may lead to a correction. Traders should keep an eye on both the uptrend signals and any signs of a potential pullback in the near future.
BRETT Current Uptrend Is Strong
BRETT’s ADX (Average Directional Index) currently sits at 46.87, a significant increase from just 20 two days ago. This sharp rise in the ADX indicates that the strength of the current trend is intensifying quickly.
During the same two-day period, BRETT’s price surged from $0.086 to $0.1124, marking a 30% increase. An ADX value nearing 50 is considered strong, which implies that the upward trend is powerful and likely to continue unless there’s a major shift in market conditions.
The ADX, or Average Directional Index, is a technical indicator used to quantify the strength of a market trend. It doesn’t indicate the direction of the trend, whether it’s up or down, but rather measures how strong the trend is.
Read more: 7 Hot Meme Coins and Altcoins that are Trending in 2024
An ADX value below 20 generally points to a weak or non-trending market, while values above 25 signal a strong trend. When the ADX climbs above 40, it indicates a very powerful trend, which traders often use as a sign of increased buying or selling pressure depending on the direction of price movement.
With BRETT’s ADX now at 46.87, it indicates that the current uptrend is exceptionally strong. A strong ADX value combined with an upward price trend suggests that the buying momentum is increasing, making it likely that the bullish trend could be sustained in the near term.
BRETT RSI Just Surged into Overbought Territory
Alongside the strong ADX, BRETT’s RSI (Relative Strength Index) has surged dramatically. Just four days ago, the RSI stood at 40, but it has now climbed to 75.69. That suggests that the buying momentum has intensified quickly. This significant increase in the RSI, coupled with a high ADX, paints a mixed picture of both strength and caution in BRETT’s market conditions.
The RSI, or Relative Strength Index, is a technical indicator used to measure the speed and change of price movements. It ranges from 0 to 100 and helps indicate whether an asset is overbought or oversold.
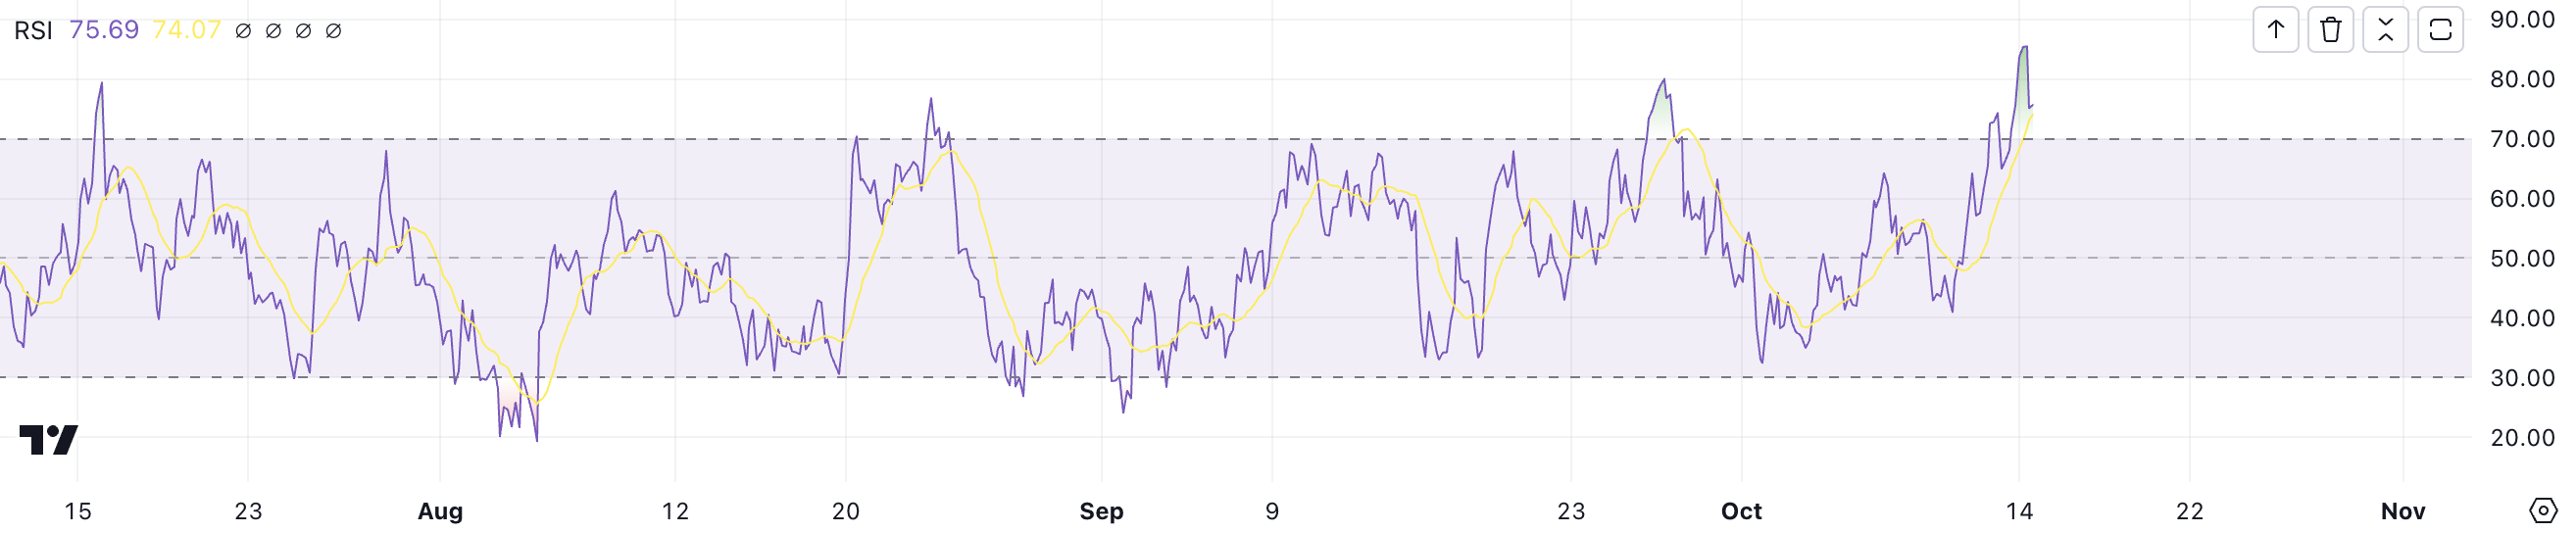
Typically, an RSI below 30 indicates that an asset is oversold, signaling a potential buying opportunity. An RSI above 70 suggests that the asset might be overbought, potentially leading to a price correction.
With BRETT’s RSI now at 75.69, it suggests that the asset has entered the overbought territory. This elevated RSI points to strong recent buying pressure. It also hints that the price may have risen too far, too quickly. Although the ADX confirms the current uptrend is strong, the high RSI level could mean that BRETT is due for a correction.
BRETT Price Prediction: A Potential 32% Correction Ahead?
BRETT’s EMA lines are currently showing a strong uptrend, highlighting a bullish sentiment in the market. On October 11, BRETT experienced a significant technical event known as a “golden cross,” where its short-term EMA (Exponential Moving Average) crossed above its long-term EMA.
This crossover is typically seen as a bullish indicator, signaling the potential for sustained upward momentum. EMA lines themselves are tools used by traders to gauge the average price movement of an asset over a set period, giving more weight to recent data points to capture current market trends better.
A golden cross is a bullish technical pattern that occurs when a short-term EMA crosses above a longer-term EMA. This event is generally interpreted as a sign that positive momentum is building. The presence of a golden cross suggests that BRETT’s uptrend could continue. That could potentially drive its price to test the next resistance level around $0.1455.
Read more: 7 Best Base Chain Meme Coins to Watch in October 2024
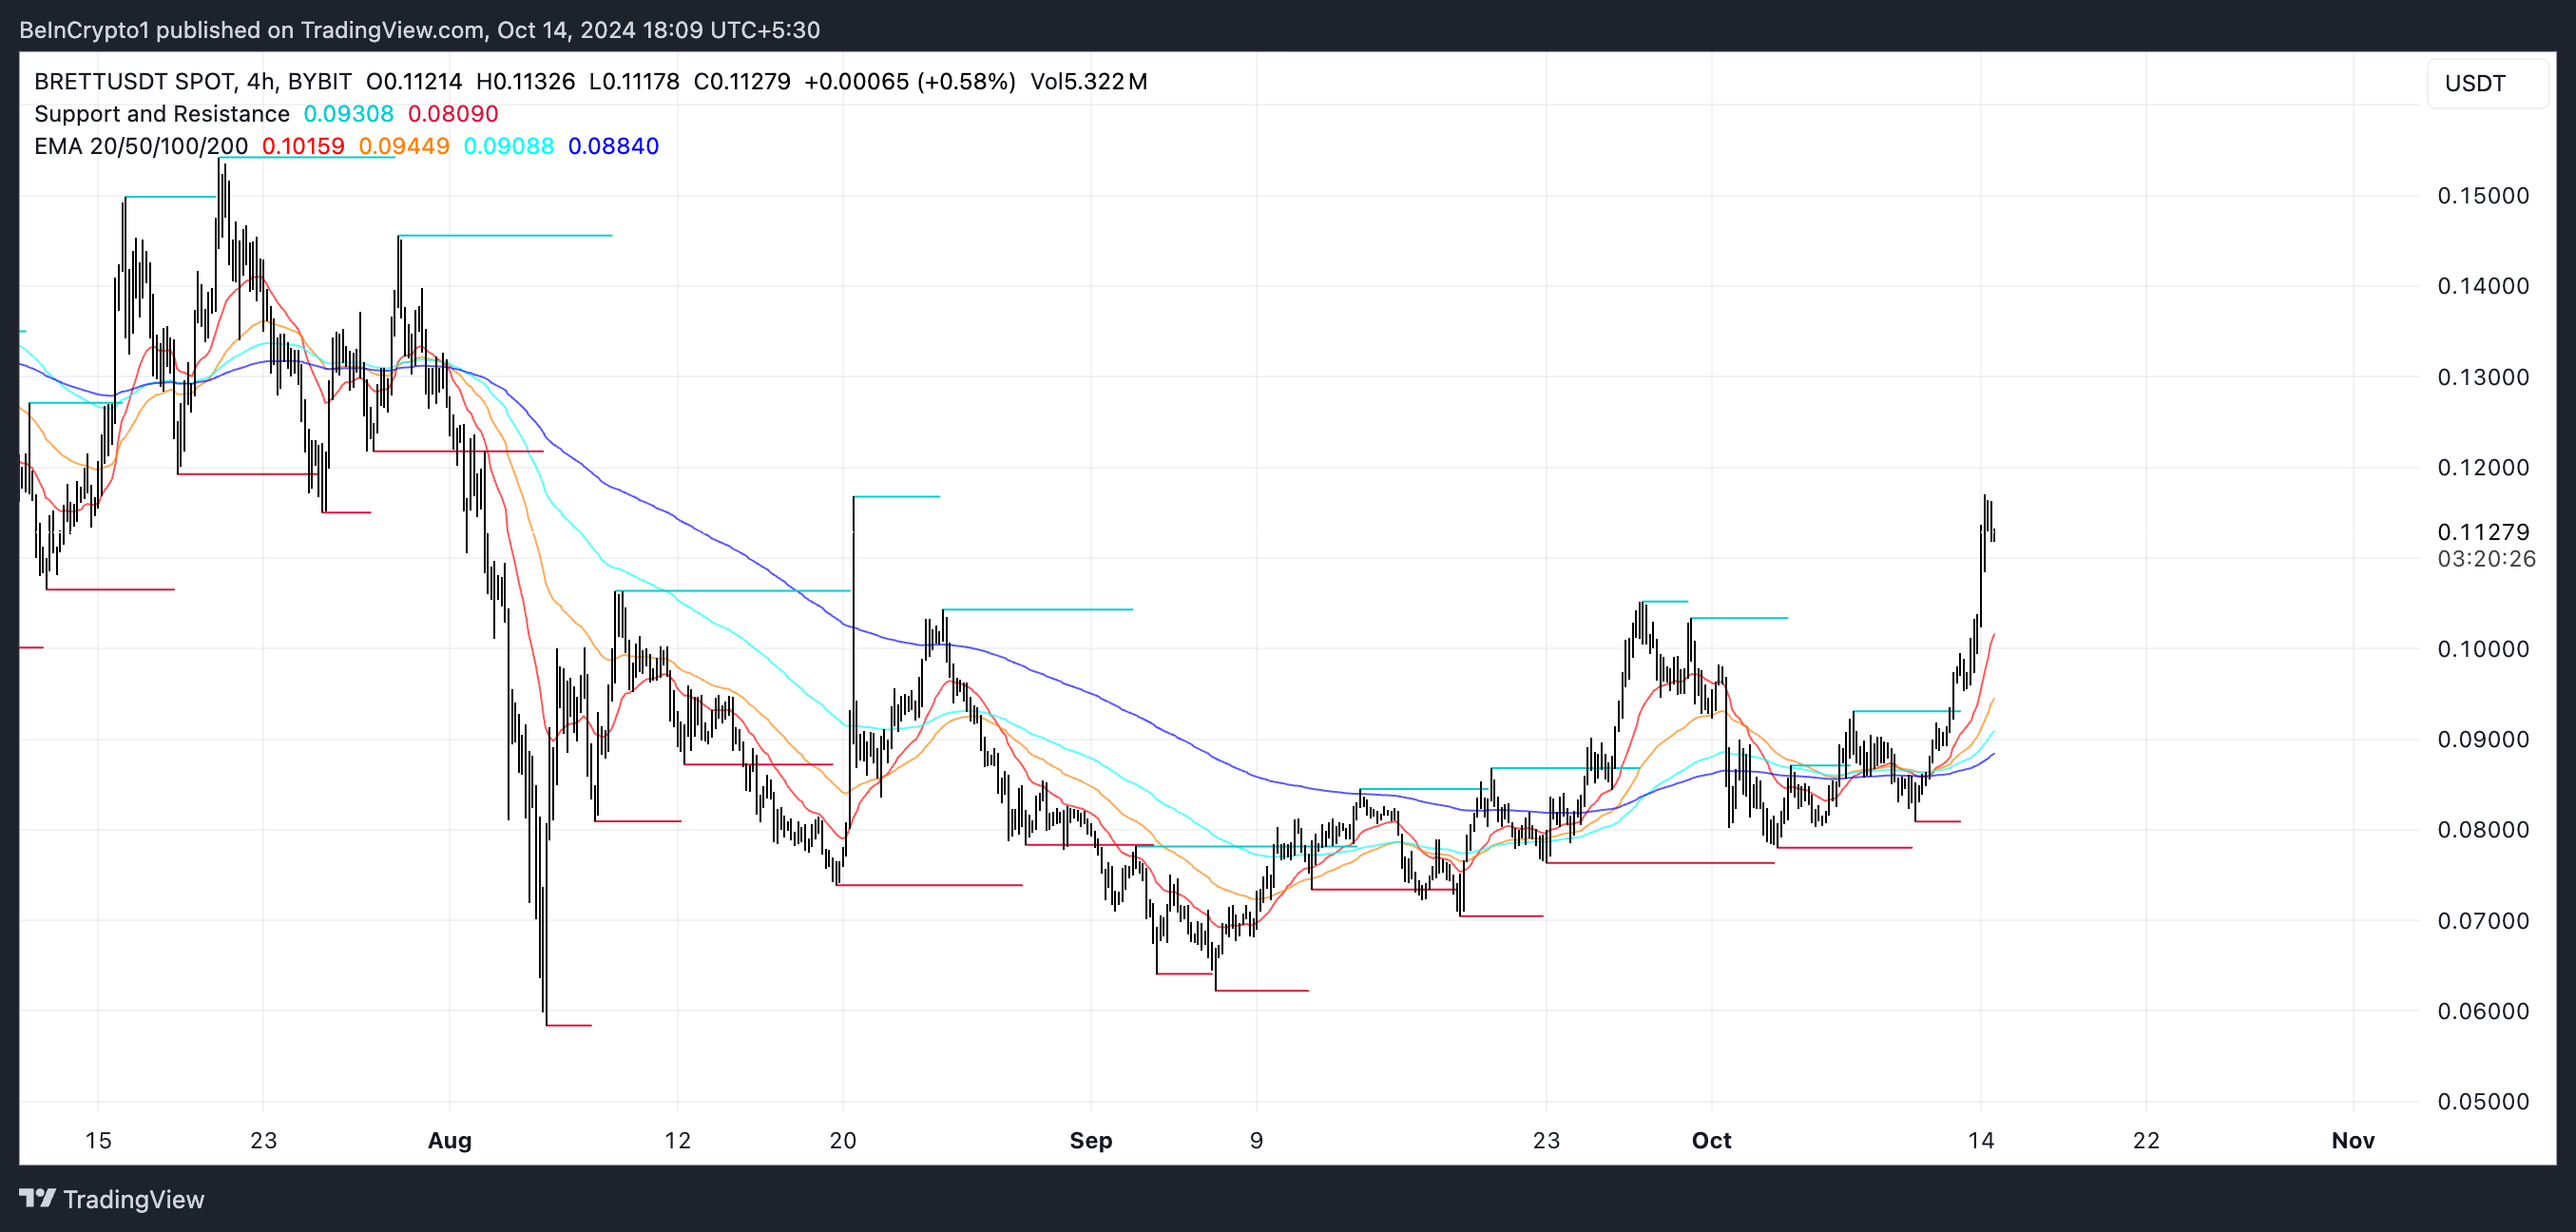
However, despite the strong uptrend indicated by the EMA lines and the golden cross, the RSI points to a different potential outcome. With the RSI currently at 75.69, BRETT is in overbought territory. That indicates that the recent buying pressure may be reaching unsustainable levels. If this overbought condition leads to a reversal, BRETT could see a significant price correction.
In such a scenario, key support levels are likely to be tested. That would start around $0.087 and potentially drop to $0.076, which would represent a 32% correction from its current value. This mix of bullish and overbought signals means traders should watch closely, as the market could either continue to push towards higher targets or enter a phase of sharp retracement.
Disclaimer
In line with the Trust Project guidelines, this price analysis article is for informational purposes only and should not be considered financial or investment advice. BeInCrypto is committed to accurate, unbiased reporting, but market conditions are subject to change without notice. Always conduct your own research and consult with a professional before making any financial decisions. Please note that our Terms and Conditions, Privacy Policy, and Disclaimers have been updated.
Source link
Tiago Amaral
https://beincrypto.com/brett-price-powerful-uptrend-overbought/
2024-10-14 20:00:00