
Celestia’s (TIA) price remains uncertain as both trend indicators and key levels fail to provide a clear direction. The ADX and Ichimoku Cloud show weak momentum, indicating a lack of decisive strength from either bulls or bears.
While the EMA lines and support/resistance levels hint at consolidation, a breakout in either direction is needed to determine the next significant move.
TIA Next Direction Is Still Not Defined
The ADX (Average Directional Index) on the TIA DMI chart (Yellow Line) stands at 16.5, indicating a weak trend. ADX is a momentum indicator used to assess the strength of a trend, regardless of its direction.
Typically, an ADX value below 20 suggests that the trend is not strong, while values above 25 indicate a more defined trend. With the current value at 16.5, TIA lacks clear momentum, implying that any trend—bullish or bearish—does not have significant strength.
The +DI (Blue Line) is at 15.6, while the -DI (Red Line) is at 17.3. The +DI represents bullish pressure, and the -DI represents bearish pressure. Since the -DI is higher than the +DI, it indicates that bearish pressure is slightly dominant at the moment.
Given the weak ADX reading, this suggests that while the bears are in control, their grip on TIA’s price movement is not firm. As a result, TIA’s price is likely to remain range-bound or show minimal movement until stronger momentum develops.
Read more: 10 Best Altcoin Exchanges In 2024
Ichimoku Cloud Also Shows Mixed Signals for Celestia
The Ichimoku Cloud chart for TIA reveals a mixed picture. Currently, the price is sitting close to the cloud, which is an area of uncertainty. When prices are within or near the cloud, it indicates a period of consolidation or indecisiveness in the market.
If the price manages to break above the cloud, it could signal a bullish trend, whereas a break below could indicate a bearish move. The thickness of the cloud ahead also plays a role; a thicker cloud implies stronger resistance or support.
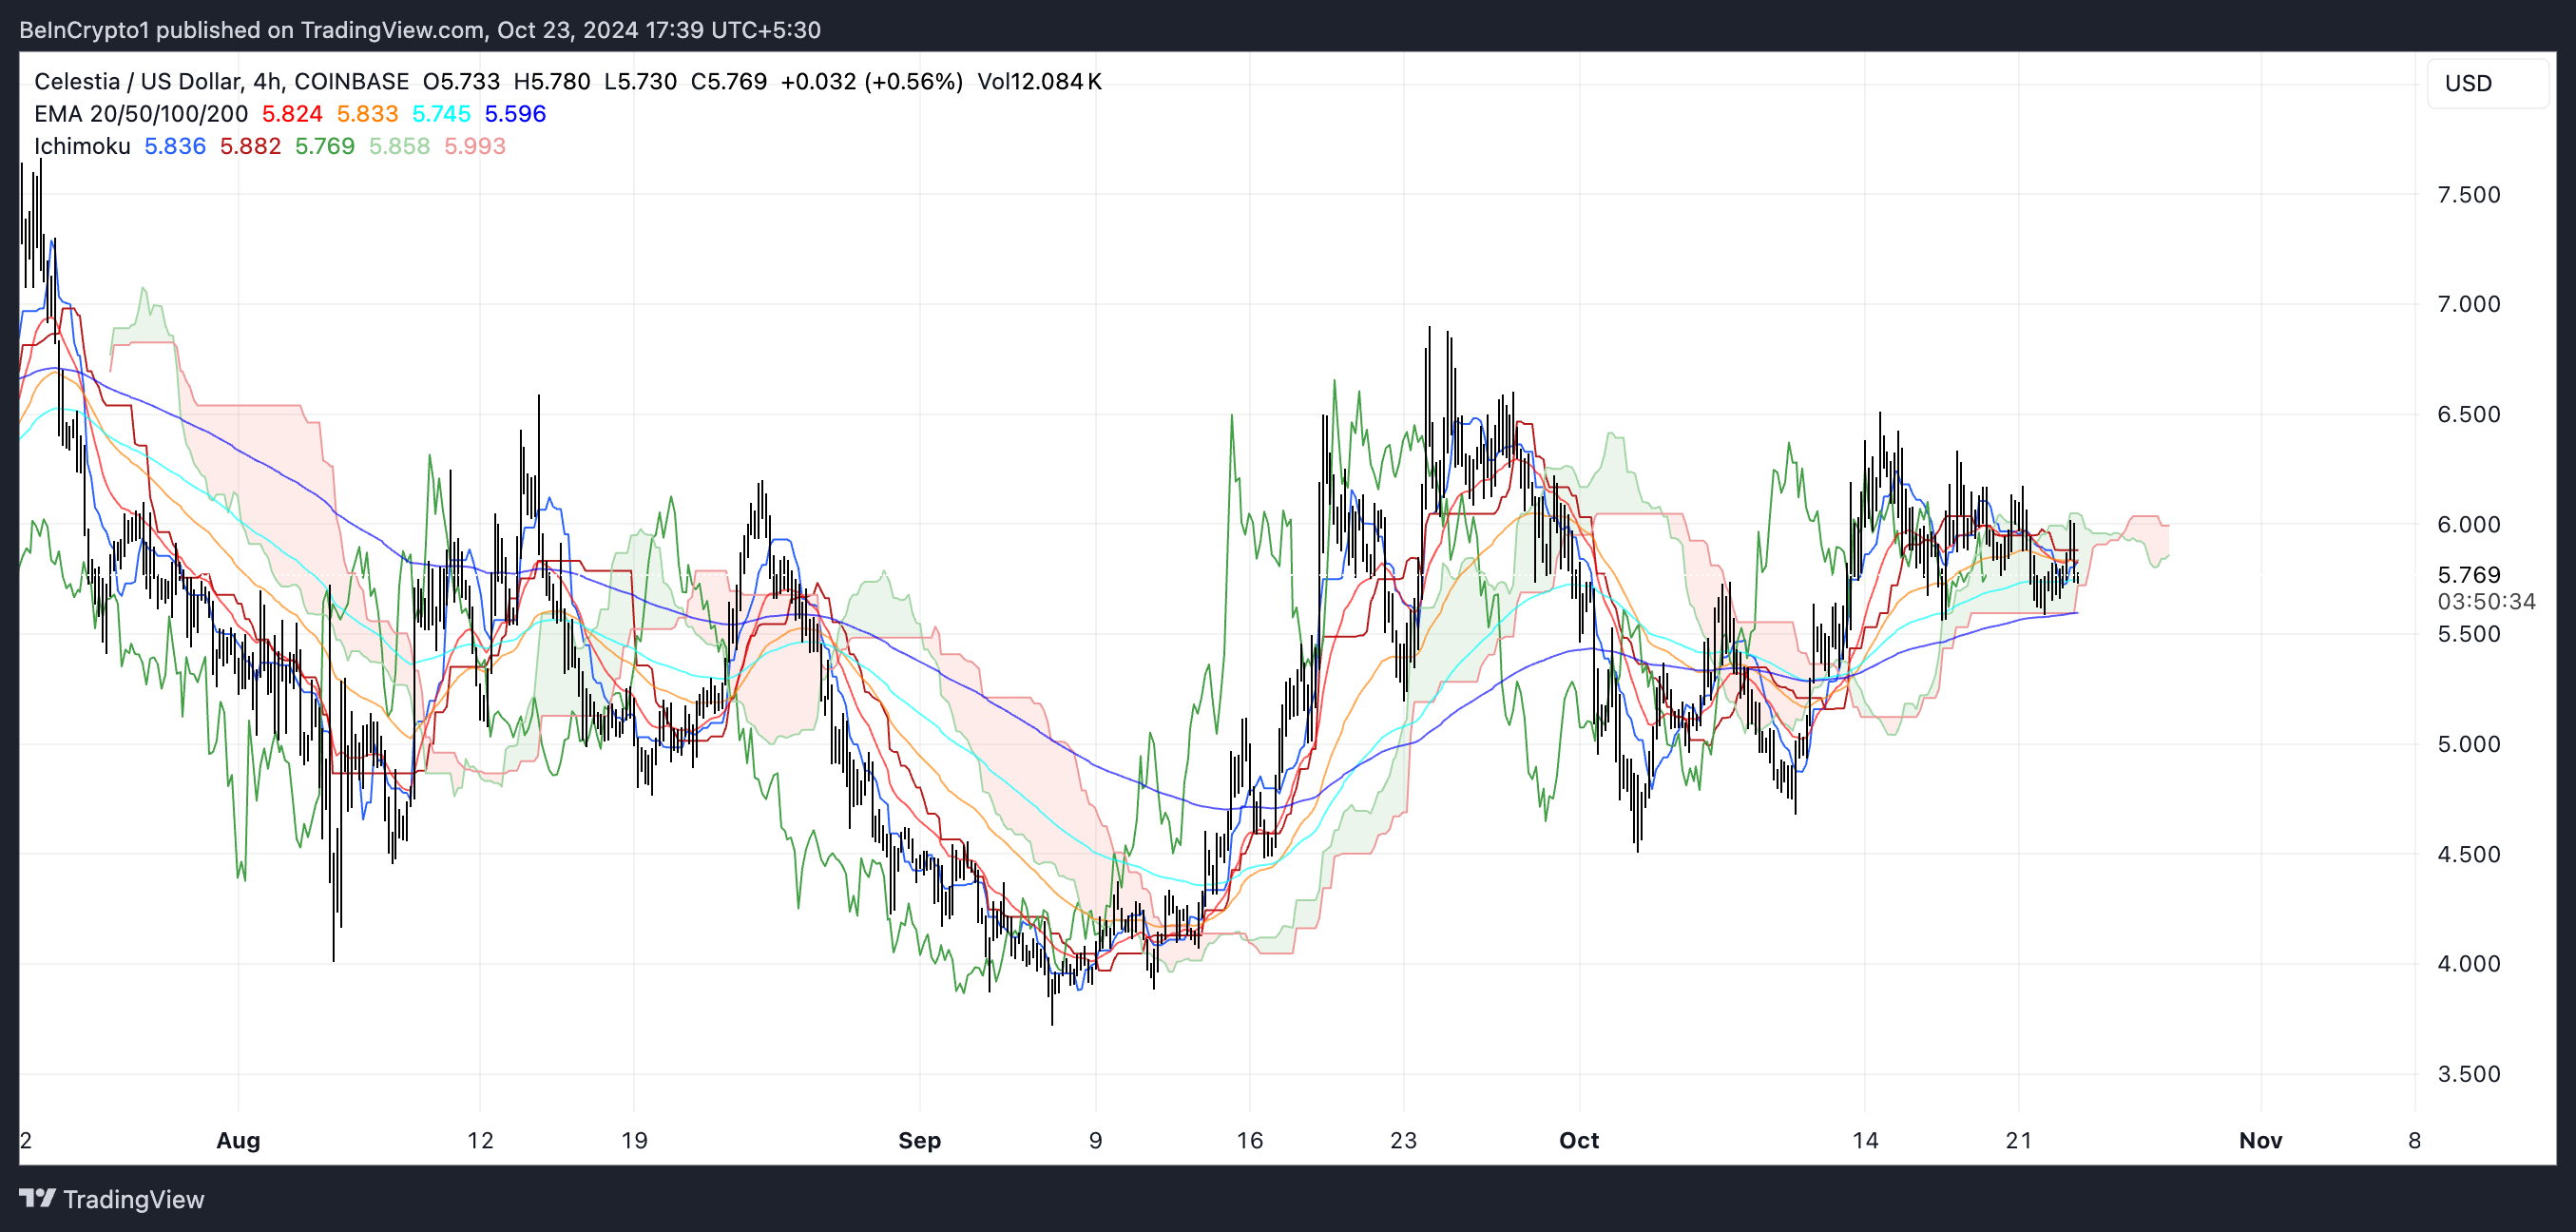
The Tenkan-sen (conversion line) and Kijun-sen (base line) are relatively close, suggesting that momentum is not clearly favoring either side. The future cloud is also mixed, which indicates a lack of a strong directional trend.
Given this, the next move for TIA’s price might depend on its ability to either clear the resistance of the cloud or break support to the downside. Until then, traders should watch for a definitive breakout in either direction to assess the next significant move.
TIA Price Prediction: Is It Possible to Get Back to $6 in October?
The EMA (Exponential Moving Average) lines on the TIA chart indicate mixed momentum for the price. The EMAs are closely aligned, with the shorter EMAs hovering slightly above the longer-term EMAs.
This positioning suggests that TIA is experiencing a phase of limited momentum, where there is neither strong bullish nor bearish dominance. The price staying close to all EMAs indicates consolidation, and it will need a clear move above or below these EMAs for a potential trend to emerge.
Read More: 3 Altcoins to Watch in the Fourth Week of October 2024
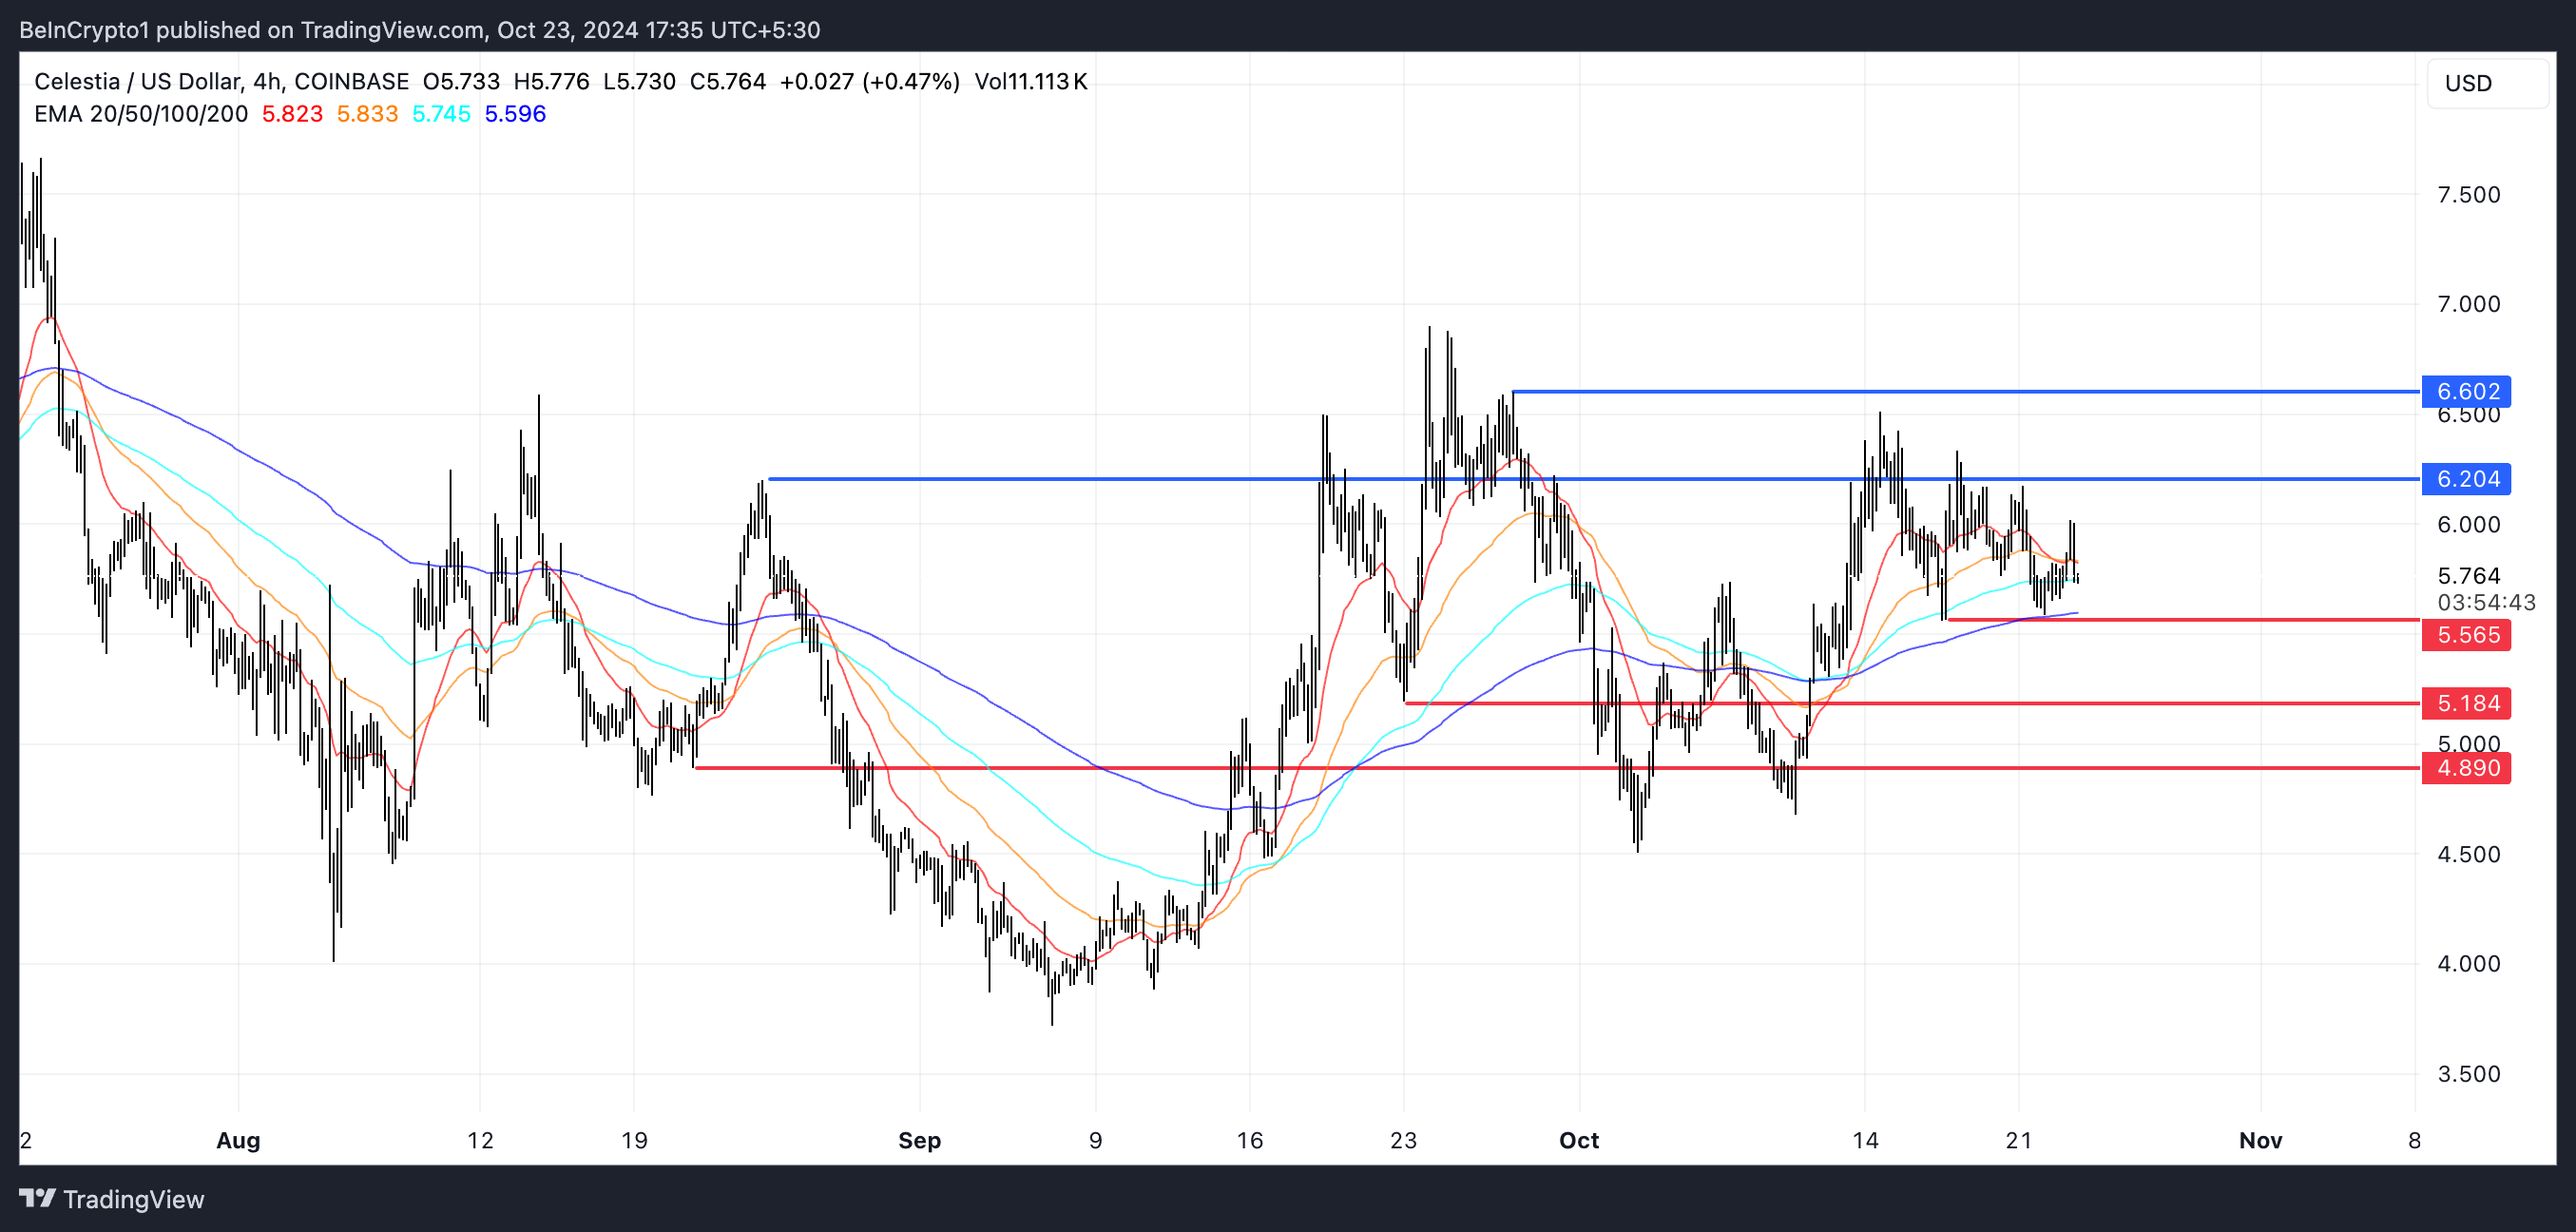
Regarding support and resistance zones, TIA has strong resistance levels marked at $6.20 and $6.60. If TIA’s price breaks above $6.20, it could attempt to challenge $6.60.
On the flip side, a break below $5.56 could expose the price to deeper pullbacks towards $5.18 or even $4.89, marking a potential 15% price correction. The current positioning of the price suggests a period of indecisiveness, where breaking key support or resistance will dictate the next movement direction.
Disclaimer
In line with the Trust Project guidelines, this price analysis article is for informational purposes only and should not be considered financial or investment advice. BeInCrypto is committed to accurate, unbiased reporting, but market conditions are subject to change without notice. Always conduct your own research and consult with a professional before making any financial decisions. Please note that our Terms and Conditions, Privacy Policy, and Disclaimers have been updated.
Source link
Tiago Amaral
https://beincrypto.com/celestia-tia-price-stuck-consolidation/
2024-10-23 17:00:00