
Ethereum is currently at a critical juncture, with its price testing the $2.6K-$2.7K resistance zone. A breakout above this range could signal a mid-term bullish trend, potentially driving the price toward $2.8K and beyond.
However, if the resistance holds, Ethereum may enter another bearish consolidation.
Technical Analysis
By Shayan
The Daily Chart
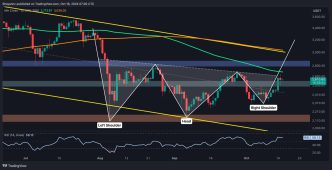
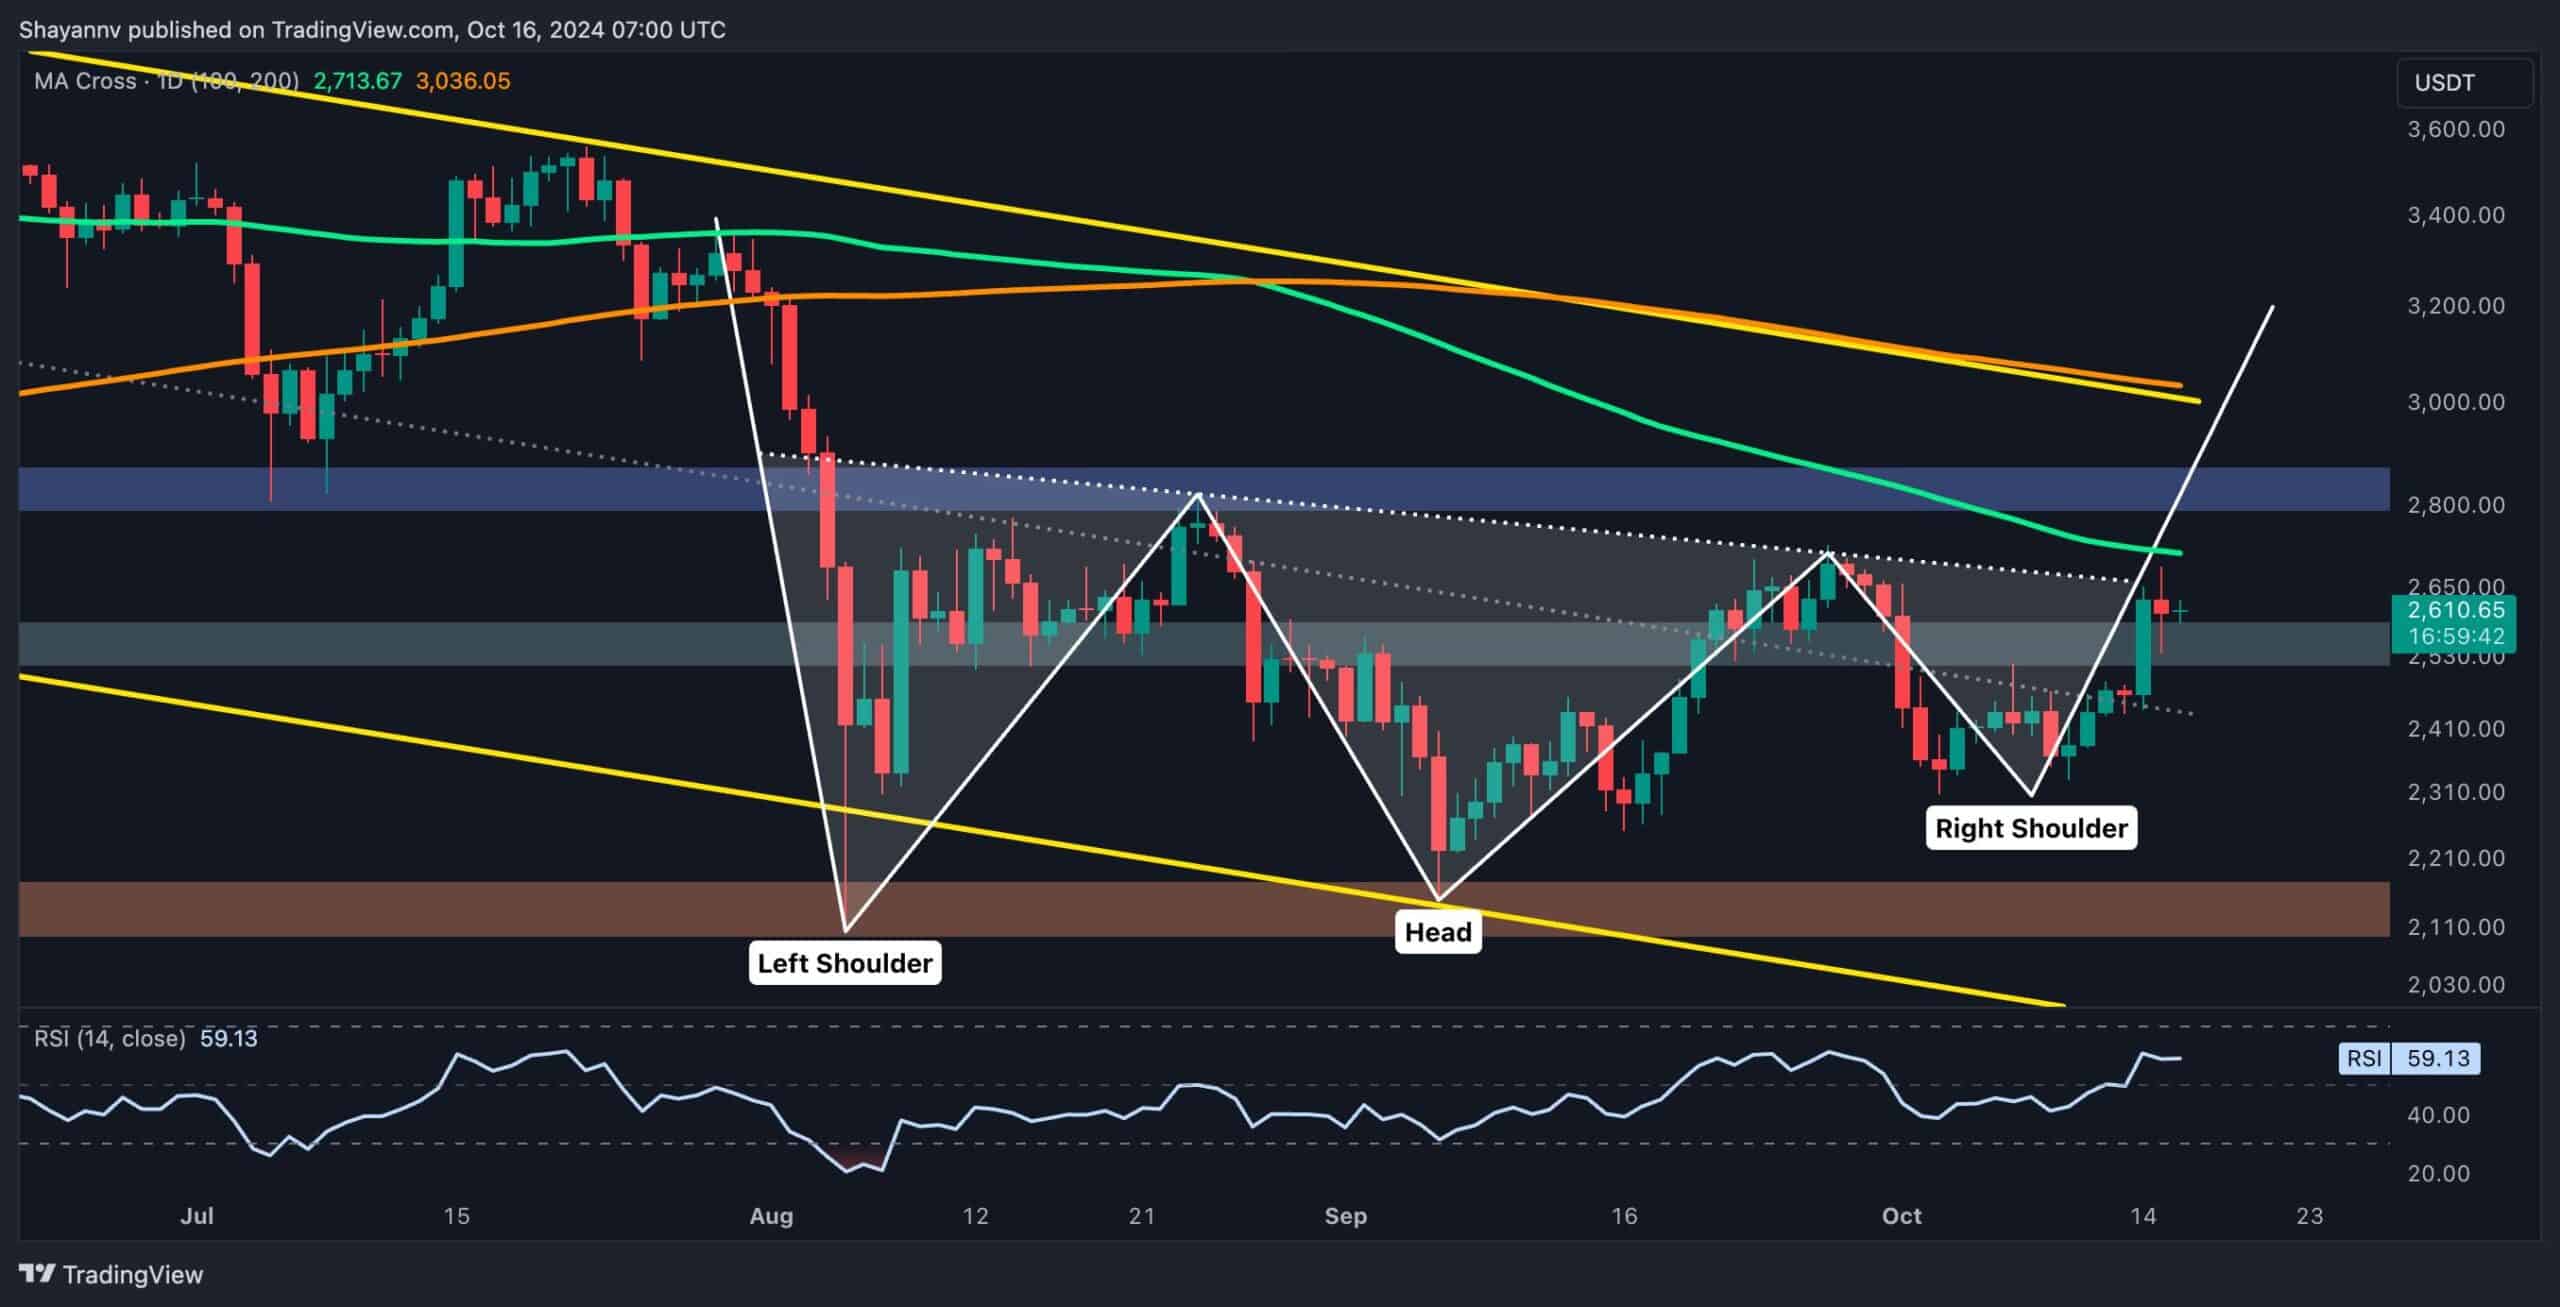
Ethereum has recently experienced a surge in price, primarily driven by heightened buying activity around the $2.3K support level. This bullish momentum has allowed the cryptocurrency to break above the descending channel’s middle trendline, signaling a possibly bullish shift.
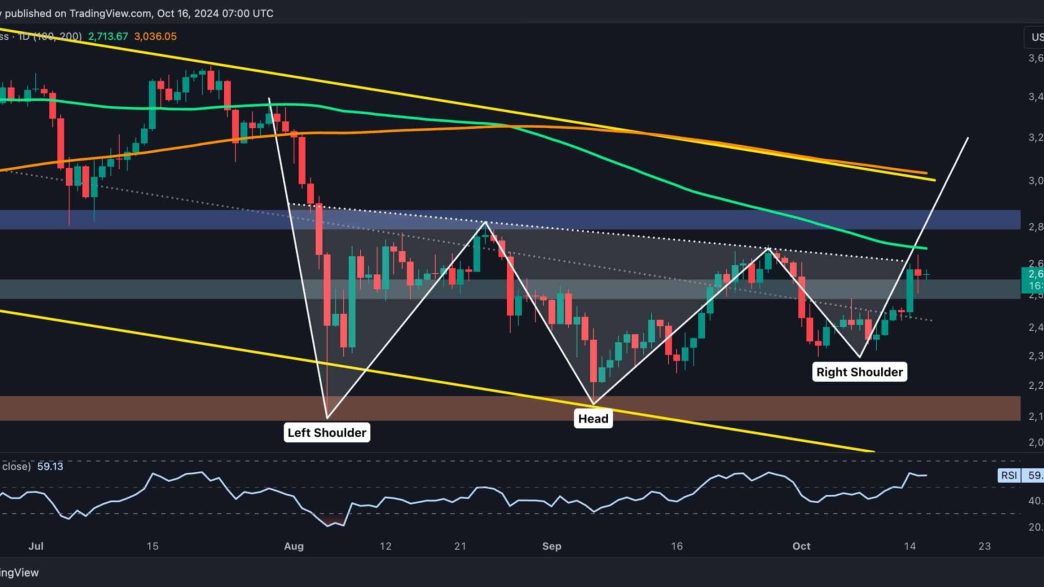
However, the asset is now encountering a substantial resistance region, consisting of the Head and Shoulders (H&S) neckline and the 100-day moving average (MA) at $2.6K.
If Ethereum can breach this key resistance zone, it would confirm the completion of the H&S pattern, which is a bullish reversal signal. This would indicate a shift toward a mid-term uptrend, potentially pushing the price toward the $2.8K threshold, another critical resistance level. Additionally, a break above the 100-day MA would highlight buyers’ dominance in the market.
However, this resistance area could also trigger a rejection, as it’s considered a zone with significant supply. If sellers regain control, it may lead to a bearish consolidation phase, stalling further upward price movement.
The 4-Hour Chart
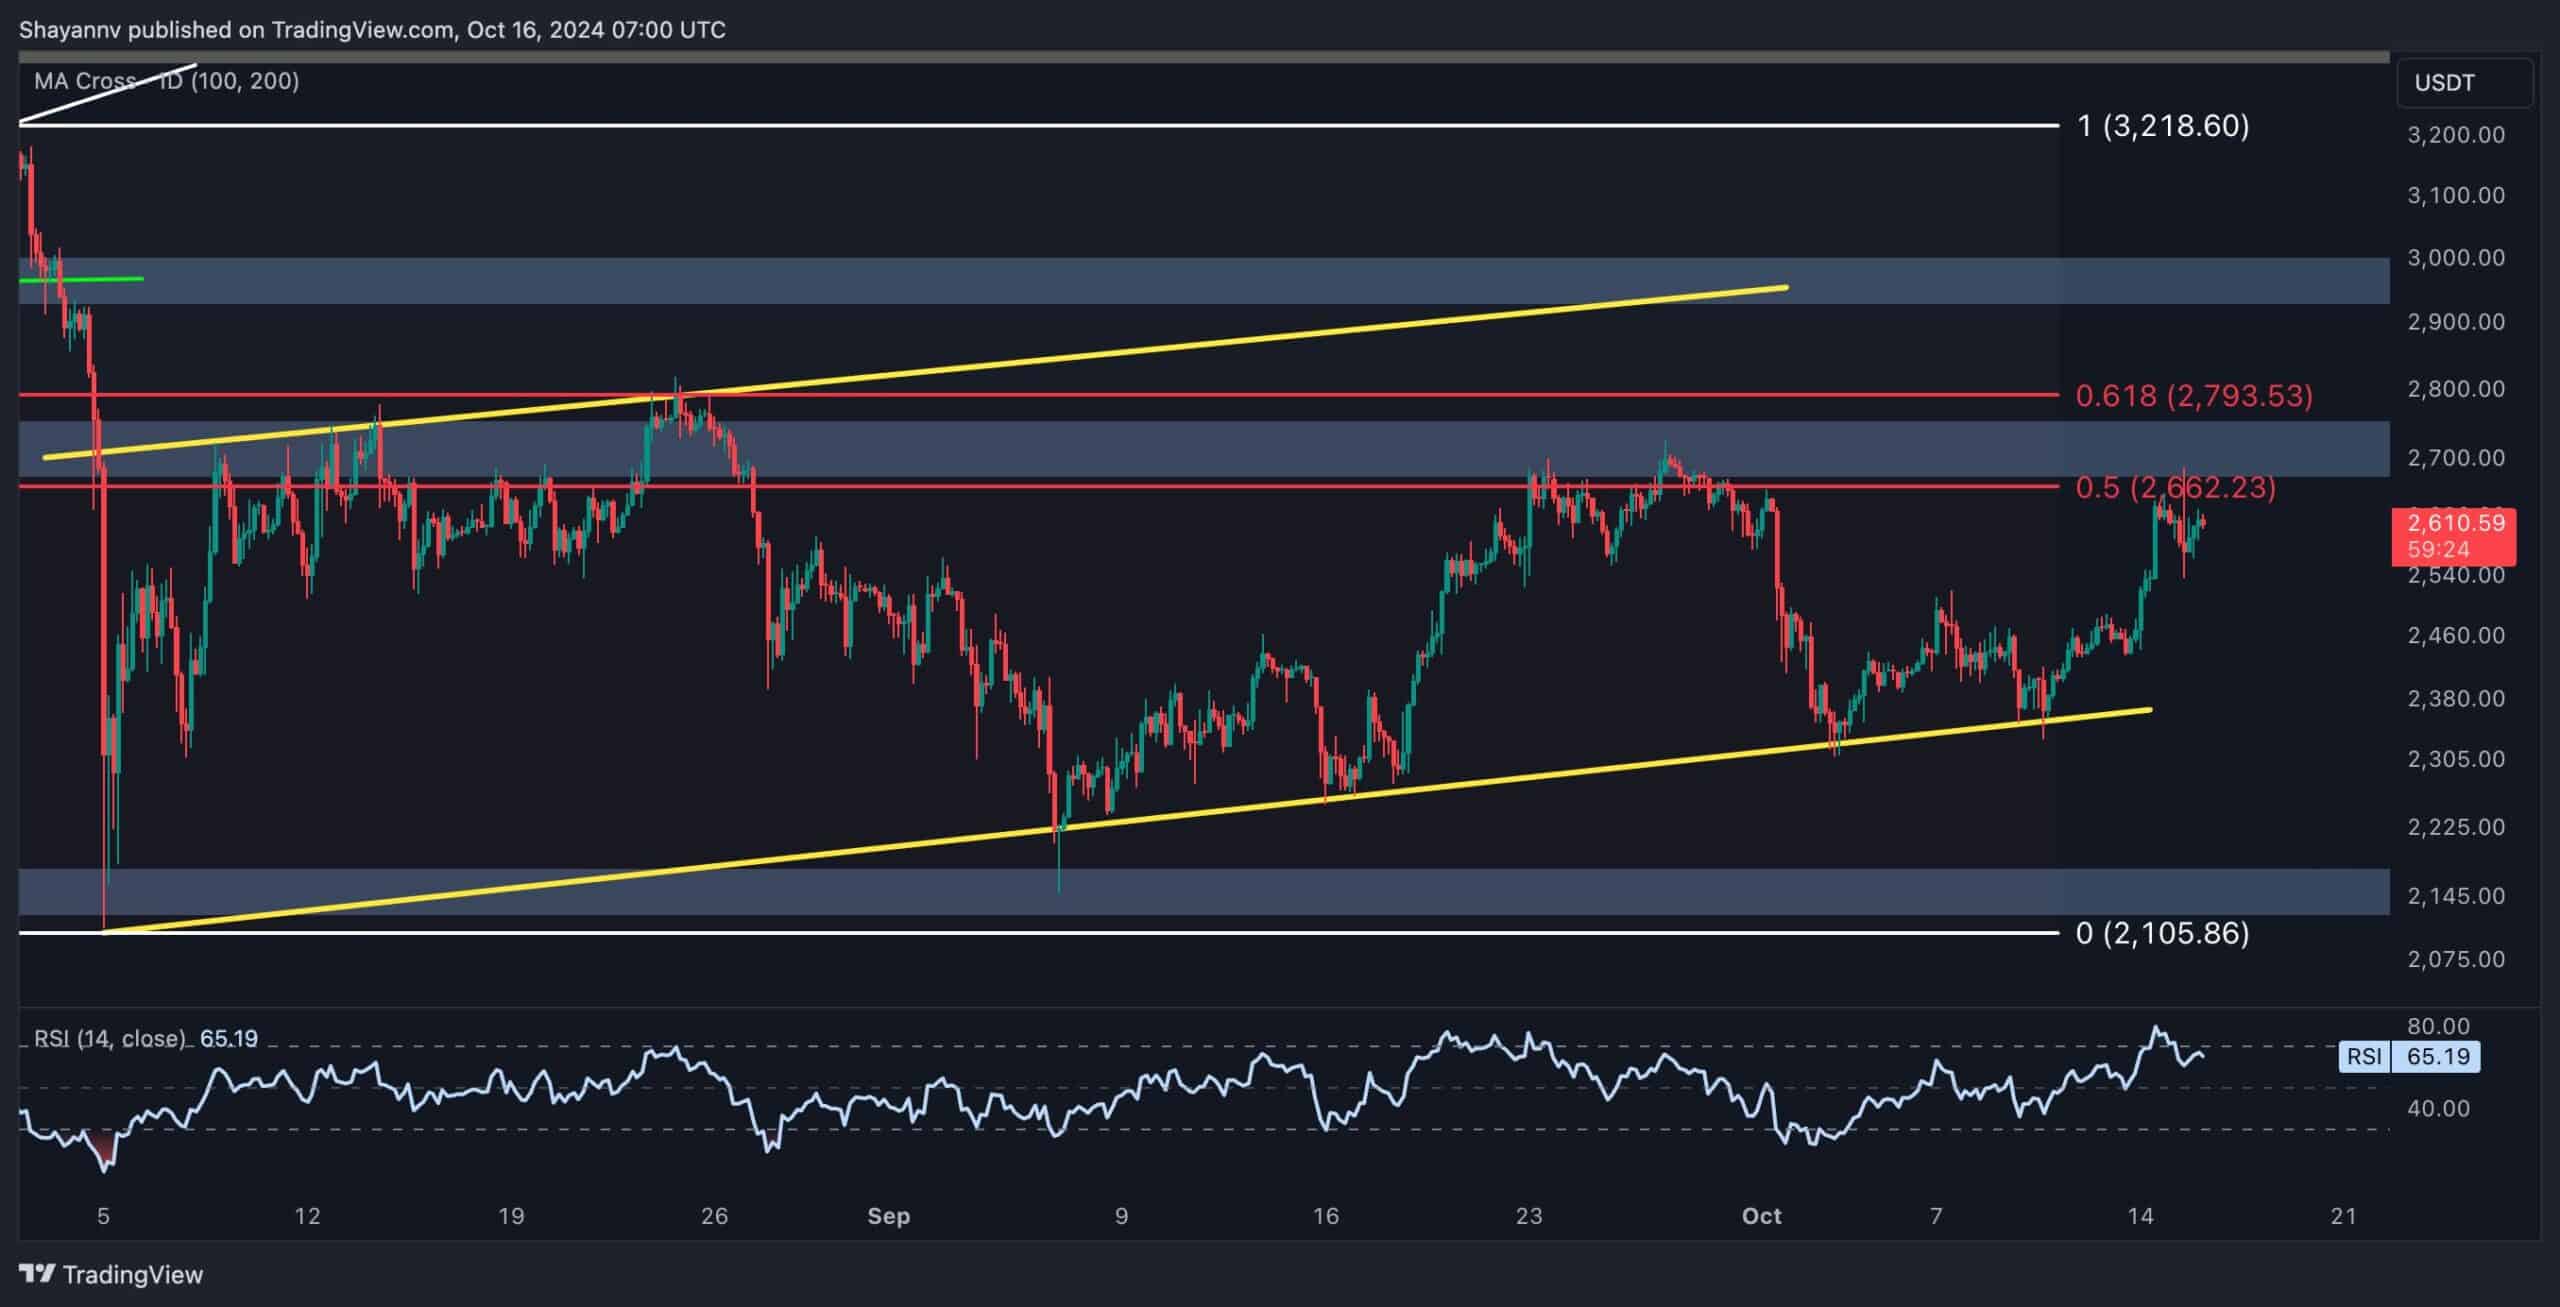
On the 4-hour chart, Ethereum received strong support at $2.3K, forming a double-bottom pattern, a bullish reversal indicator. This pattern fueled a sharp price increase, pushing ETH to the resistance zone between the 0.5 ($2.6K) and 0.618 ($2.7K) Fibonacci retracement levels.
This resistance region has proven difficult to break, as Ethereum has faced multiple rejections from this area in recent months. The upcoming price action will be pivotal for determining Ethereum’s next direction. If this resistance rejects the price, it may trigger a downward movement toward $2.3K. However, a breakout above $2.7K would open the door for further gains and a potential rally.
Onchain Analysis
By Shayan
The Taker Buy-Sell Ratio is a key futures market metric that measures whether buyers or sellers are more aggressive in executing their orders. This ratio provides valuable insight into futures traders’ sentiment and can be an essential complement to traditional price analysis.
As shown in the chart, after Ethereum’s bullish rebound near the $2.3K level, there has been a significant surge in the execution of market buy orders in the futures market. This has driven the Taker Buy-Sell Ratio to its highest in weeks, suggesting that future participants are optimistic about ETH’s short-term price trajectory.
This metric indicates a shift in market sentiment, as aggressive buying signals that traders expect the price to continue rising. If the Taker Buy-Sell Ratio surpasses 1, it reflects that buyers are overwhelmingly dominant, which often aligns with the start of a bullish trend.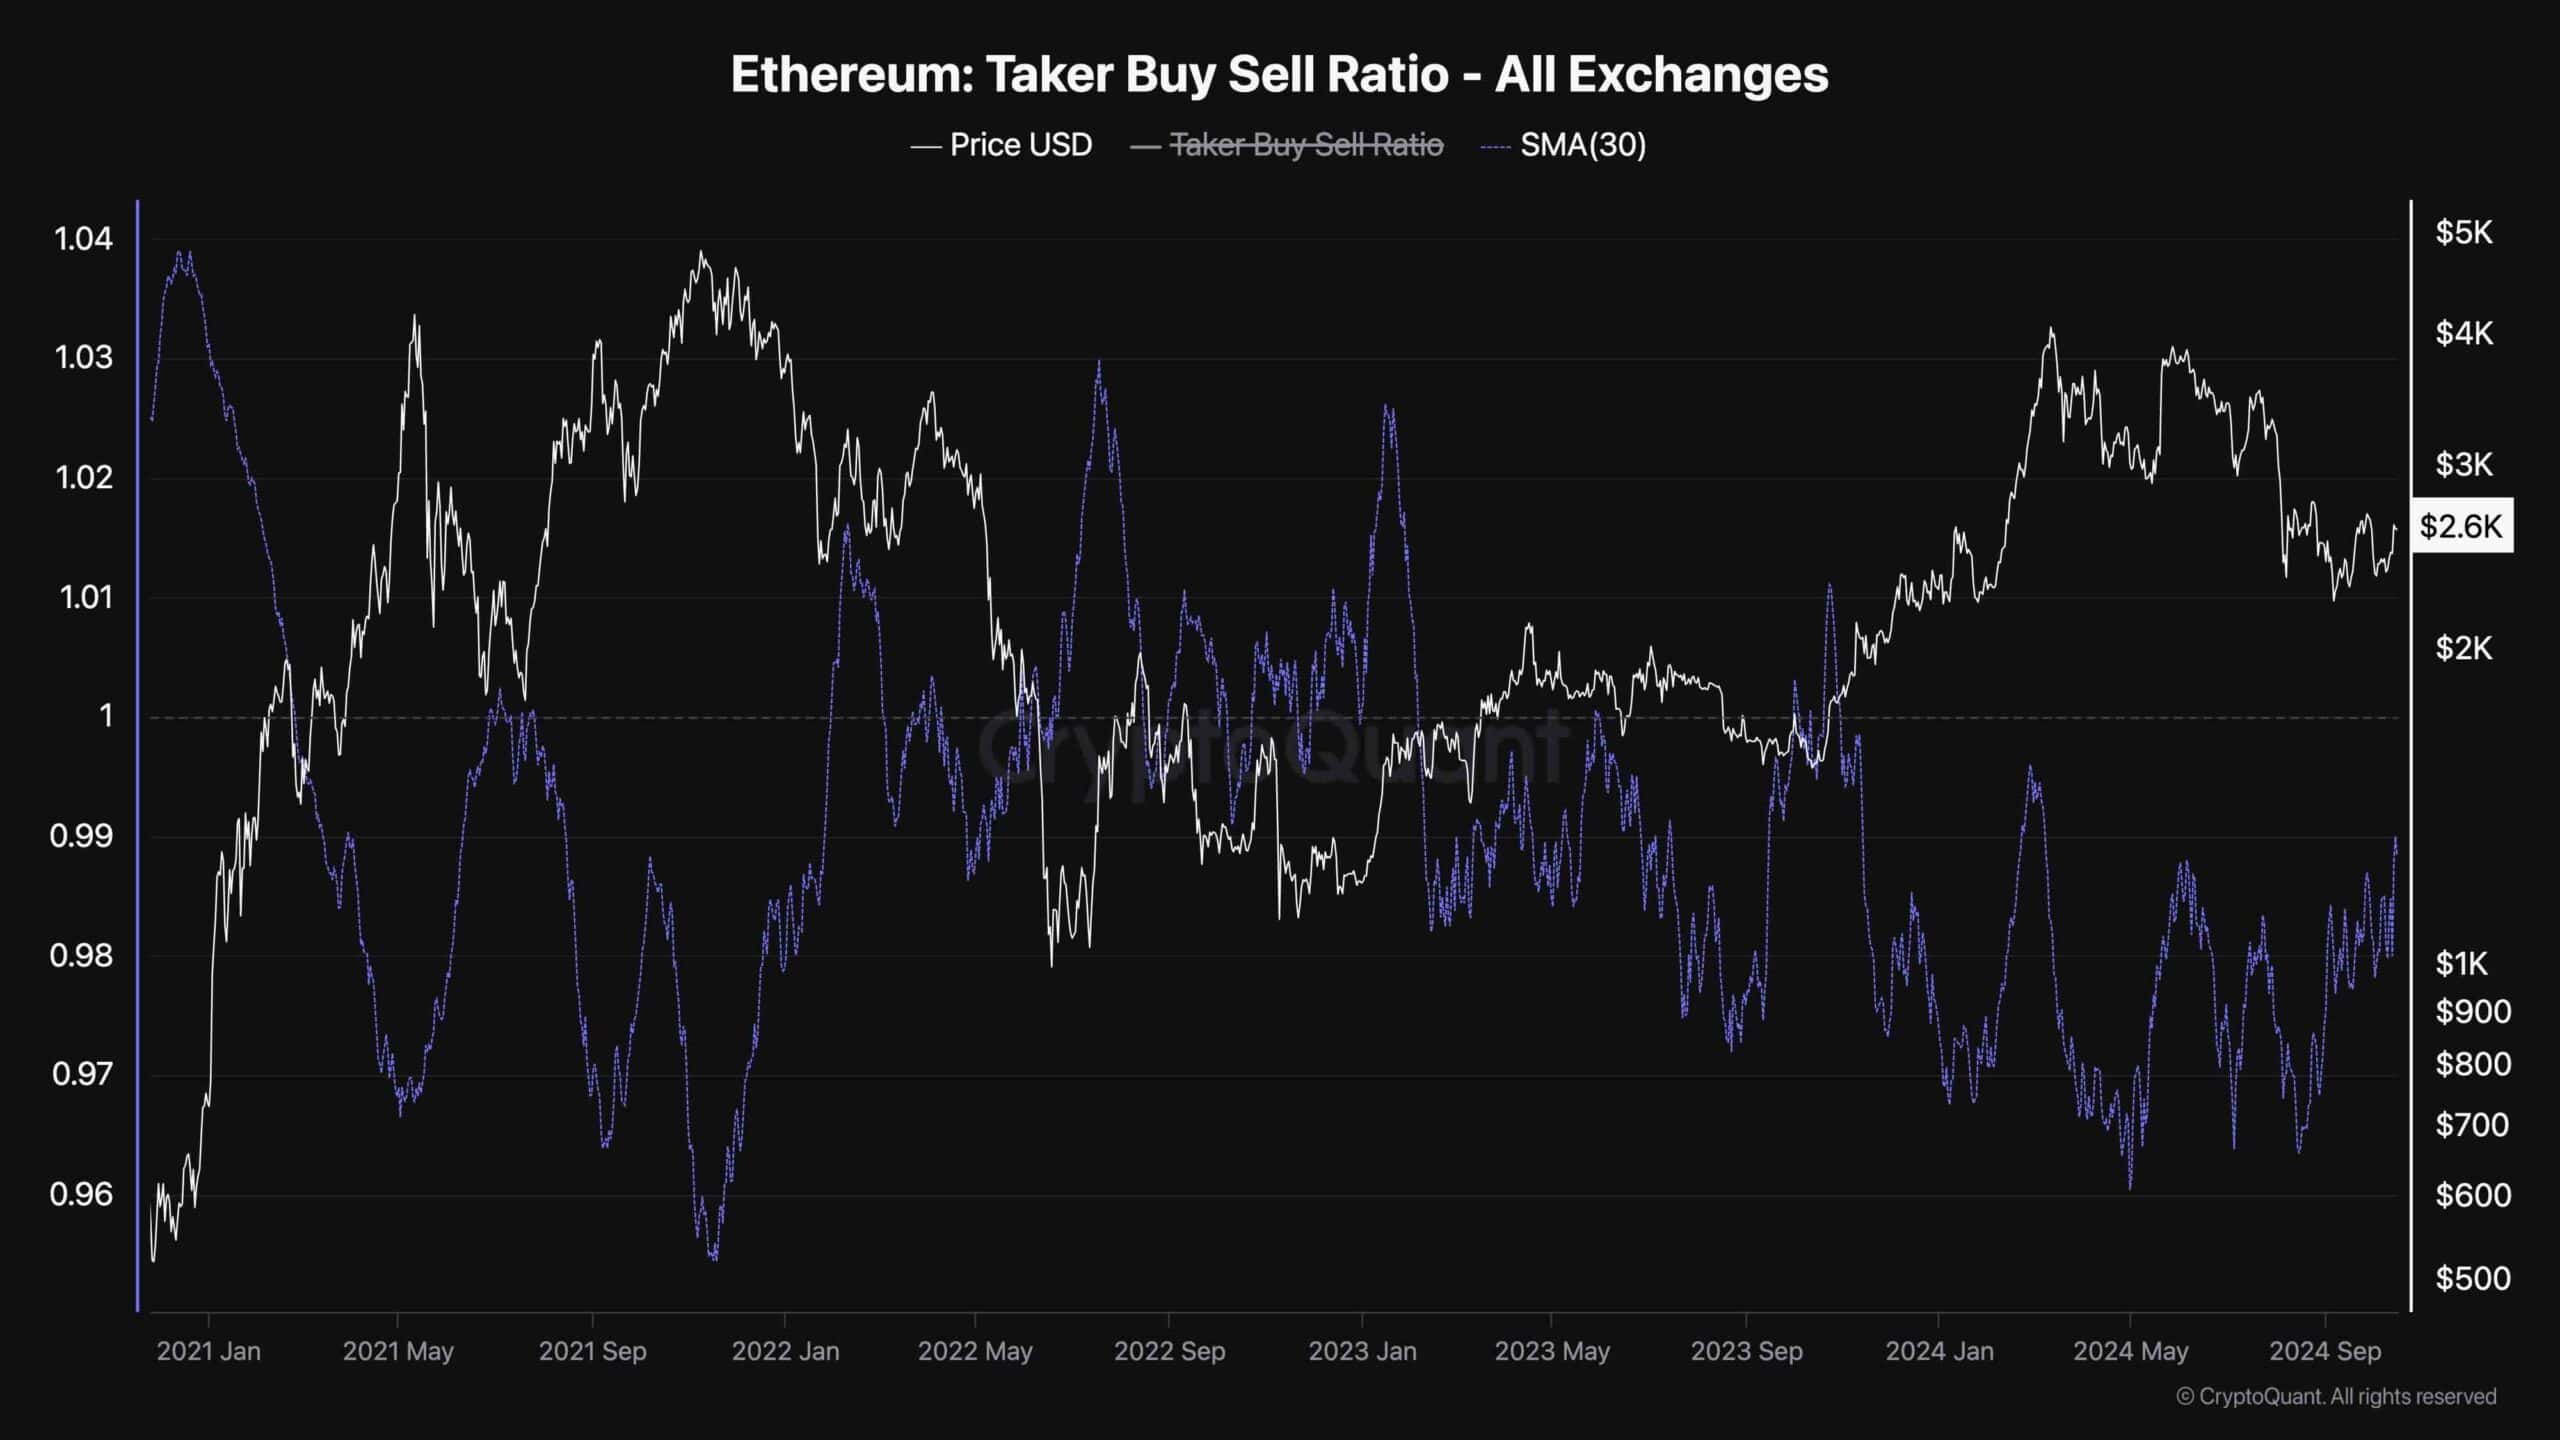
Binance Free $600 (CryptoPotato Exclusive): Use this link to register a new account and receive $600 exclusive welcome offer on Binance (full details).
LIMITED OFFER 2024 at BYDFi Exchange: Up to $2,888 welcome reward, use this link to register and open a 100 USDT-M position for free!
Disclaimer: Information found on CryptoPotato is those of writers quoted. It does not represent the opinions of CryptoPotato on whether to buy, sell, or hold any investments. You are advised to conduct your own research before making any investment decisions. Use provided information at your own risk. See Disclaimer for more information.
Cryptocurrency charts by TradingView.
Source link
CryptoVizArt
https://cryptopotato.com/ethereum-price-analysis-can-eth-soar-to-2-8k-after-gaining-8-weekly/
2024-10-16 13:31:24


