Ethereum has been exhibiting strong upward momentum, with a recent surge pushing the price toward the crucial $4K resistance region.
As it approaches this major resistance, there is potential for further gains, although short-term corrective consolidations are likely due to the overbought conditions.
Technical Analysis
By Shayan
The Daily Chart
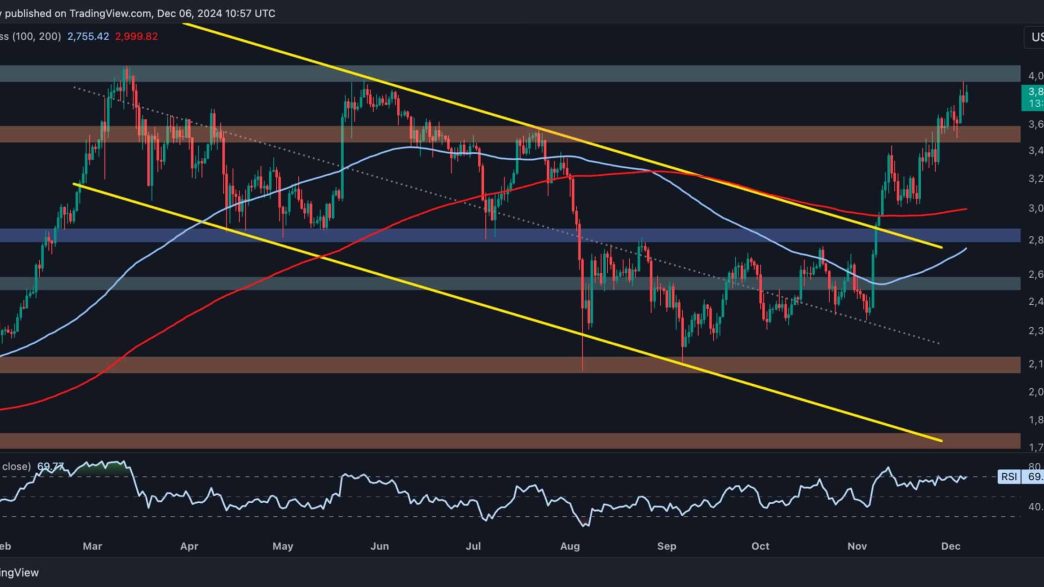
After successfully reclaiming the $3.5K resistance level, Ethereum has continued its bullish trend, reaching the significant $4K resistance region. This price range coincides with ETH’s yearly high and is crucial as it has acted as strong resistance in previous attempts. This price range likely contains substantial selling pressure, which may prevent the asset from pushing higher in the short term.
However, a break above this level would indicate the continuation of the bullish trend and potentially lead to a new all-time high. Considering the market’s overbought state and the strong impulsive move, a consolidation period within the $3.5K-$4K range is expected before any further upward movement. The RSI indicator also confirms this scenario, as the overbought conditions highlight a potential consolidation or corrective stage soon.
The 4-Hour Chart
On the 4-hour chart, ETH’s price is still making higher highs and higher lows, confirming the prevailing bullish trend. However, the RSI is showing a bearish divergence, signaling a loss of bullish momentum. This could lead to a short-term pullback or consolidation, especially near the $4K resistance region.
As Ethereum tests the $4K resistance, the possibility of a temporary rejection becomes high. A retest of the $3.5K support level, where buying pressure has been strong in the past, is likely. If ETH finds support at this level, it could lead to another attempt at breaking the $4K resistance.
Onchain Analysis
By Shayan
Examining Ethereum’s futures market metrics provides valuable insight into market sentiment, complementing price analysis. One key metric to focus on is the Taker Buy Sell Ratio, which reveals the aggressiveness of buyers versus sellers in executing their orders.
As shown in the chart, as Ethereum’s price approaches the significant $4K resistance level, a notable increase in market sell orders is observed. This surge in sell orders has driven the Taker Buy Sell Ratio to its lowest point in several months.
This shift suggests that future market participants may lock in profits or prepare for a potential price correction. The drop in the Taker Buy Sell Ratio implies a possible slowdown in upward price movement as more market participants take a risk-off approach. This aligns with anticipating a price pullback or a correction phase, making it crucial for traders to monitor the futures market for further developments.
Binance Free $600 (CryptoPotato Exclusive): Use this link to register a new account and receive $600 exclusive welcome offer on Binance (full details).
LIMITED OFFER for CryptoPotato readers at Bybit: Use this link to register and open a $500 FREE position on any coin!
Disclaimer: Information found on CryptoPotato is those of writers quoted. It does not represent the opinions of CryptoPotato on whether to buy, sell, or hold any investments. You are advised to conduct your own research before making any investment decisions. Use provided information at your own risk. See Disclaimer for more information.
Cryptocurrency charts by TradingView.
Source link
CryptoVizArt
https://cryptopotato.com/ethereum-price-analysis-can-eth-take-down-4k-resistance-after-gaining-10-weekly/
2024-12-06 15:28:05


