HBAR, the native token of Hedera Hashgraph, the enterprise-grade distributed ledger technology, has witnessed a nearly 10% price surge in the past 24 hours. This rally was fueled by a substantial increase in spot market inflows during that period.
Strengthening buying pressure positions the HBAR token to extend its gains in the short term. Here’s why.
Hedera Sees Increased Spot Inflow
Data from on-chain analytics platform Coinglass reveals an influx of $2 million into HBAR’s spot markets on Friday. This suggests a growing confidence in the altcoin’s future price performance.
When investors increase spot inflows into an asset, they directly invest in it on spot markets, where transactions occur at the current market price. This reflects growing investor confidence as it signals more participants are buying the asset outright. Such inflows often drive up demand, potentially contributing to upward pressure on the asset’s price.
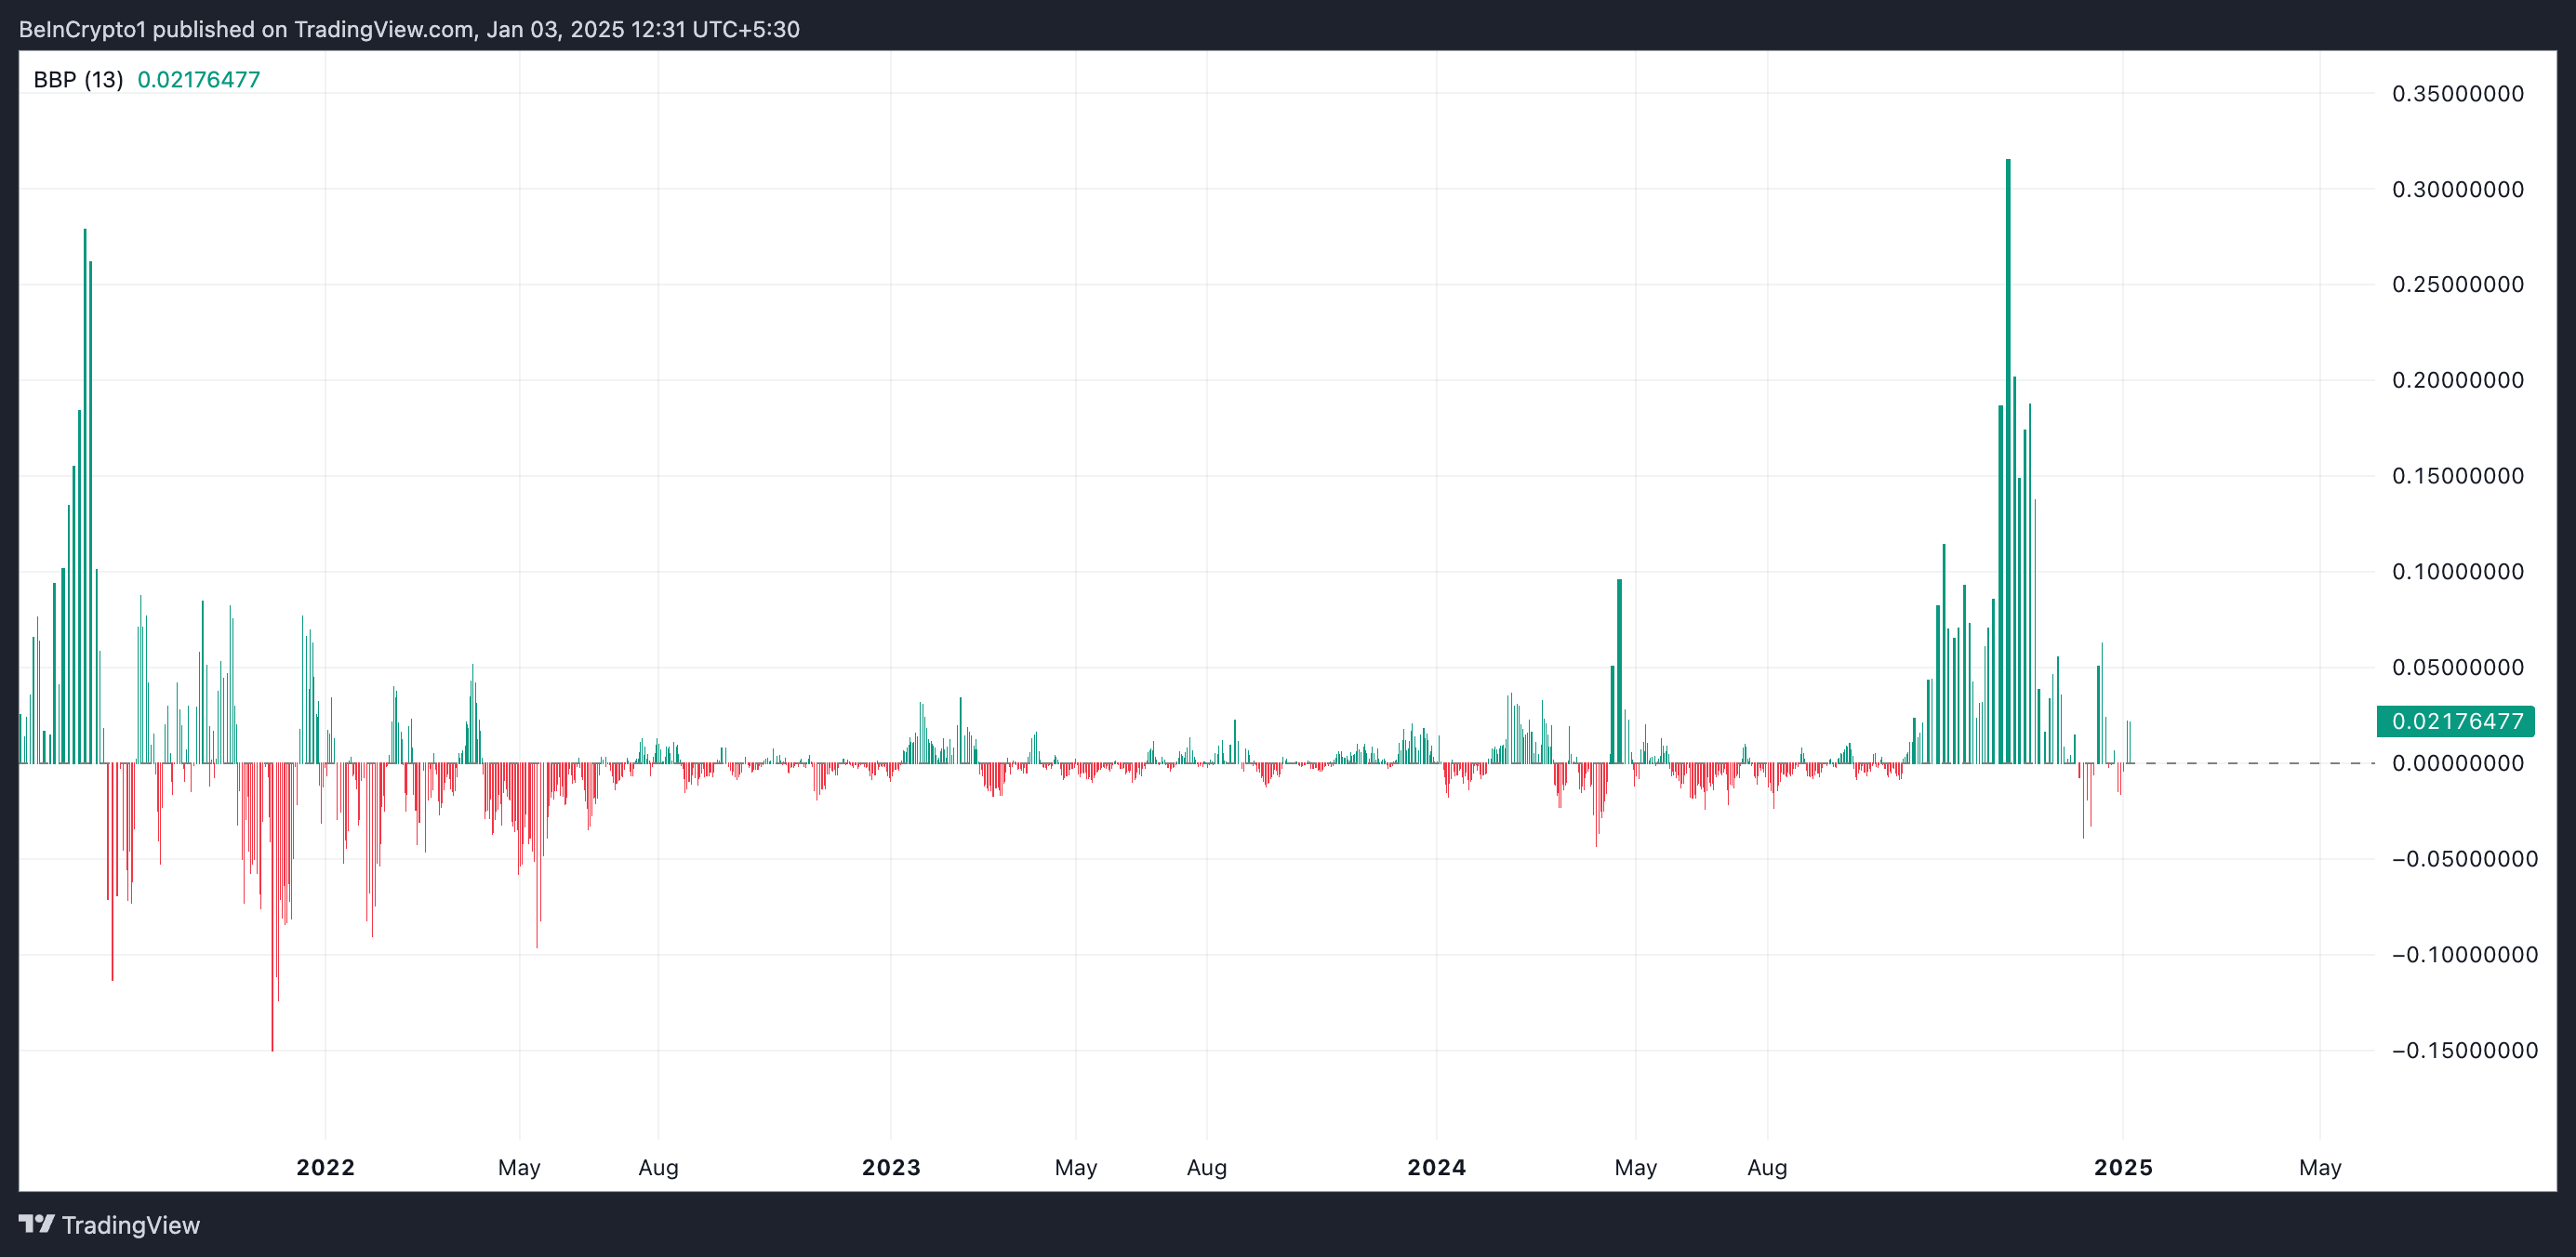
Moreover, positive readings from HBAR’s technical indicators further corroborate this surge in demand. For example, the value of its Elder-Ray Index indicates strengthening bull power. As of this writing, this stands at 0.021.
The Elder-Ray Index measures the strength of an asset’s bulls (buyers) and bears (sellers). As with HBAR, when its value is positive, it indicates that bulls are dominant, suggesting upward price momentum and a potential buying opportunity.
Notably, HBAR’s rising Relative Strength Index (RSI) confirms that its traders are taking advantage of this buying opportunity. As of this writing, the indicator is in an upward trend at 57.25, signaling a steady rise in demand for the altcoin.
The RSI measures an asset’s oversold and overbought market conditions. It ranges between 0 and 100, with values above 70 indicating that the asset is overbought and due for a price decline. Conversely, values below 30 suggest that the asset is oversold and may witness a rebound.
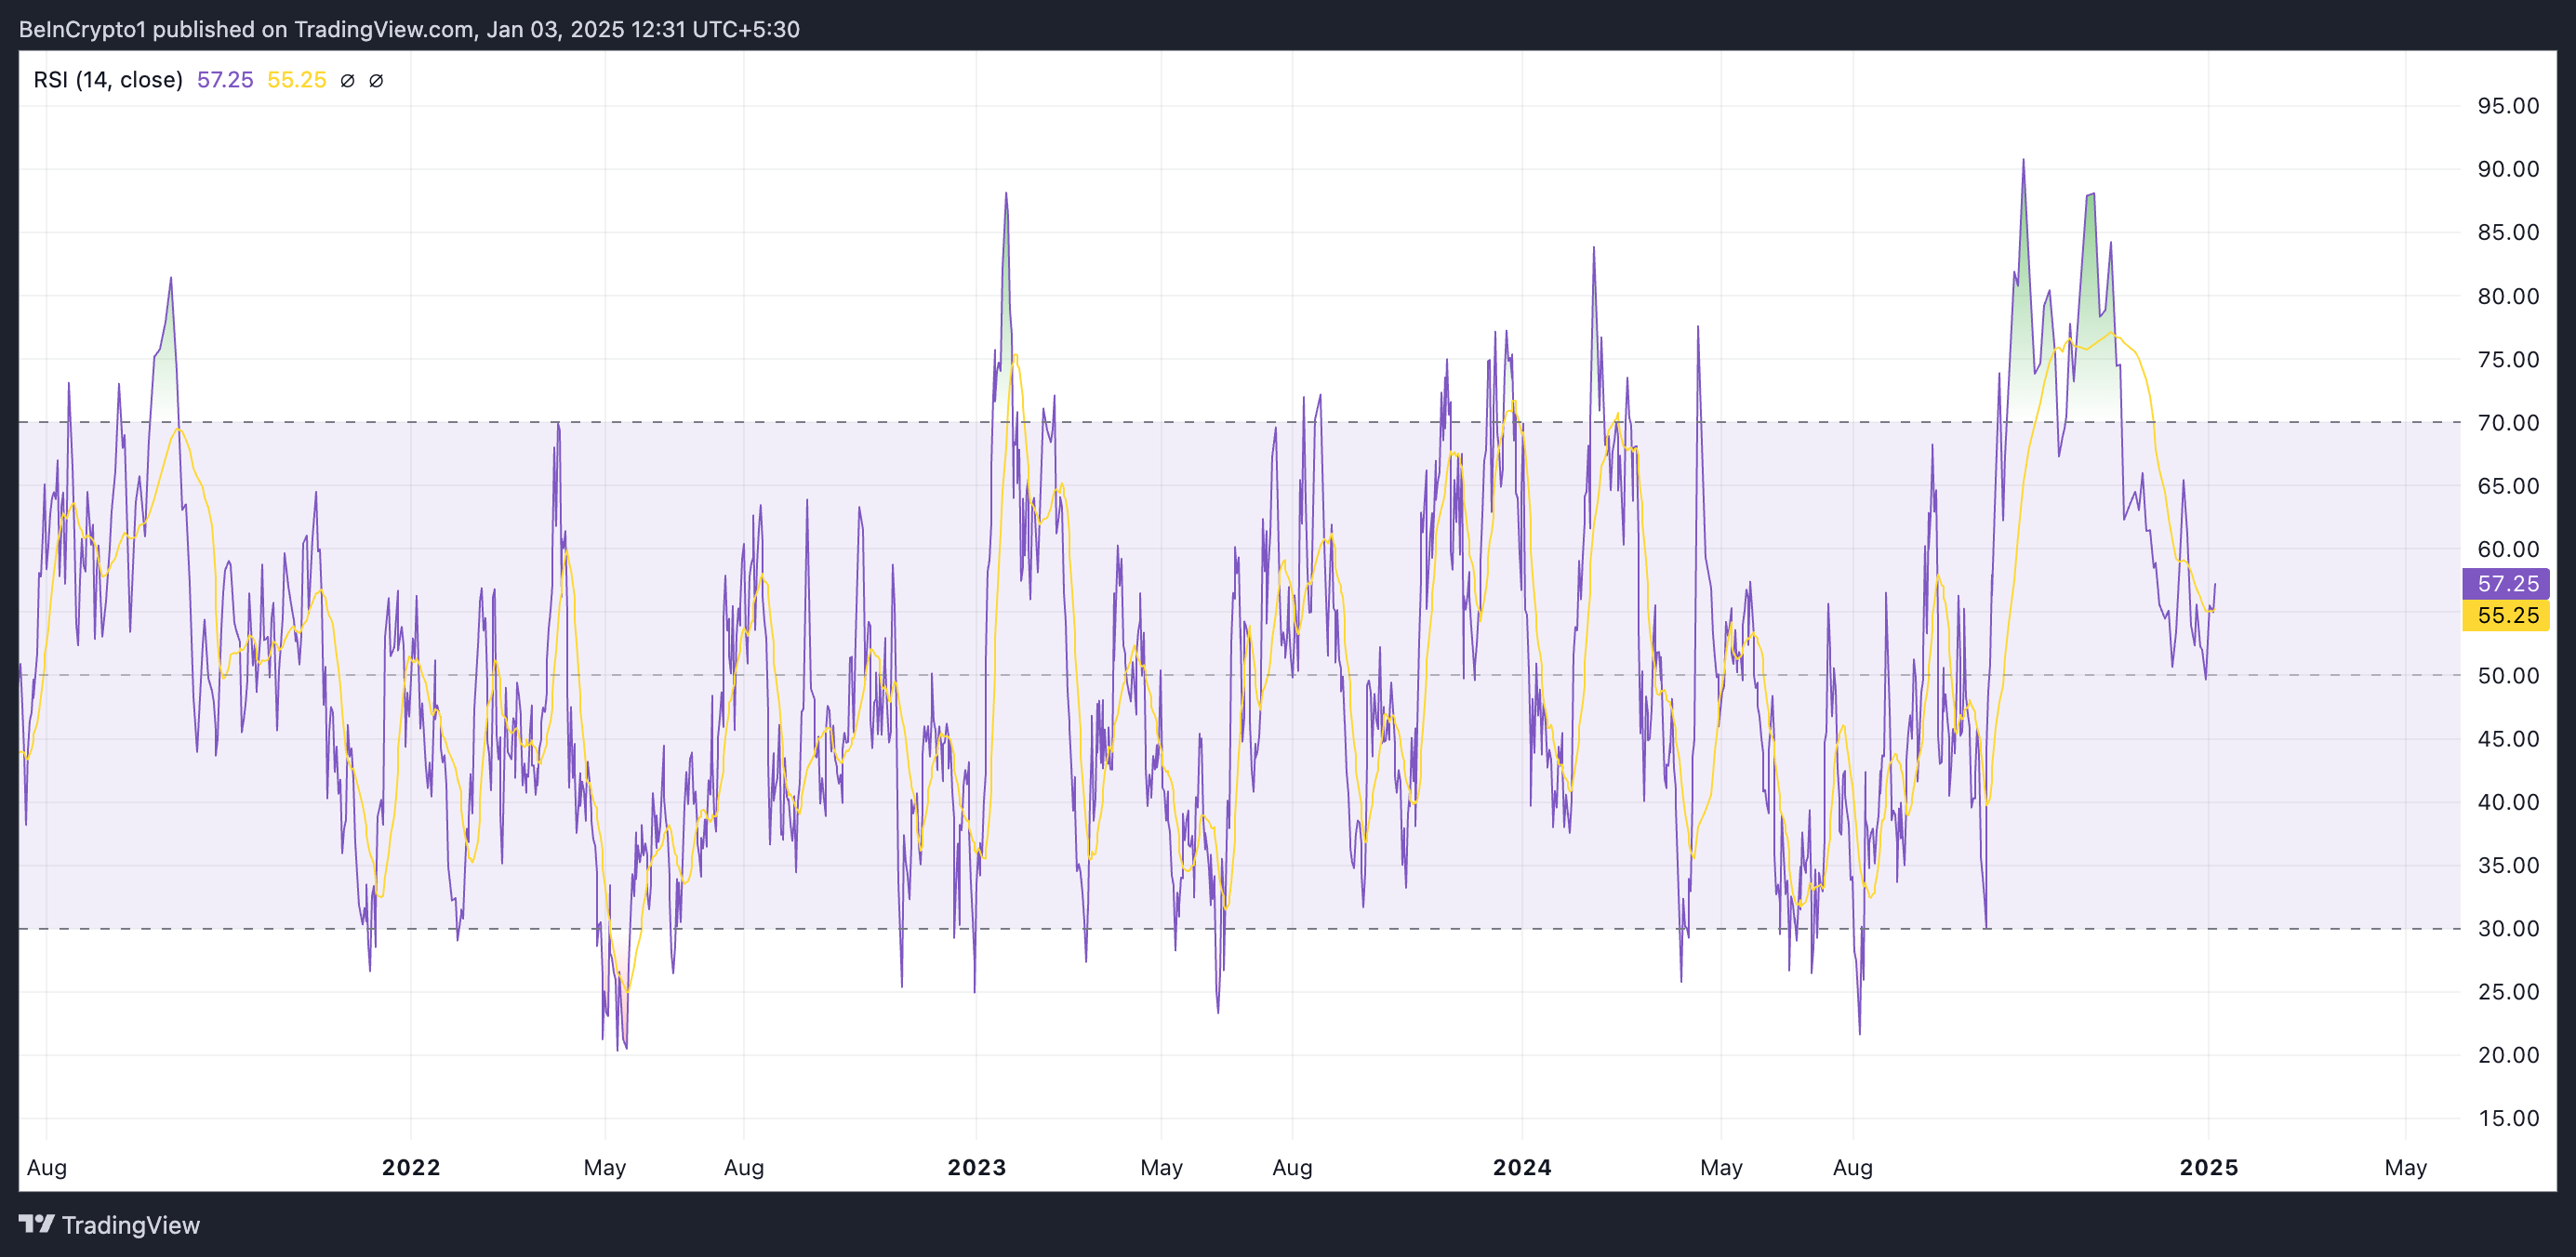
HBAR’s RSI reading of 57.25 indicates a moderately bullish trend, suggesting the altcoin is gaining strength but is not yet overbought. This signals that there is room for further price appreciation.
HBAR Price Prediction: Will Bulls Push it Toward $0.58 High?
HBAR currently trades at $0.29. If buying pressure gains momentum, the token’s price will revisit its multi-year peak of $0.38, which was last reached on December 3. A successful breach of this key resistance could pave the way for HBAR’s price to reclaim its all-time high of $0.58.
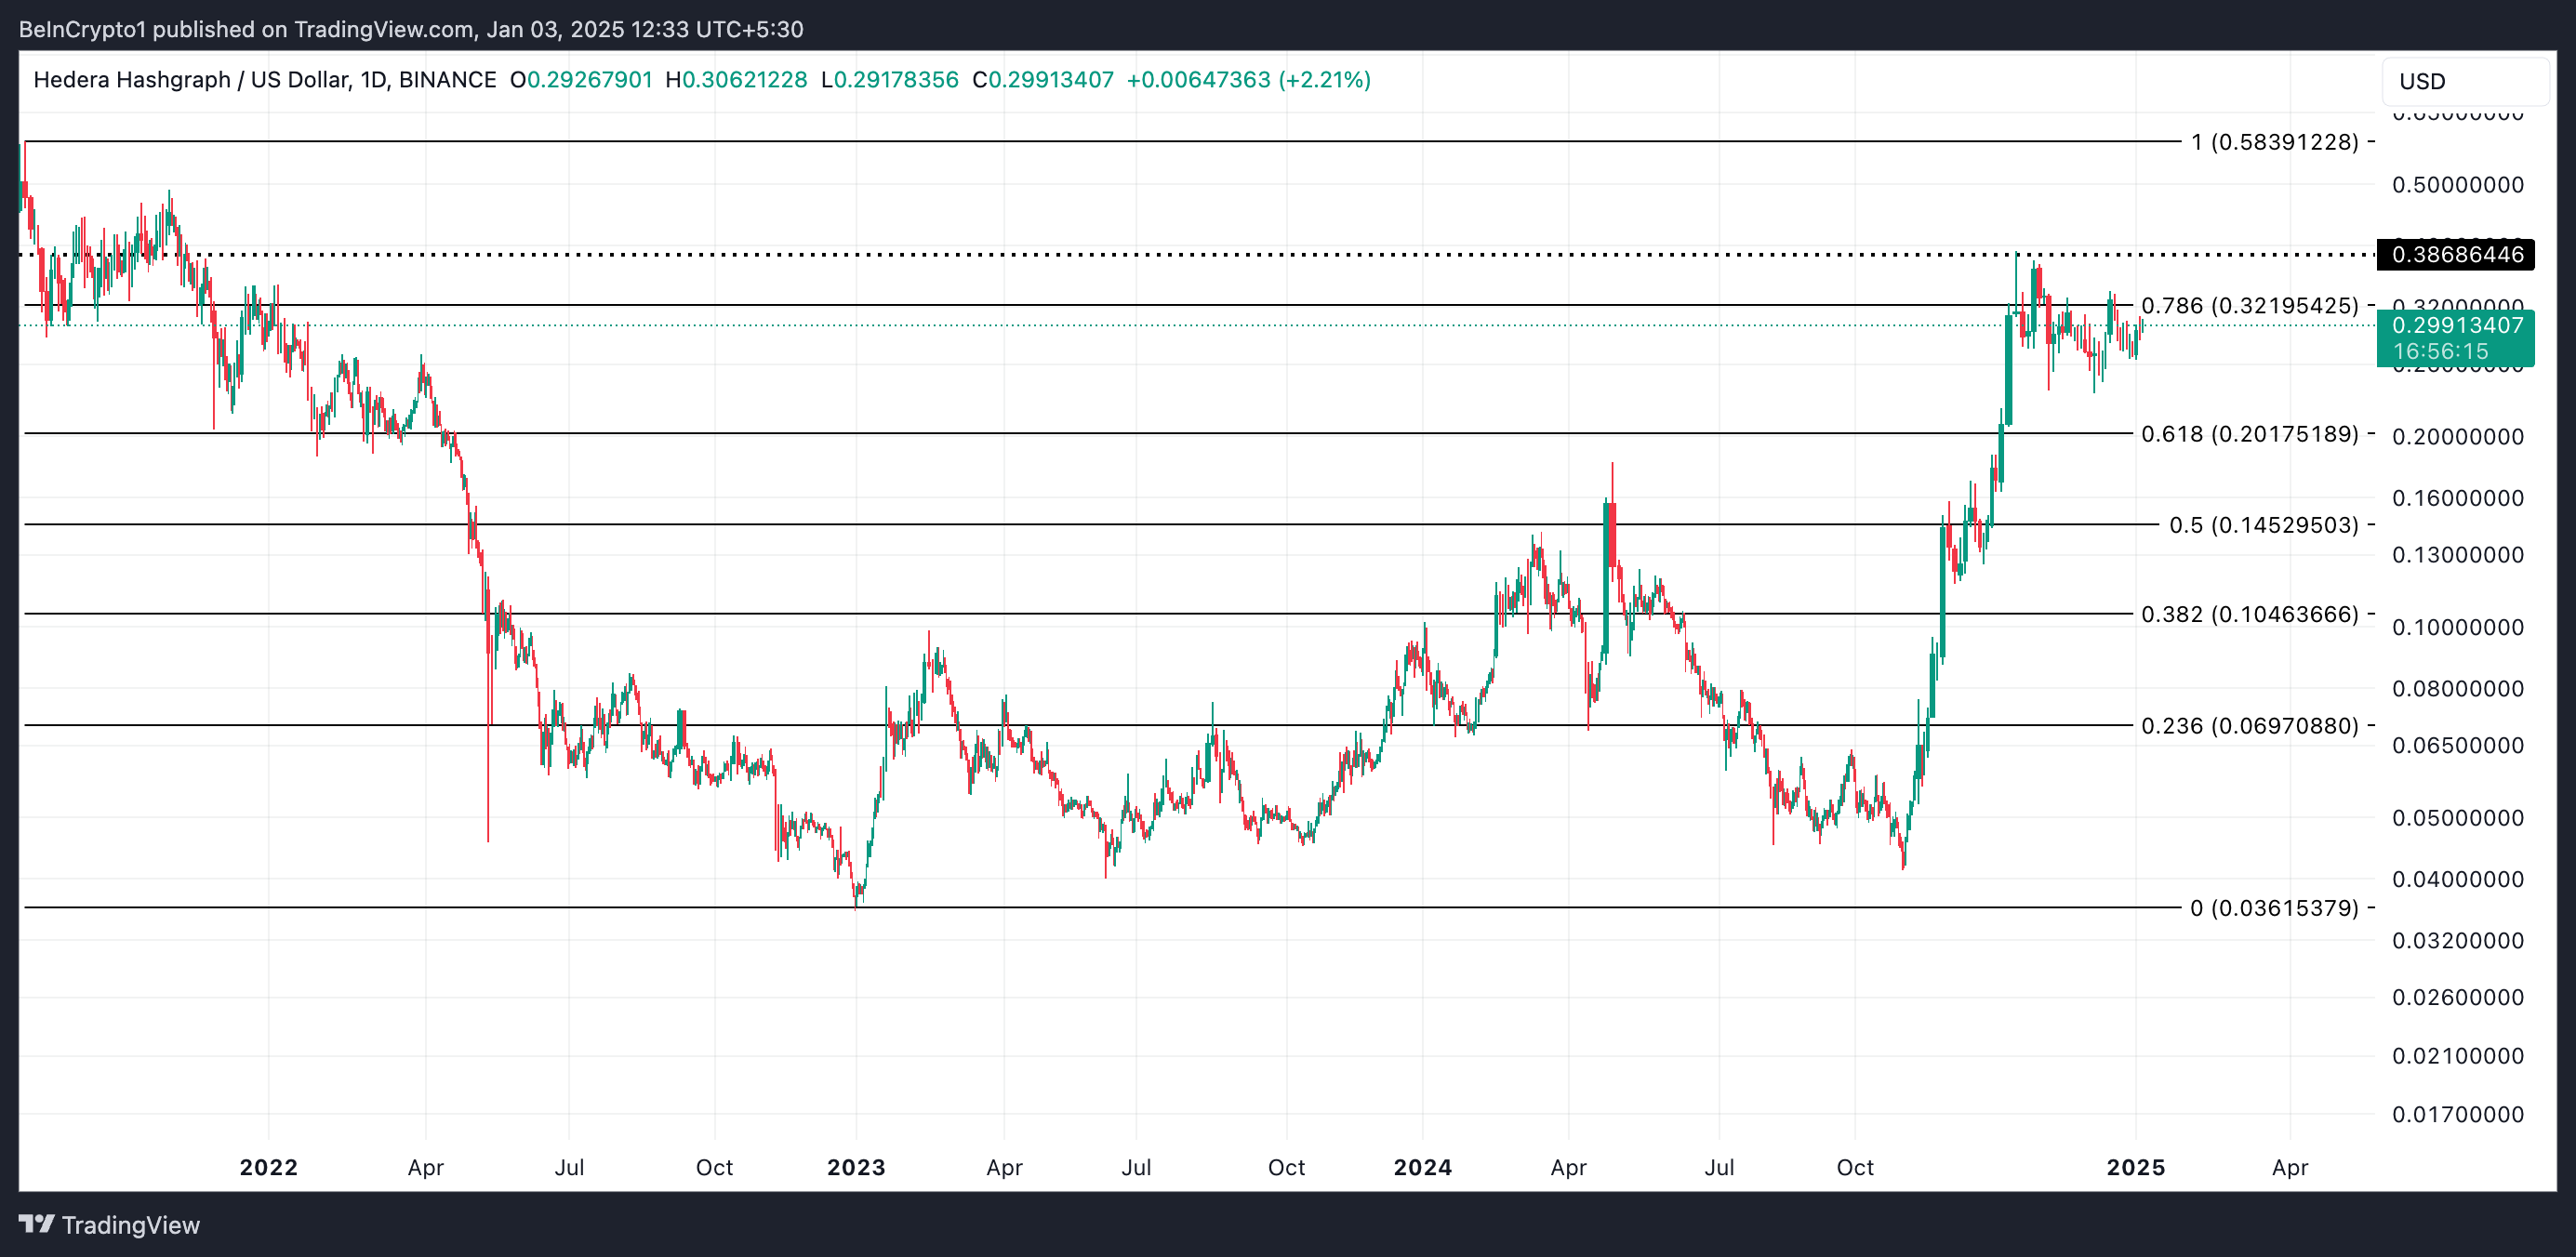
On the other hand, a failed attempt to breach the $0.38 resistance level will result in a downward trend. In that scenario, HBAR’s price may plunge toward $0.20.
Disclaimer
In line with the Trust Project guidelines, this price analysis article is for informational purposes only and should not be considered financial or investment advice. BeInCrypto is committed to accurate, unbiased reporting, but market conditions are subject to change without notice. Always conduct your own research and consult with a professional before making any financial decisions. Please note that our Terms and Conditions, Privacy Policy, and Disclaimers have been updated.
Source link
Abiodun Oladokun
https://beincrypto.com/hbar-rising-spot-inflows/
2025-01-03 08:30:00


