The ETH/BTC ratio, a metric measuring Ethereum’s price performance compared to Bitcoin, has reached its lowest point since March 2021. This development comes amid BTC’s brief rise to $98,000.
While the flagship cryptocurrency has increased by 7.45% in the last seven days, ETH has hovered around the same region, with investors raising concerns about the altcoin’s future.
Ethereum Continues to Lag Behind Bitcoin
In February, the ETH/BTC ratio climbed to a yearly high of 0.060. During that time, speculation spread that Ethereum’s price would begin to outperform Bitcoin and validate the altcoin season. However, that has not happened, as Bitcoin’s price has continued to make new highs
Ethereum, on the other hand, is yet to retest to reclaim its all-time high despite reaching $4,000 earlier in the year. This disparity in performance could be linked to several factors. For instance, both cryptocurrencies saw approval for exchange-traded funds (ETFs) this year.
However, while Bitcoin has seen billions of dollars in inflows, ETH has been inconsistent in attracting capital. Hence, the institutional inflow has driven BTC toward $100,000, ensuring that the ETH/BTC ratio drops to $0.033 — the lowest level in 42 months.
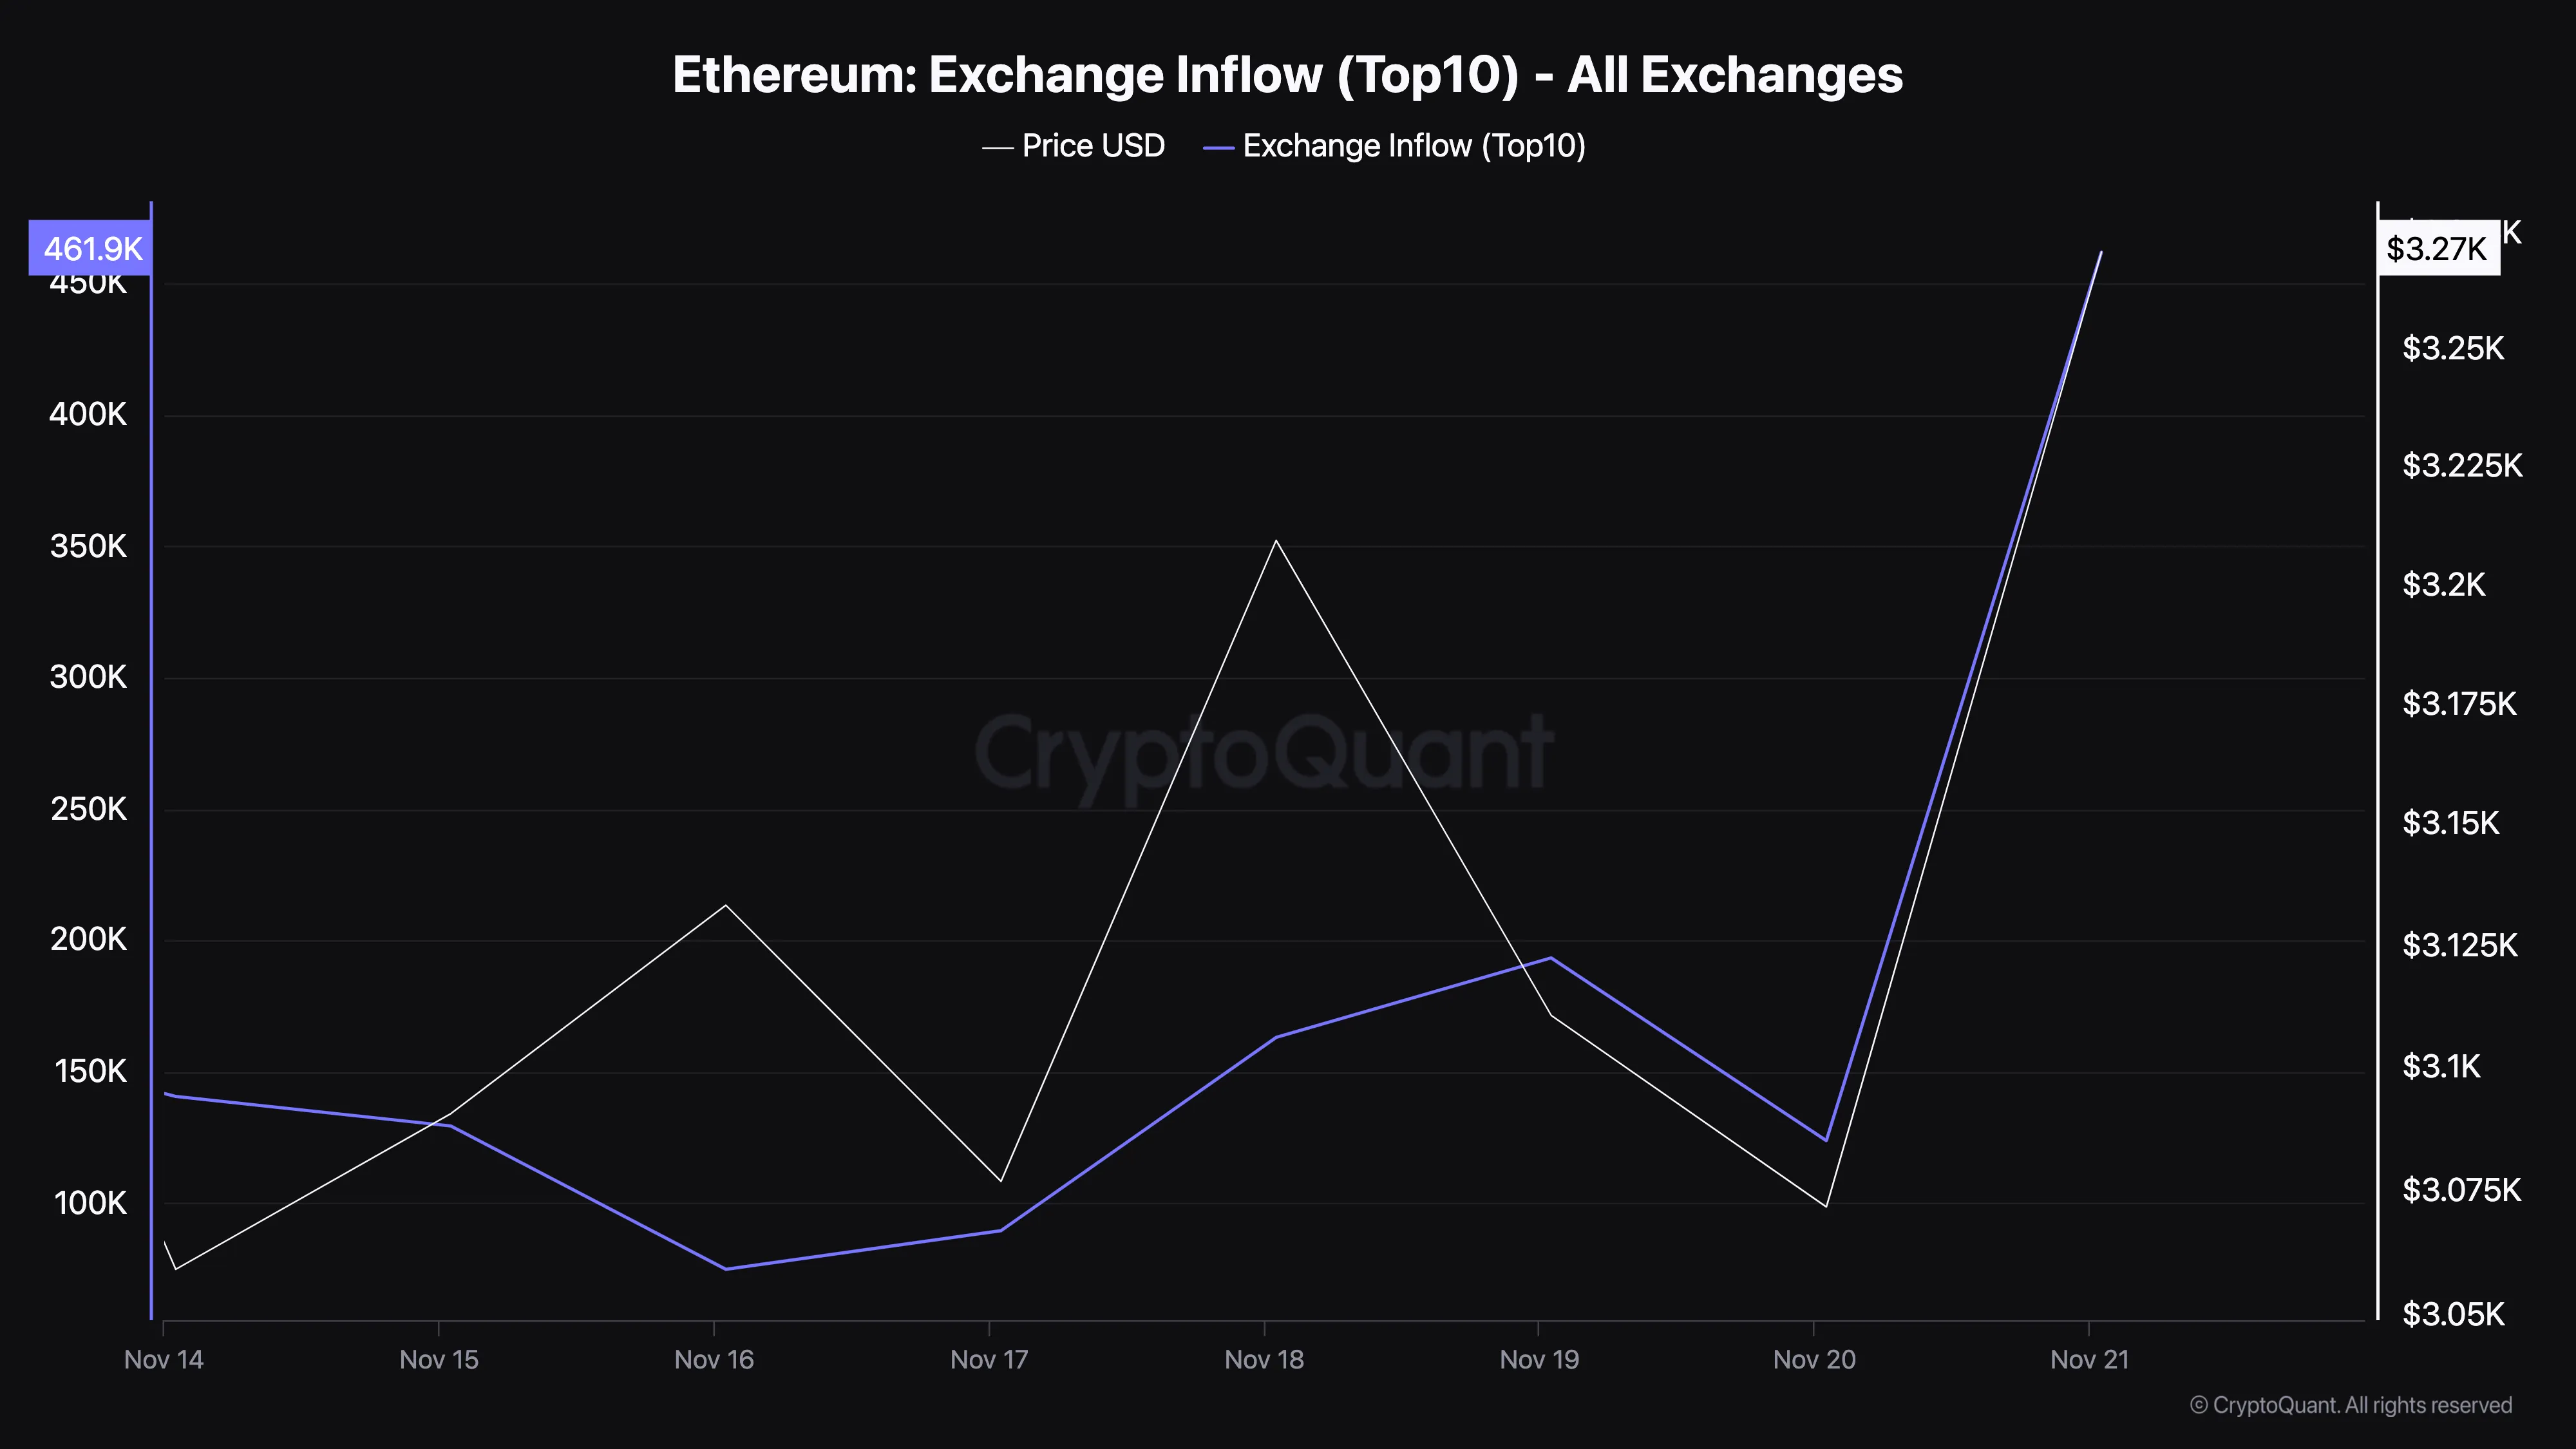
Further, the disparity in Ethereum’s performance can largely be attributed to sustained selling pressure. For instance, CryptoQuant data reveals that exchange inflows into the top 10 exchanges have climbed to 461,901 ETH, valued at approximately $1.50 billion as of this writing.
This surge in exchange inflow reflects large deposits by investors, indicating a heightened willingness to sell. Such movements typically increase the supply of ETH on exchanges, raising the likelihood of a price drop.
In contrast, a low exchange inflow generally indicates that investors are holding onto their assets, which is not the current scenario for ETH.
ETH Price Prediction: Crypto Could Retrace
As of this writing, ETH trades at $3,317, which is a higher close than yesterday’s. Despite that, the altcoin is still below the Parabolic Stop And Reverse (SAR) indicator. The Parabolic SAR generates a series of dots that track the price movement, positioning above the price during a downtrend and below the price during an uptrend.
A “flip” in the dots — shifting from one side to the other — often signals a potential trend reversal. As seen below, the indicator is above ETH’s price, suggesting that the cryptocurrency could reverse its recent gains.
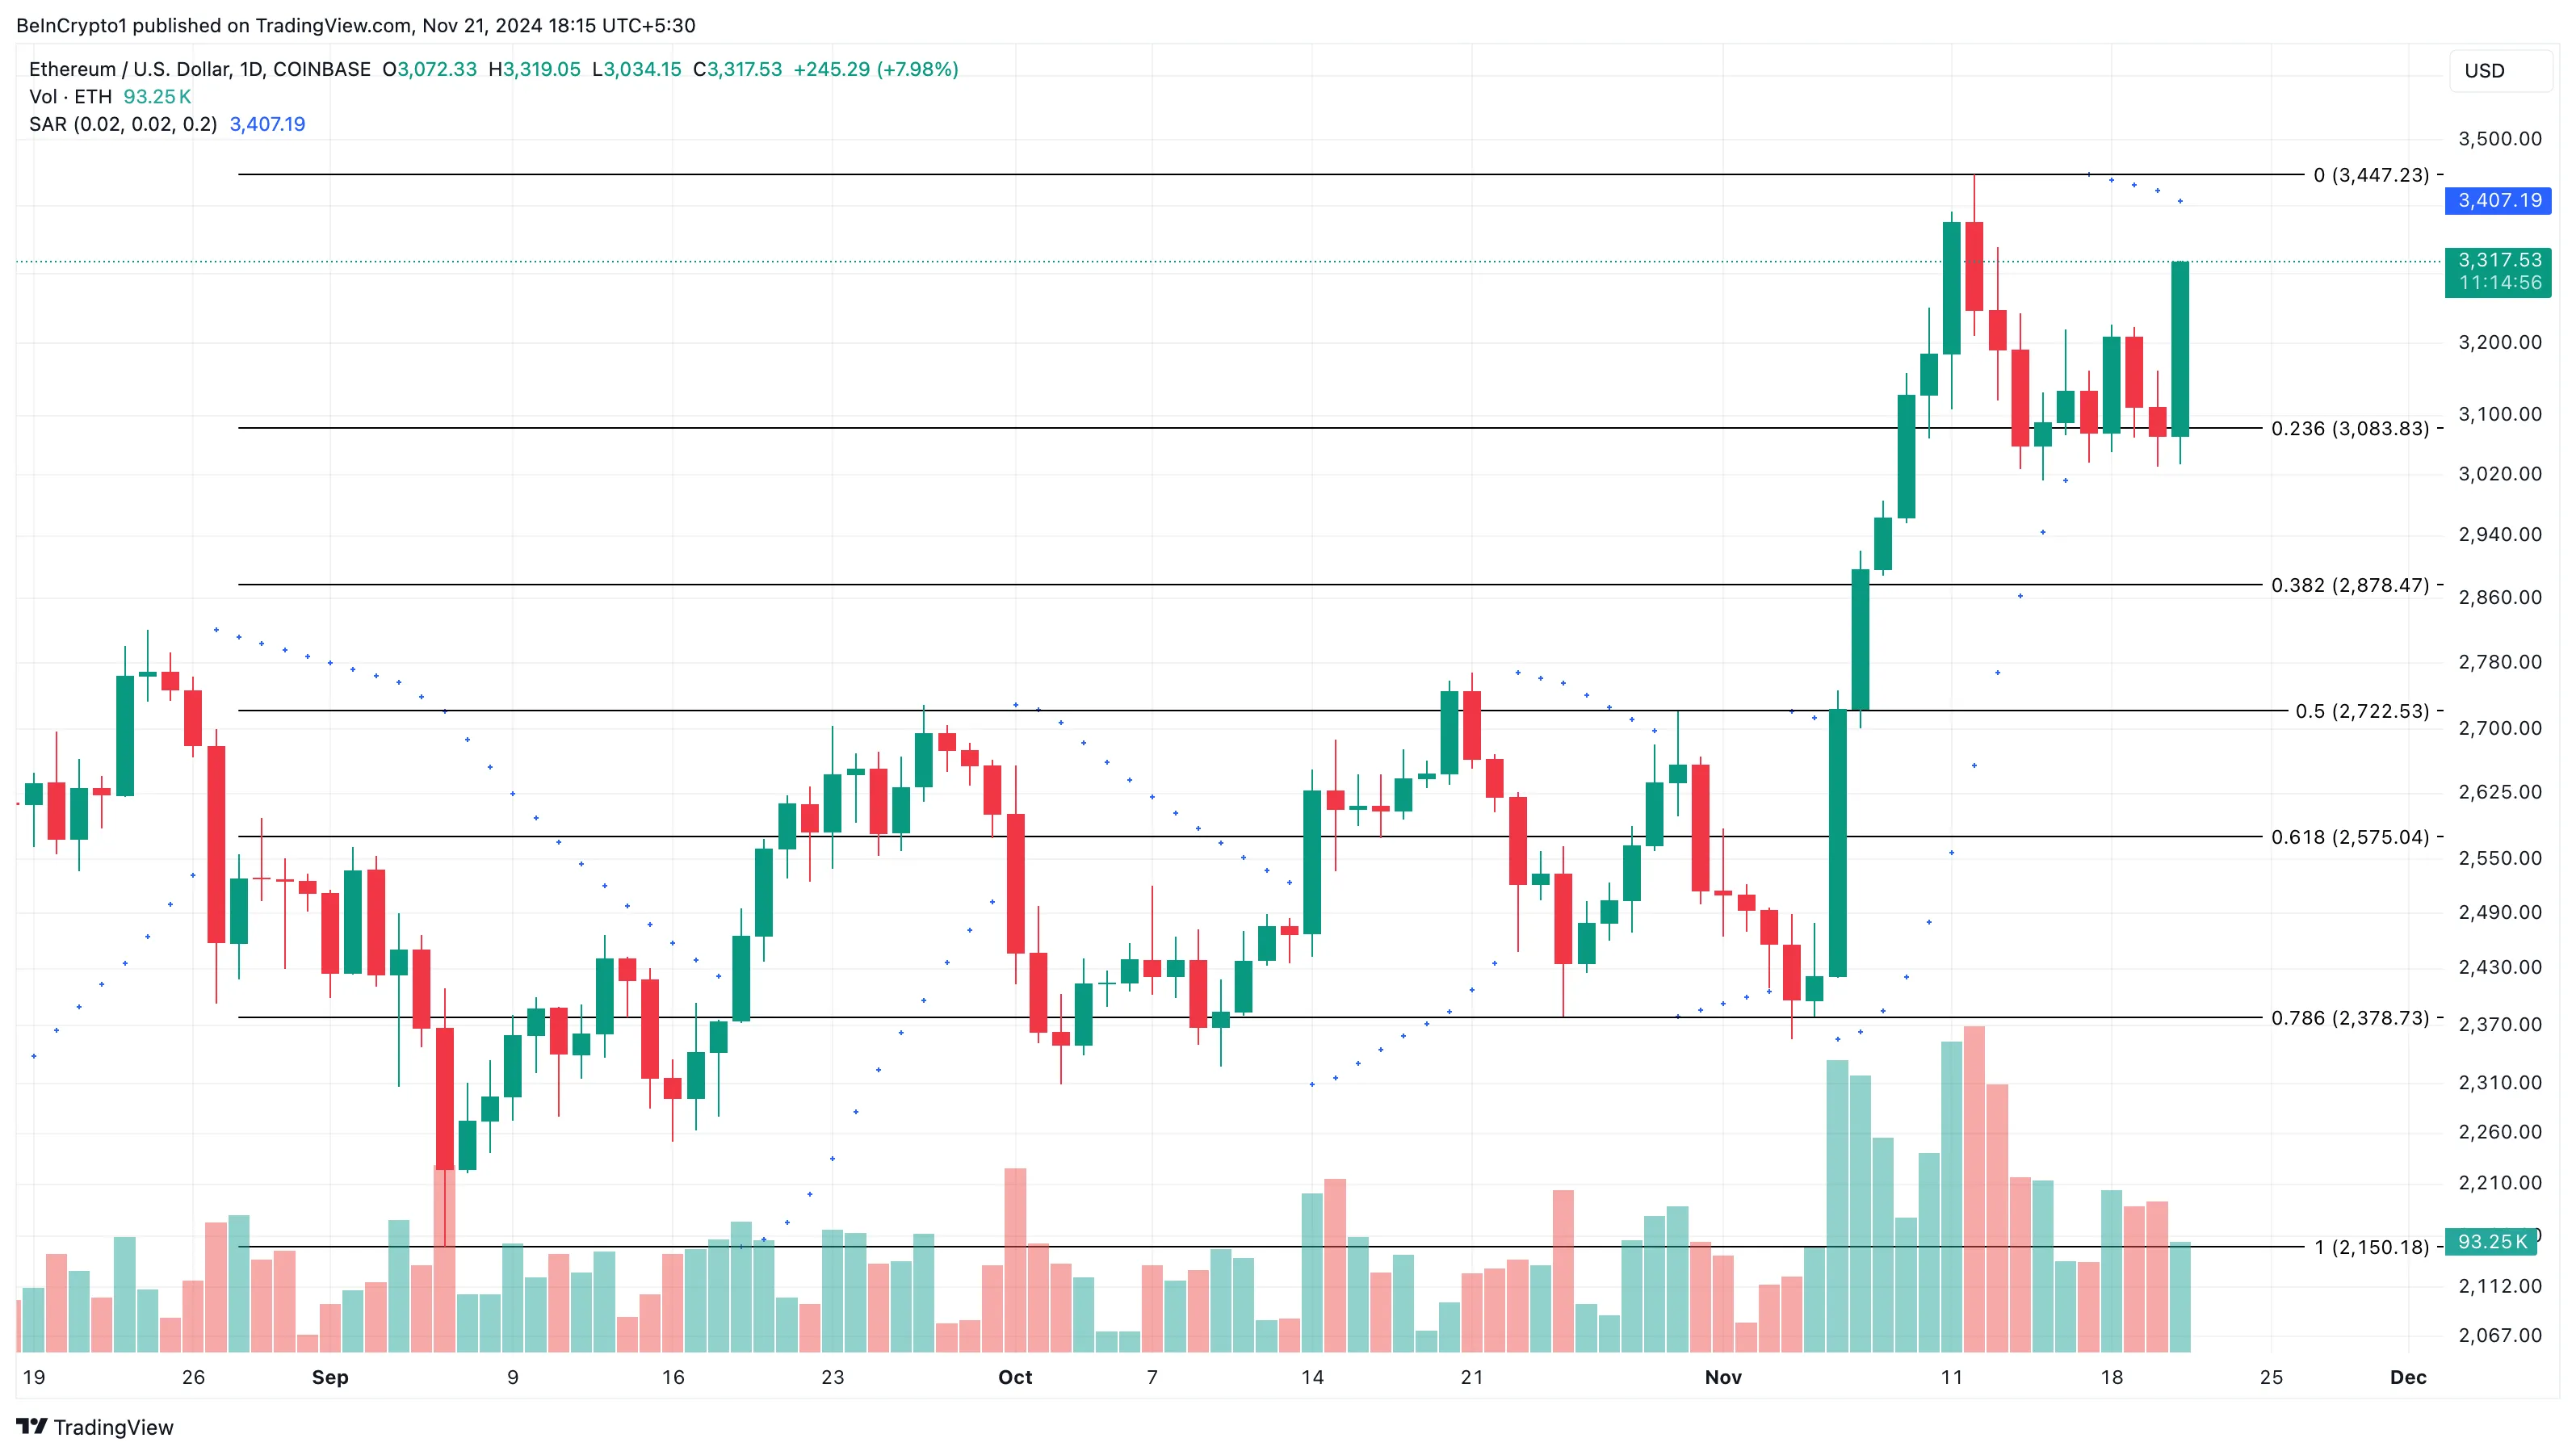
If this is the case and the ETH/BTC ratio declines, Ethereum’s price could decline to $3,083. However, if buying pressure increases, that might not happen. Instead, the value could surge above $3,500 and toward 4,000.
Disclaimer
In line with the Trust Project guidelines, this price analysis article is for informational purposes only and should not be considered financial or investment advice. BeInCrypto is committed to accurate, unbiased reporting, but market conditions are subject to change without notice. Always conduct your own research and consult with a professional before making any financial decisions. Please note that our Terms and Conditions, Privacy Policy, and Disclaimers have been updated.
Source link
Victor Olanrewaju
https://beincrypto.com/eth-btc-ratio-sinks-to-lowest/
2024-11-21 15:30:00

