
Ethereum has been facing significant resistance at the $2.8K level, which marks the lower boundary of a multi-month wedge pattern.
The price action suggests that it might be completing a pullback, potentially driving the price down toward the $2.1K threshold.
By Shayan
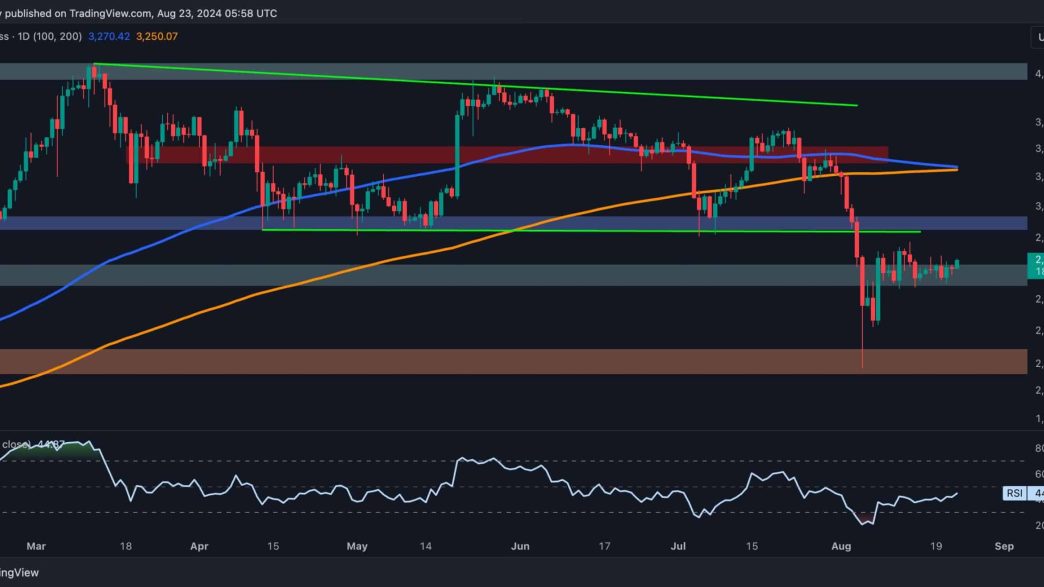
The Daily Chart
Ethereum has been grappling with the multi-month wedge’s lower boundary at $2.8K for several weeks, suggesting a possible pullback completion.
After retracing toward this key resistance level, the price has entered a period of slight consolidation, reflecting insufficient market demand. The low-volatility action near this resistance suggests that the pullback might be nearing its end.
Given the significant supply pressure around the $2.8K mark, a rejection could lead to a decline toward the critical $2.1K support region.
Additionally, the 100-day moving average is approaching a crossover below the 200-day moving average at $3.2K, potentially forming a “death cross.” This pattern often signals a bearish market outlook, further supporting the expectation of rejection at $2.8K and a subsequent price drop.
The 4-Hour Chart
On the 4-hour chart, Ethereum has entered a crucial range between the 0.5 ($2.6K) and 0.618 ($2.7K) Fibonacci levels after consolidating near the $2.8K resistance.
The price is facing strong selling pressure, struggling to break through this critical resistance with little bullish momentum.
Currently, ETH is testing the lower boundary of the wedge pattern. If selling pressure intensifies and the price breaks below this boundary, it could confirm the continuation of the bearish trend, targeting the $2.1K support level.
Close monitoring of the price action in the coming days will be essential, as the potential for a deeper correction remains high.

By Shayan
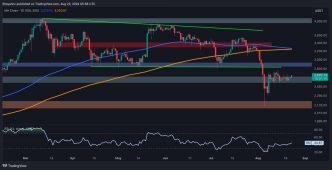
Analyzing futures market metrics for Ethereum provides valuable insights that complement traditional price analysis.
This chart highlights the Taker Buy Sell Ratio, one of the most significant futures market indicators. It measures the aggregate aggressiveness of buyers versus sellers in executing orders.
Recently, the Taker Buy Sell Ratio plummeted to its lowest level in months, signaling substantial selling pressure in the market. However, the metric has since begun to recover, showing a slight uptick.
This suggests that buyers are attempting to push Ethereum’s price above the critical $2.8K resistance level. If this upward trend in the ratio continues, the current retracement phase may extend in the short term.

Binance Free $600 (CryptoPotato Exclusive): Use this link to register a new account and receive $600 exclusive welcome offer on Binance (full details).
LIMITED OFFER 2024 at BYDFi Exchange: Up to $2,888 welcome reward, use this link to register and open a 100 USDT-M position for free!
Disclaimer: Information found on CryptoPotato is those of writers quoted. It does not represent the opinions of CryptoPotato on whether to buy, sell, or hold any investments. You are advised to conduct your own research before making any investment decisions. Use provided information at your own risk. See Disclaimer for more information.
Cryptocurrency charts by TradingView.
Source link
George Georgiev
https://cryptopotato.com/ethereum-price-analysis-eth-lags-behind-as-pullback-to-2-1k-becomes-possible/
2024-08-23 16:09:00


