Ethereum (ETH) spot exchange-traded funds (ETFs) have witnessed a significant outflow of $163 million this week. This comes as the bullish sentiment trailing the leading altcoin begins to wane, making it a struggle for the coin’s price to break through the $3,400 resistance level.
As ETH’s price faces bearish pressure, it may begin to shed more of its gains in the coming weeks. This analysis explains why.
Ethereum Buying Pressure Faces Dip
According to data from SosoValue, Ethereum ETF outflows this week have totaled $163 million. This represents the third-highest weekly net outflows since these funds became tradeable on July 23.
Notably, this trend of Ethereum ETF outflows follows a remarkable surge in inflows, which hit a record-breaking $515.17 million in weekly inflows — the highest since their launch. This spike in inflows was fueled by Donald Trump’s victory in the November 5 US election, which triggered a parabolic rally in the crypto market.
However, ETH’s price has begun to struggle as bearish sentiment against it gains momentum. BeInCrypto reported earlier that the ETH/BTC ratio, which measures Ethereum’s price performance against Bitcoin, has fallen to its lowest point since March 2021. This comes as profit-taking activity intensifies among the altcoin holders, paving the way for the bears to regain market control.
Moreover, Ethereum’s falling Aroon Up Line confirms the weakening bullish presence in the market. At press time, the coin’s Aroon Up Line is downward at 28.57%.
The Aroon indicator identifies trends and their strength. It consists of two lines: Aroon Up and Aroon Down. Aroon Up measures the time since a new 25-period high, while Aroon Down measures the time since a new 25-period low.
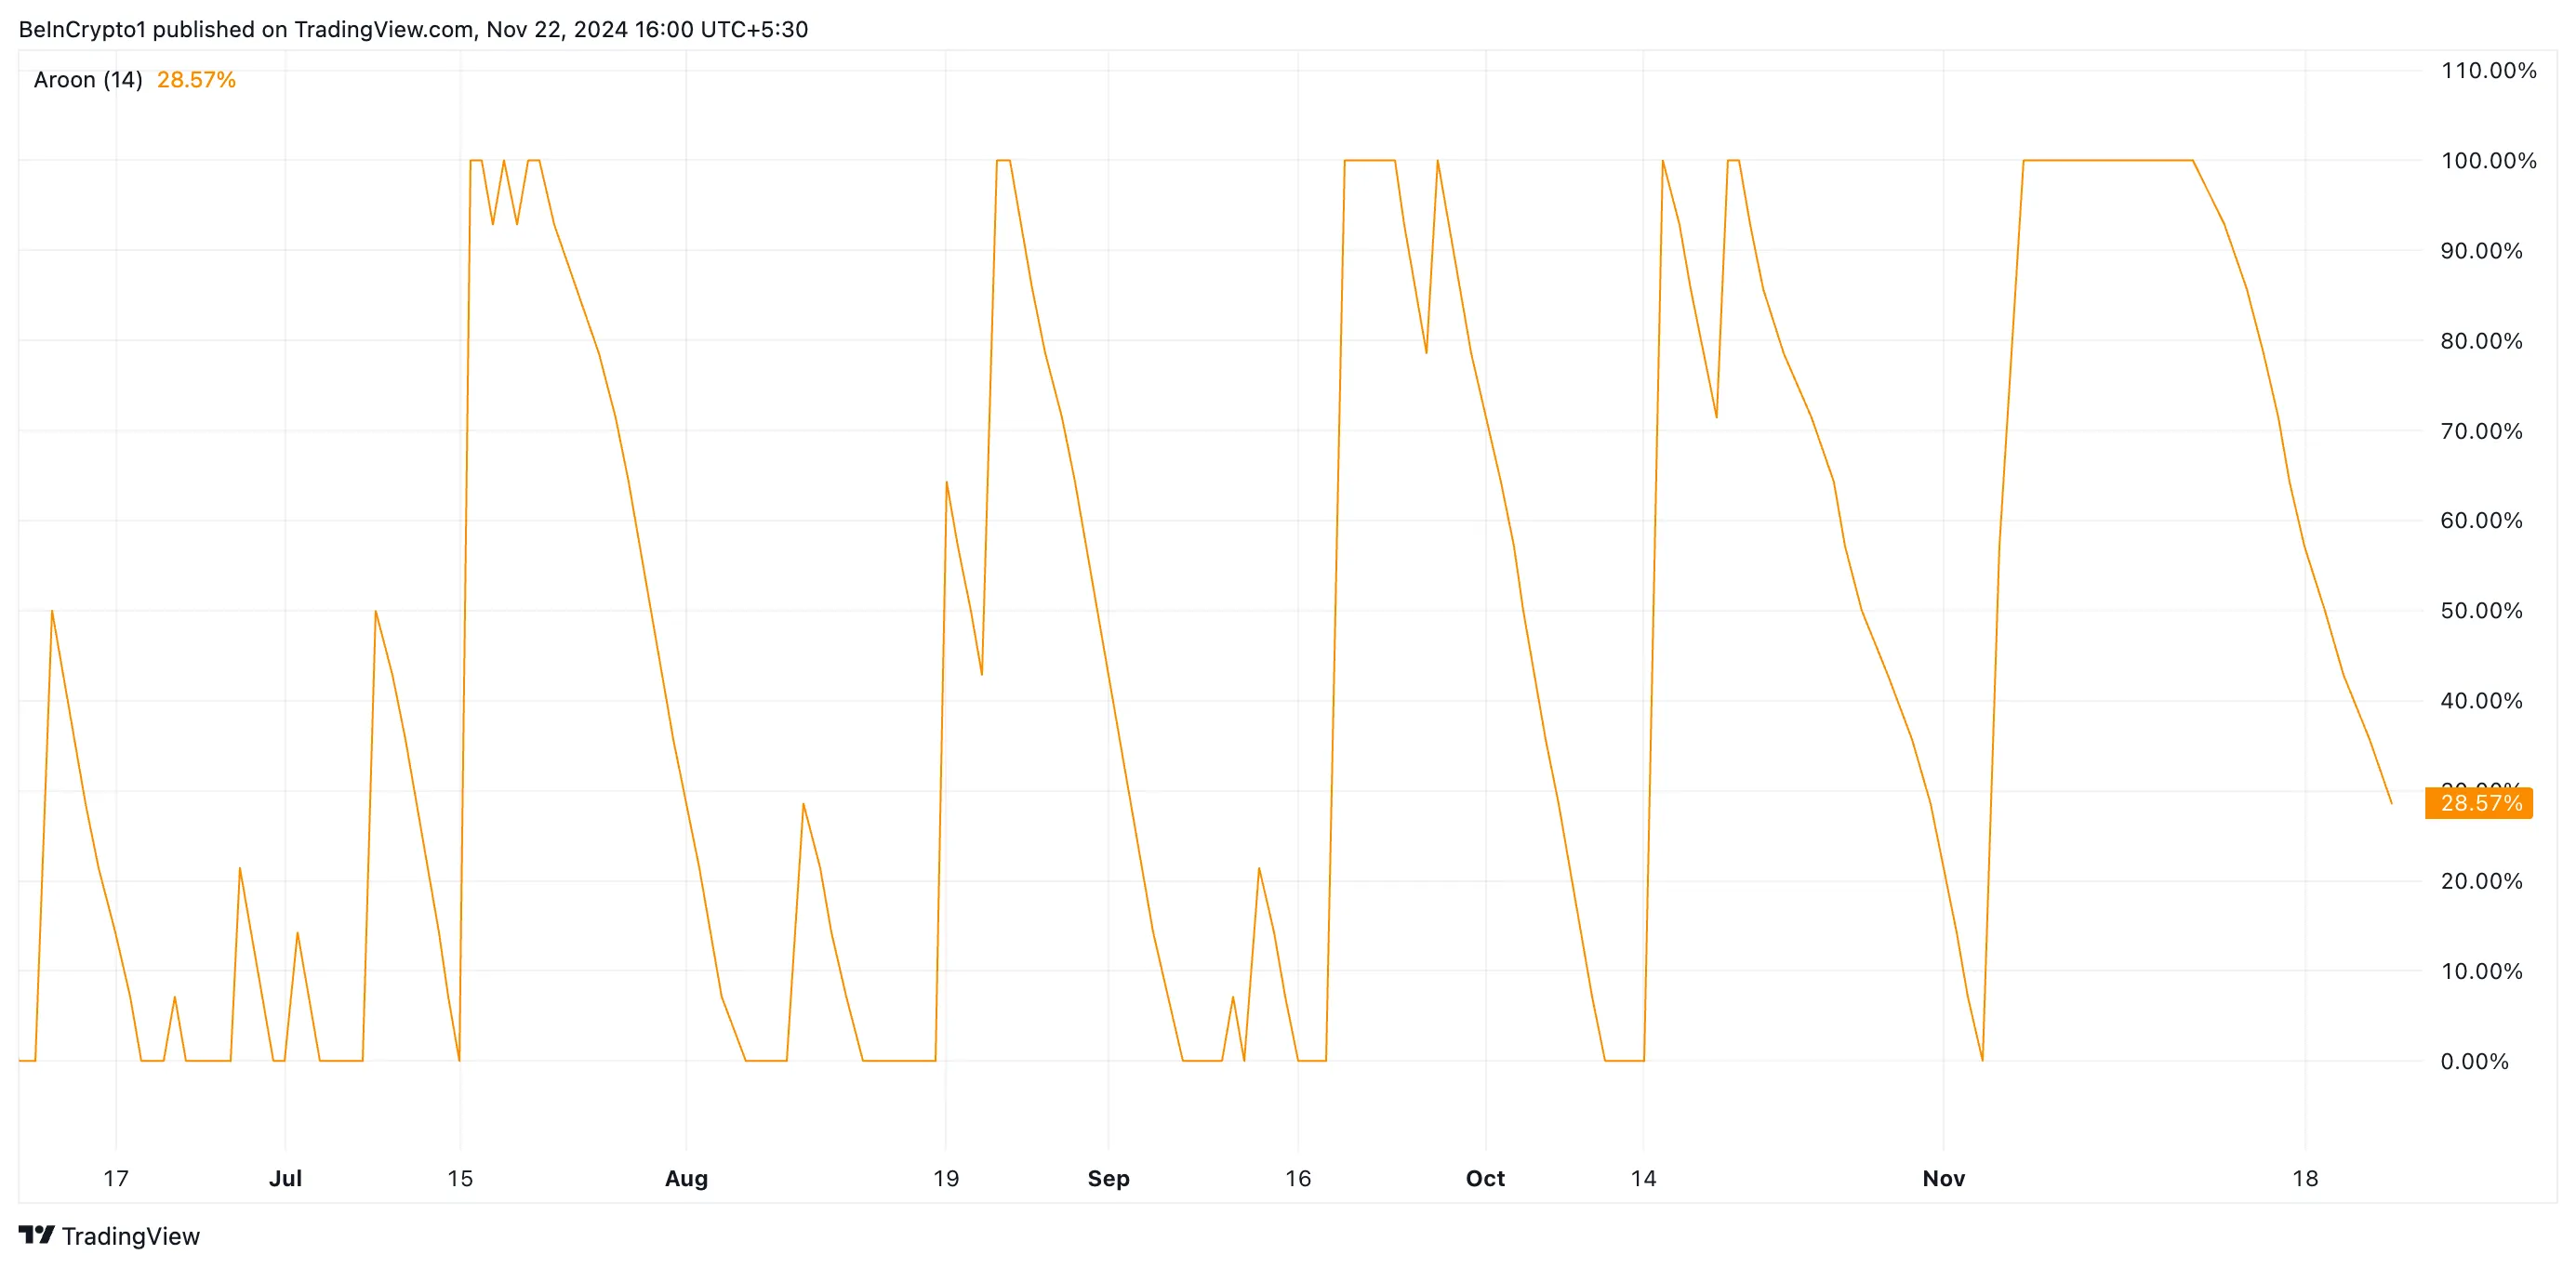
When the Aroon Up Line falls, it signals a weakening uptrend or the potential for a trend reversal. This occurs when the price is taking longer to reach new highs, indicating a loss of momentum. A falling Aroon Up line is interpreted as a bearish signal, suggesting that the bullish momentum is fading and a potential downtrend may be underway.
ETH Price Prediction: Is a Bull Flag Forming?
Interestingly, an assessment of the ETH/USD one-day chart has revealed that a bull flag may be underway. This pattern often precedes a continuation of an uptrend.
A bull flag consists of a rapid price increase (the flagpole) followed by a period of consolidation (the flag). Once the price breaks above the flag’s resistance level, it signals a potential resumption of the uptrend.
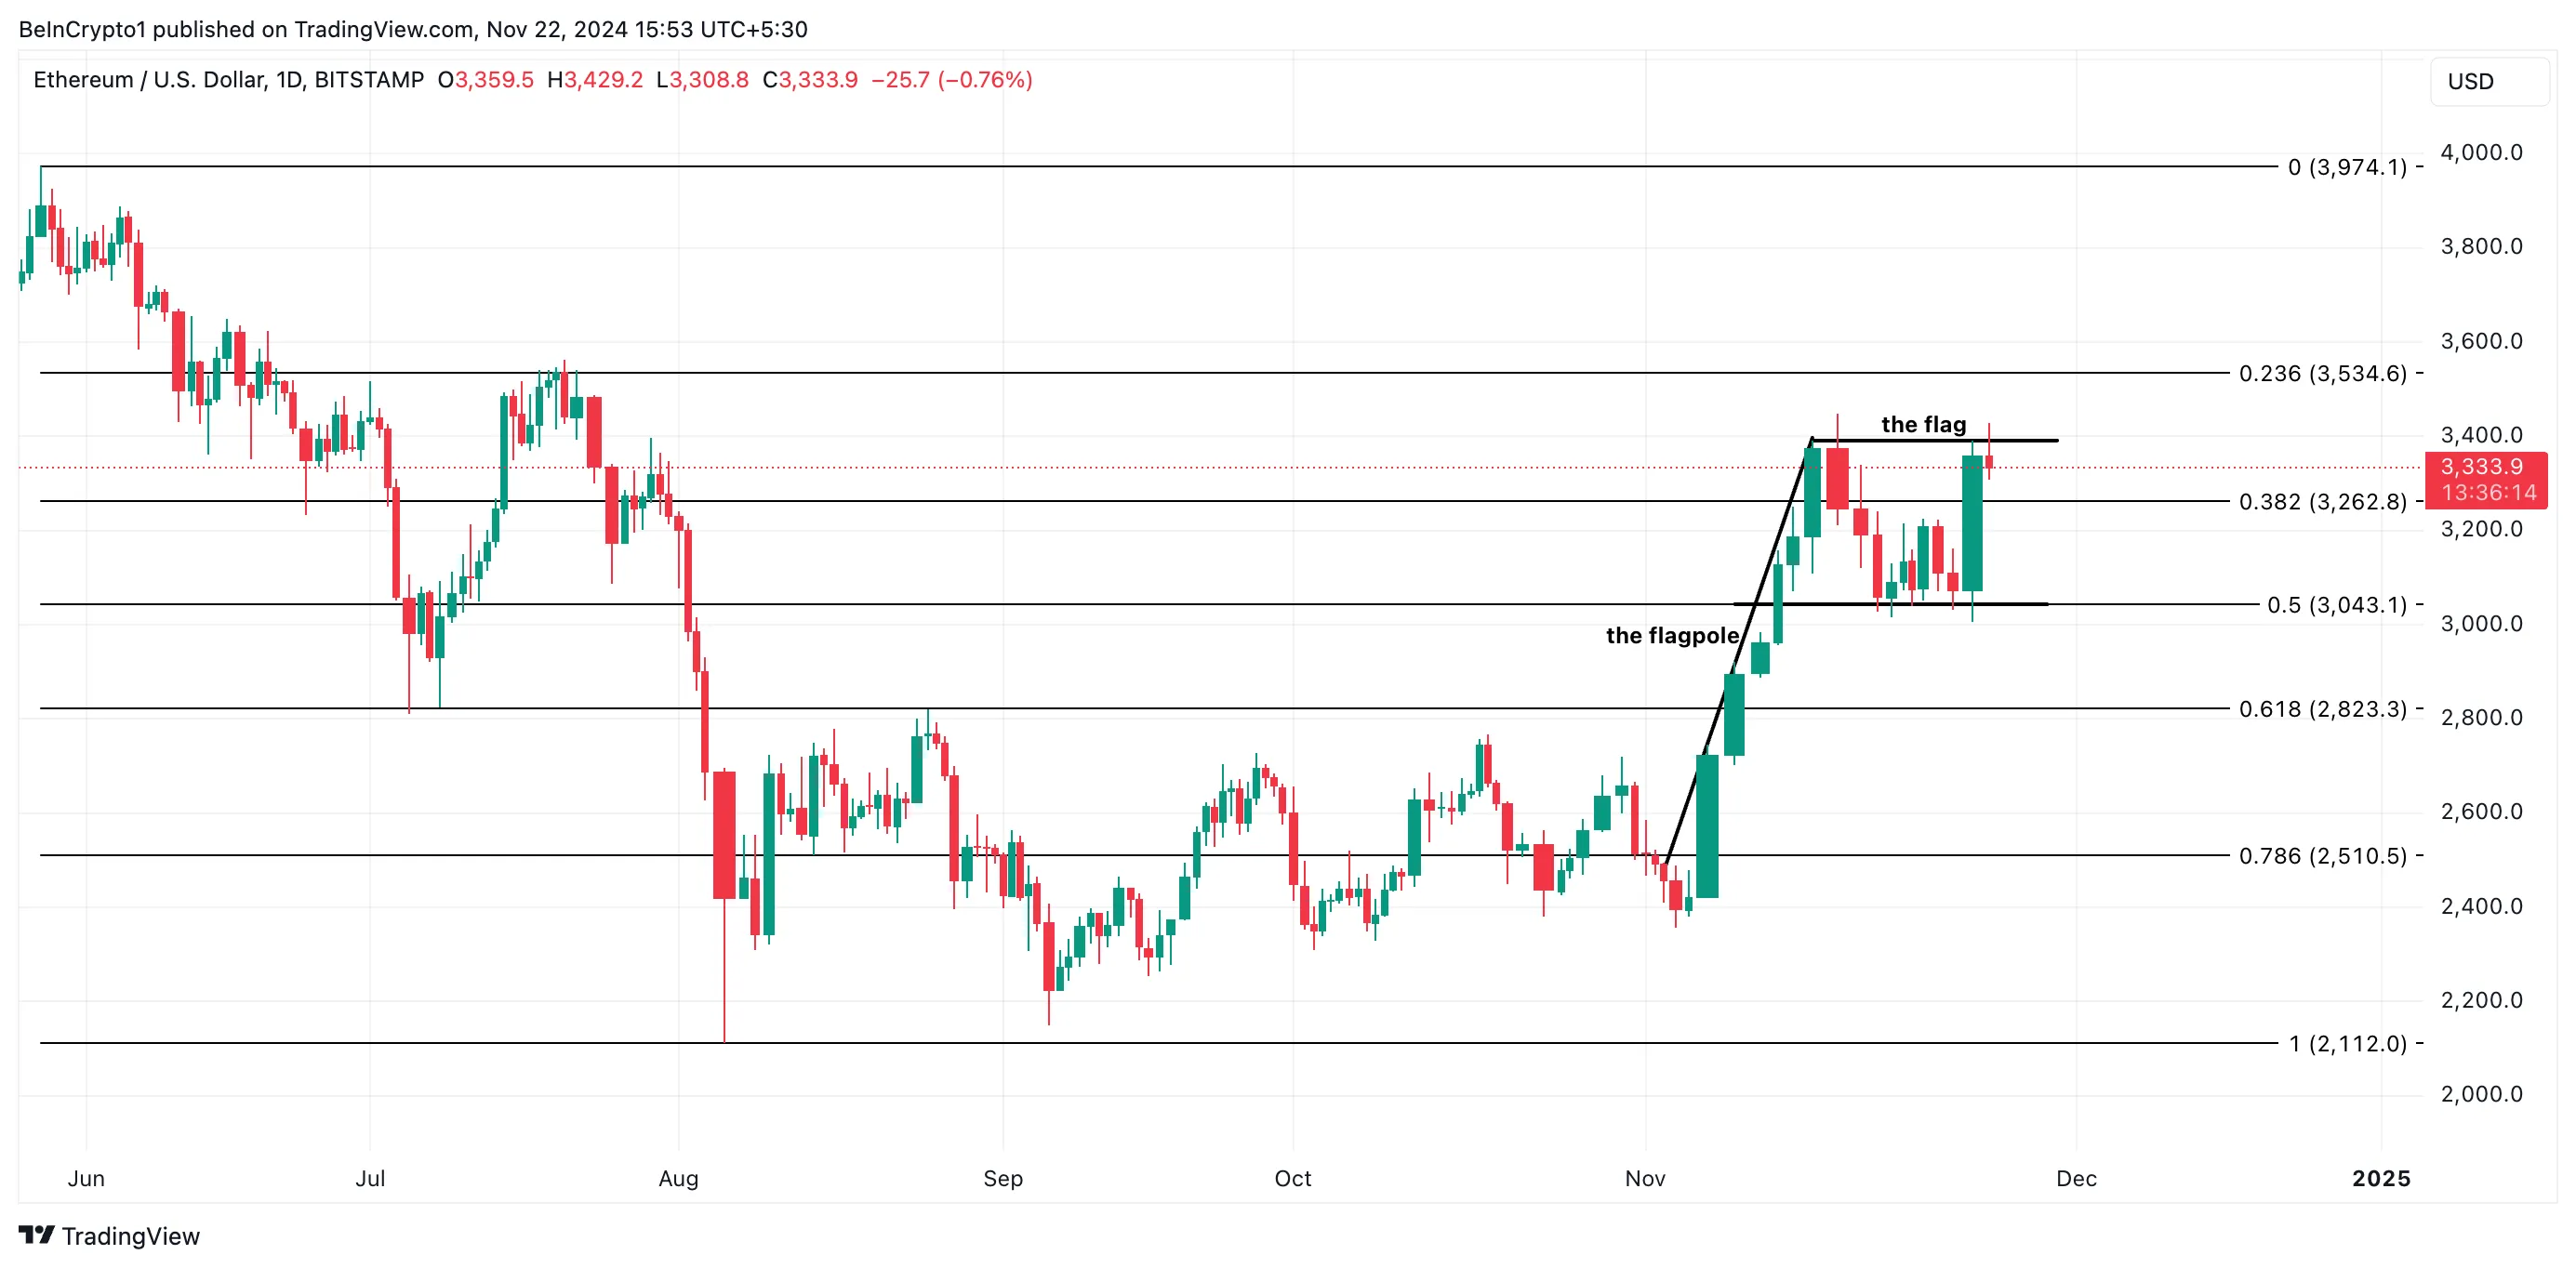
ETH’s successful break above the upper line of the horizontal channel at $3,997 will confirm the uptrend; if this happens, the coin’s price may rally toward $3,534. However, if buying pressure declines further, ETH’s price may plummet to $3,262, invalidating the bullish outlook above.
Disclaimer
In line with the Trust Project guidelines, this price analysis article is for informational purposes only and should not be considered financial or investment advice. BeInCrypto is committed to accurate, unbiased reporting, but market conditions are subject to change without notice. Always conduct your own research and consult with a professional before making any financial decisions. Please note that our Terms and Conditions, Privacy Policy, and Disclaimers have been updated.
Source link
Abiodun Oladokun
https://beincrypto.com/ethereums-ceiling-sparks-etf-outflows/
2024-11-22 11:09:59


