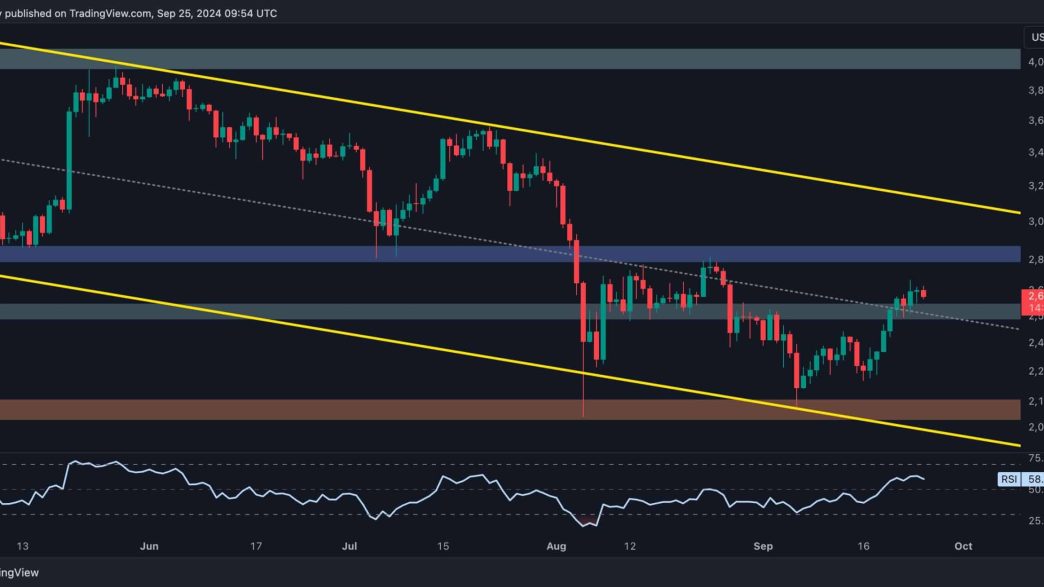
Ethereum’s bullish momentum has weakened after breaching the middle trendline of a multi-month descending channel, resulting in muted sideways price action.
This consolidation phase could lead to a pullback, potentially setting up the stage for the next leg of the bullish trend.
Technical Analysis
By Shayan
The Daily Chart
Ethereum experienced a surge driven by increased buying activity in the perpetual and spot markets, breaking above the crucial $2.5K resistance level. This breakout signals buyers’ intent to push ETH toward its yearly high of $4K despite the prevailing bearish sentiment over the past few months.
Currently, Ethereum’s price is consolidating in a sideways pattern, hinting at a potential pullback toward the recently broken trendline. If the price retraces to the $2.5K level and finds strong support, the pullback will likely conclude, positioning Ethereum for a renewed push toward the channel’s upper boundary, around the $3K mark.
The 4-Hour Chart
On the 4-hour chart, Ethereum’s upward momentum stalled upon reaching the significant resistance zone near the 0.5 Fibonacci retracement level ($2.6K). This area presents a supply zone that has consistently acted as a barrier for buyers aiming for the $3K resistance level.
Although ETH may face a period of sideways consolidation or corrective retracements in the short term, a resurgence of bullish momentum could lead to a breakout above this resistance zone. A short-squeeze event may follow if this occurs, driving further price gains. However, for now, a consolidation phase is expected before Ethereum makes its next impulsive move.
Onchain Analysis
By Shayan
The perpetual futures market plays a significant role in driving overall price movements, making it essential to assess the sentiment of futures traders for clues about potential trends. This analysis focuses on Ethereum’s 30-day moving average of funding rates, a key metric that provides insight into whether buyers or sellers are more aggressive in executing market orders within the futures market.
The 30-day moving average of ETH funding rates has recently shown a slight bullish shift after a prolonged decline. This shift has coincided with a broader market rebound and an uptick in ETH’s price, suggesting a possible change in overall sentiment. The rise in funding rates indicates increased buying activity among futures traders, signalling that market participants may be turning more bullish.
For Ethereum to continue its recovery and target higher price levels, the demand in the perpetual futures market must keep rising in the coming weeks. A sustained uptrend in the funding rates could drive further price surges in the mid-term. However, this bullish sentiment will need consistent follow-through from buyers to maintain momentum, as any significant reversal in funding rates could stall Ethereum’s price growth.
Binance Free $600 (CryptoPotato Exclusive): Use this link to register a new account and receive $600 exclusive welcome offer on Binance (full details).
LIMITED OFFER 2024 at BYDFi Exchange: Up to $2,888 welcome reward, use this link to register and open a 100 USDT-M position for free!
Disclaimer: Information found on CryptoPotato is those of writers quoted. It does not represent the opinions of CryptoPotato on whether to buy, sell, or hold any investments. You are advised to conduct your own research before making any investment decisions. Use provided information at your own risk. See Disclaimer for more information.
Cryptocurrency charts by TradingView.
Source link
CryptoVizArt
https://cryptopotato.com/eths-path-to-3k-involves-maintaining-this-critical-support-ethereum-price-analysis/
2024-09-25 14:37:55

