Ethereum’s recent price action highlights a mix of bullish momentum and cautious consolidation, with the price approaching a critical resistance at $3.5K.
A breakout above this level could pave the way for a significant rally, but the potential for a continuation of the consolidation phase remains.
Technical Analysis
By Shayan
The Daily Chart
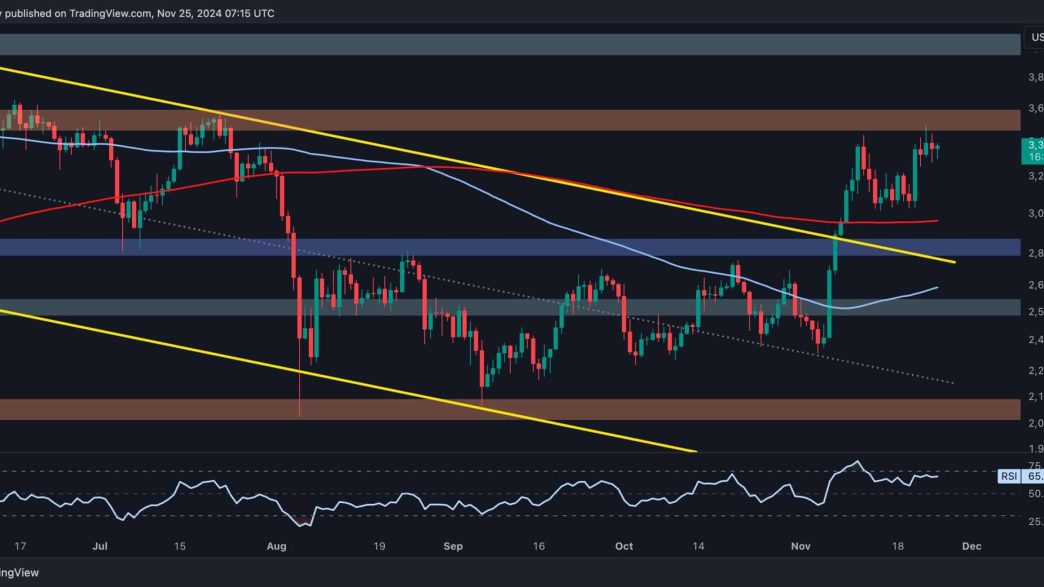
Ethereum’s upward trajectory has been marked by corrective retracements, which found support near the 200-day moving average at $3K. This zone acted as a significant support, with increased buying activity pushing the asset back toward the crucial $3.5K resistance, a region aligning with previous swing highs.
The $3.5K threshold represents a decisive supply zone despite the renewed bullish momentum. If buyers overcome this resistance, Ethereum will likely continue climbing toward its all-time high. However, failure to breach this level could result in an extended consolidation phase as the market digests recent gains.
The 4-Hour Chart
The 4-hour timeframe provides a clearer picture of Ethereum’s bullish structure, showcasing a substantial surge leading up to the $3.5K resistance. Following this move, the price consolidated, forming an ascending wedge pattern. This pattern is often considered bearish, suggesting a potential distribution stage.
Additionally, a bearish divergence between the price and the RSI indicator signals waning momentum. Combined with the supply pressure at $3.5K, this could increase the likelihood of a consolidation or minor pullback.
Nonetheless, the cryptocurrency market remains unpredictable, and the substantial influx of participants could trigger sudden price surges. Such movements might result in short liquidation cascades, rapidly pushing the price higher. Given these dynamics, traders should exercise caution and closely monitor market conditions during this critical phase.
By Shayan
Ethereum has continued to form higher highs and higher lows, edging closer to the $3.5K resistance level. However, its inability to breach these key levels, either above $3.5K or below $3K, strongly influences market liquidity.
The heatmap indicates that substantial liquidity resides below the $3K level, likely stemming from large market participants’ stop-loss orders and liquidation points, including whales. This explains why the price has been staunchly defended above this level. Whales and other significant players seem to be actively preventing a breach, as such an event would trigger a liquidation cascade, forcing them to incur losses.
Similarly, the $3.5K zone also holds considerable liquidity, representing a concentration of sell orders and liquidation levels for short positions. This liquidity has turned the $3.5K mark into a formidable resistance, with sellers and profit-takers dominating near this level. A breakout above it, however, could set off a cascade of short liquidations, fueling a rapid surge in Ethereum’s price. Ethereum’s price is currently oscillating between these two significant liquidity zones, creating a consolidation phase. A breakout in either direction could dramatically amplify market volatility.
Binance Free $600 (CryptoPotato Exclusive): Use this link to register a new account and receive $600 exclusive welcome offer on Binance (full details).
LIMITED OFFER for CryptoPotato readers at Bybit: Use this link to register and open a $500 FREE position on any coin!
Disclaimer: Information found on CryptoPotato is those of writers quoted. It does not represent the opinions of CryptoPotato on whether to buy, sell, or hold any investments. You are advised to conduct your own research before making any investment decisions. Use provided information at your own risk. See Disclaimer for more information.
Cryptocurrency charts by TradingView.
Source link
CryptoVizArt
https://cryptopotato.com/ethereum-price-analysis-failure-to-overcome-this-resistance-level-would-mean-trouble-for-eth/
2024-11-25 12:42:43


