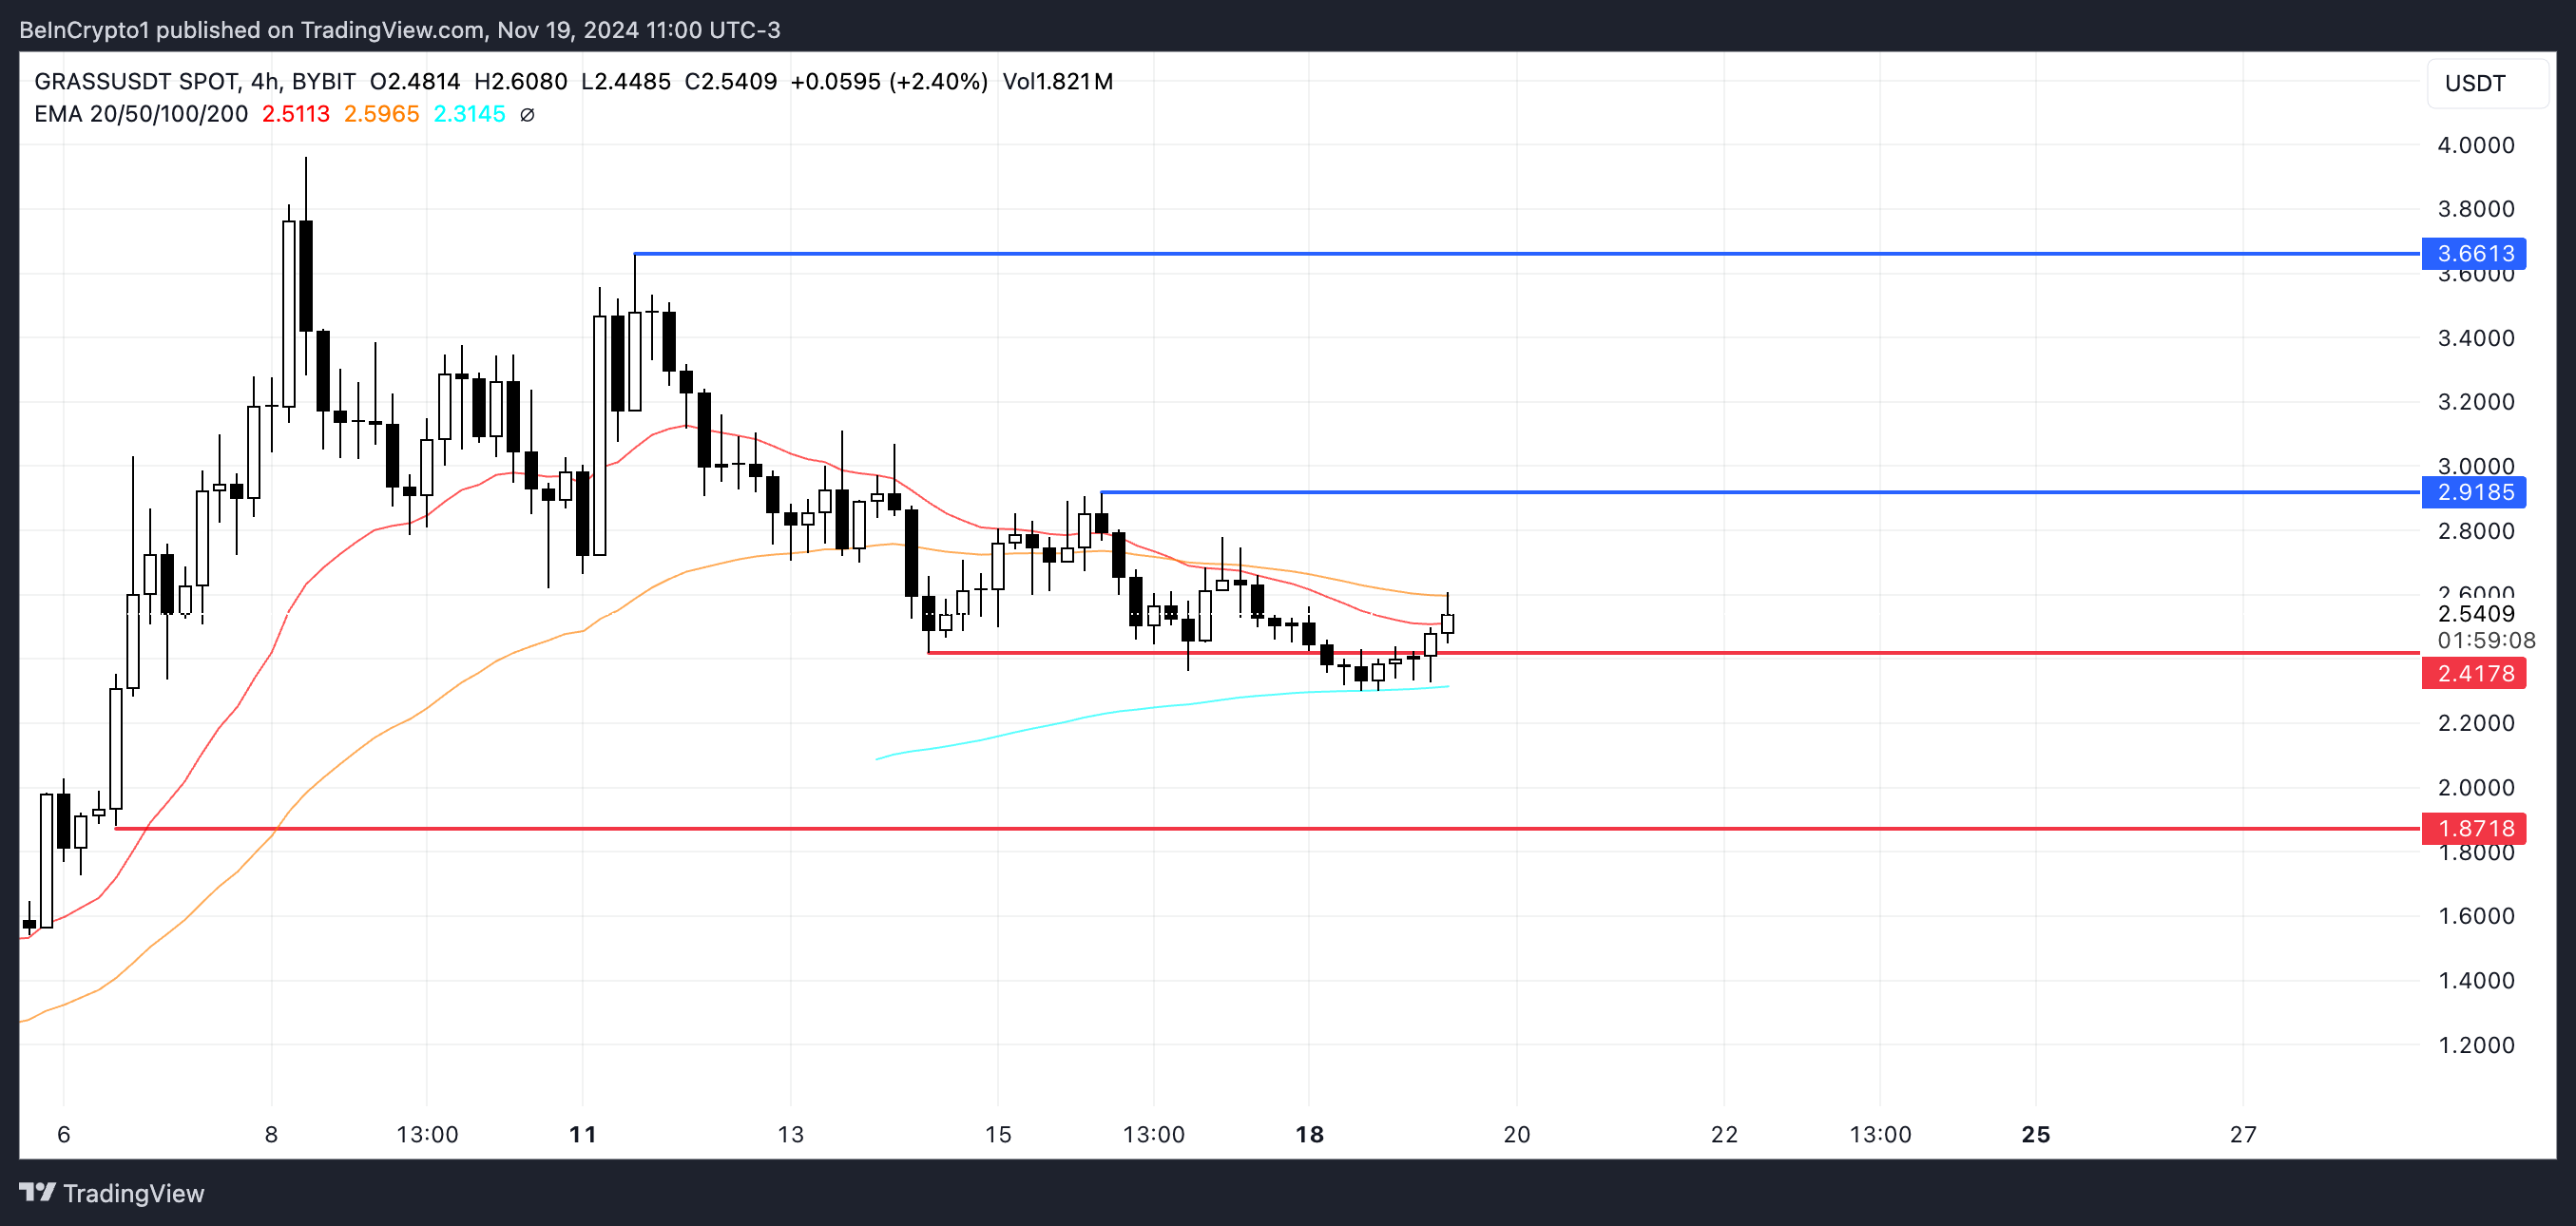
GRASS price has shown remarkable activity since its listing on major exchanges at the end of October. In its first week, the price skyrocketed from $0.65 to $1.60. However, recent metrics show GRASS entering a neutral zone, with its RSI at 51 and ADX at 14.84, indicating moderate recovery and weak trend strength.
As traders watch key resistance and support levels, the potential for a 44% surge or a 26% correction depends heavily on the strength of its ongoing uptrend.
GRASS Is Currently In The Neutral Zone
The Relative Strength Index (RSI) for GRASS has climbed to 51, up from a low of approximately 35. This shift indicates a recovery in momentum, moving from oversold territory toward a more balanced state. RSI, a key momentum indicator, measures the strength and speed of price movements, providing insight into whether an asset is overbought or oversold.
Values below 30 typically signal oversold conditions, while readings above 70 suggest overbought levels. At 51, GRASS’s RSI reflects neutral momentum, implying neither strong buying nor selling pressure currently dominates.
Despite being down nearly 15% over the past seven days, GRASS price has surged almost 10% in the last 24 hours. The RSI’s movement to 51 aligns with this short-term rebound, suggesting a shift toward stabilization after recent declines.
With RSI in the neutral zone, GRASS may be poised for consolidation or moderate gains, though a break above 70 could signal stronger upward momentum for one of the biggest airdrops of 2024.
GRASS Current Trend Isn’t That Strong
The Directional Movement Index (DMI) for GRASS reveals an ADX value of 14.84, suggesting a weak market trend. The Average Directional Index (ADX) measures the strength of a trend without indicating its direction. Typically, values above 25 signal a strong trend, while values below 20 indicate a lack of clear trend momentum.
At 14.84, the ADX suggests that GRASS is experiencing a period of low trend strength, which means that price movements are less likely to follow a sustained direction.

The DMI also includes the +DI (Directional Indicator) and -DI, which provide insights into the direction of the price trend. GRASS’s +DI is at 21.26, indicating slightly stronger bullish pressure, while the -DI is at 17.89, reflecting weaker bearish momentum.
However, with the ADX below 20, neither the bullish nor bearish pressure is strong enough to establish a clear trend. This setup suggests a choppy market where price movements may continue without a decisive upward or downward trajectory unless the ADX rises significantly.
GRASS Price Prediction: A 44% Surge?
GRASS’s current price is moving above its short-term EMA lines, indicating growing bullish momentum in the short term. Exponential Moving Averages (EMAs) smooth out price data and highlight trends, with shorter-term EMAs responding quickly to price changes.
This movement suggests that buyers are gaining control, and the asset’s immediate trend is turning positive. If this momentum continues, GRASS price could test key resistance levels, providing a clearer signal of sustained upward movement.

If the uptrend strengthens, GRASS could face its next resistance at $2.91. Breaking through this level could trigger further bullish activity, potentially driving the price to $3.66, representing a significant 44% upside. Conversely, if the uptrend weakens, the price may reverse, testing support at $2.41.
Failure to hold this level could lead to a deeper correction, with GRASS price potentially dropping to $1.87, marking a 26% downside. These levels highlight the importance of trend strength in determining the next significant price movement.
Disclaimer
In line with the Trust Project guidelines, this price analysis article is for informational purposes only and should not be considered financial or investment advice. BeInCrypto is committed to accurate, unbiased reporting, but market conditions are subject to change without notice. Always conduct your own research and consult with a professional before making any financial decisions. Please note that our Terms and Conditions, Privacy Policy, and Disclaimers have been updated.
Source link
Tiago Amaral
https://beincrypto.com/grass-price-climbs-trend-weak/
2024-11-19 21:00:00


