Traditional assets, including gold and the S&P 500, have reached new all-time highs. In contrast, Bitcoin (BTC) has decoupled and continued its underwhelming performance, which has lasted almost six months.
As a result, investors are questioning whether cryptocurrency still serves as a hedge against inflation compared to traditional assets. This on-chain analysis explores in detail whether BTC will continue to lag behind or if its status as a safe haven remains intact.
Bitcoin Falls Behind Gold, Others
Bitcoin’s price is $58,166, down 21% from its all-time high in March. Gold, on the other hand, has recently reached a new all-time high, with its value at $2,564. The famous S&P 500 also did the same while surpassing $5,650, with Silver on the verge of doing the same.
Based on BeInCrypto’s findings, this surge is attributable to the positive US CPI report released earlier this week. Meanwhile, the disparity between BTC and these traditional assets is similar to the situation the cryptocurrency experienced in May 2021.
During that period, Bitcoin’s price dropped by 36%. The current condition is also similar to the performance in November 2021, when the coin reached the top of the last bull market.
Regarding this matter, CryptoQuant, in its weekly report, explained that investors seem to lean toward less risky assets.
“A period of negative correlation between Bitcoin and Gold, with Gold increasing and Bitcoin decreasing, typically signals a risk-averse environment where investors favor traditional safe-haven assets like Gold over speculative assets like Bitcoin,” the report highlighted.
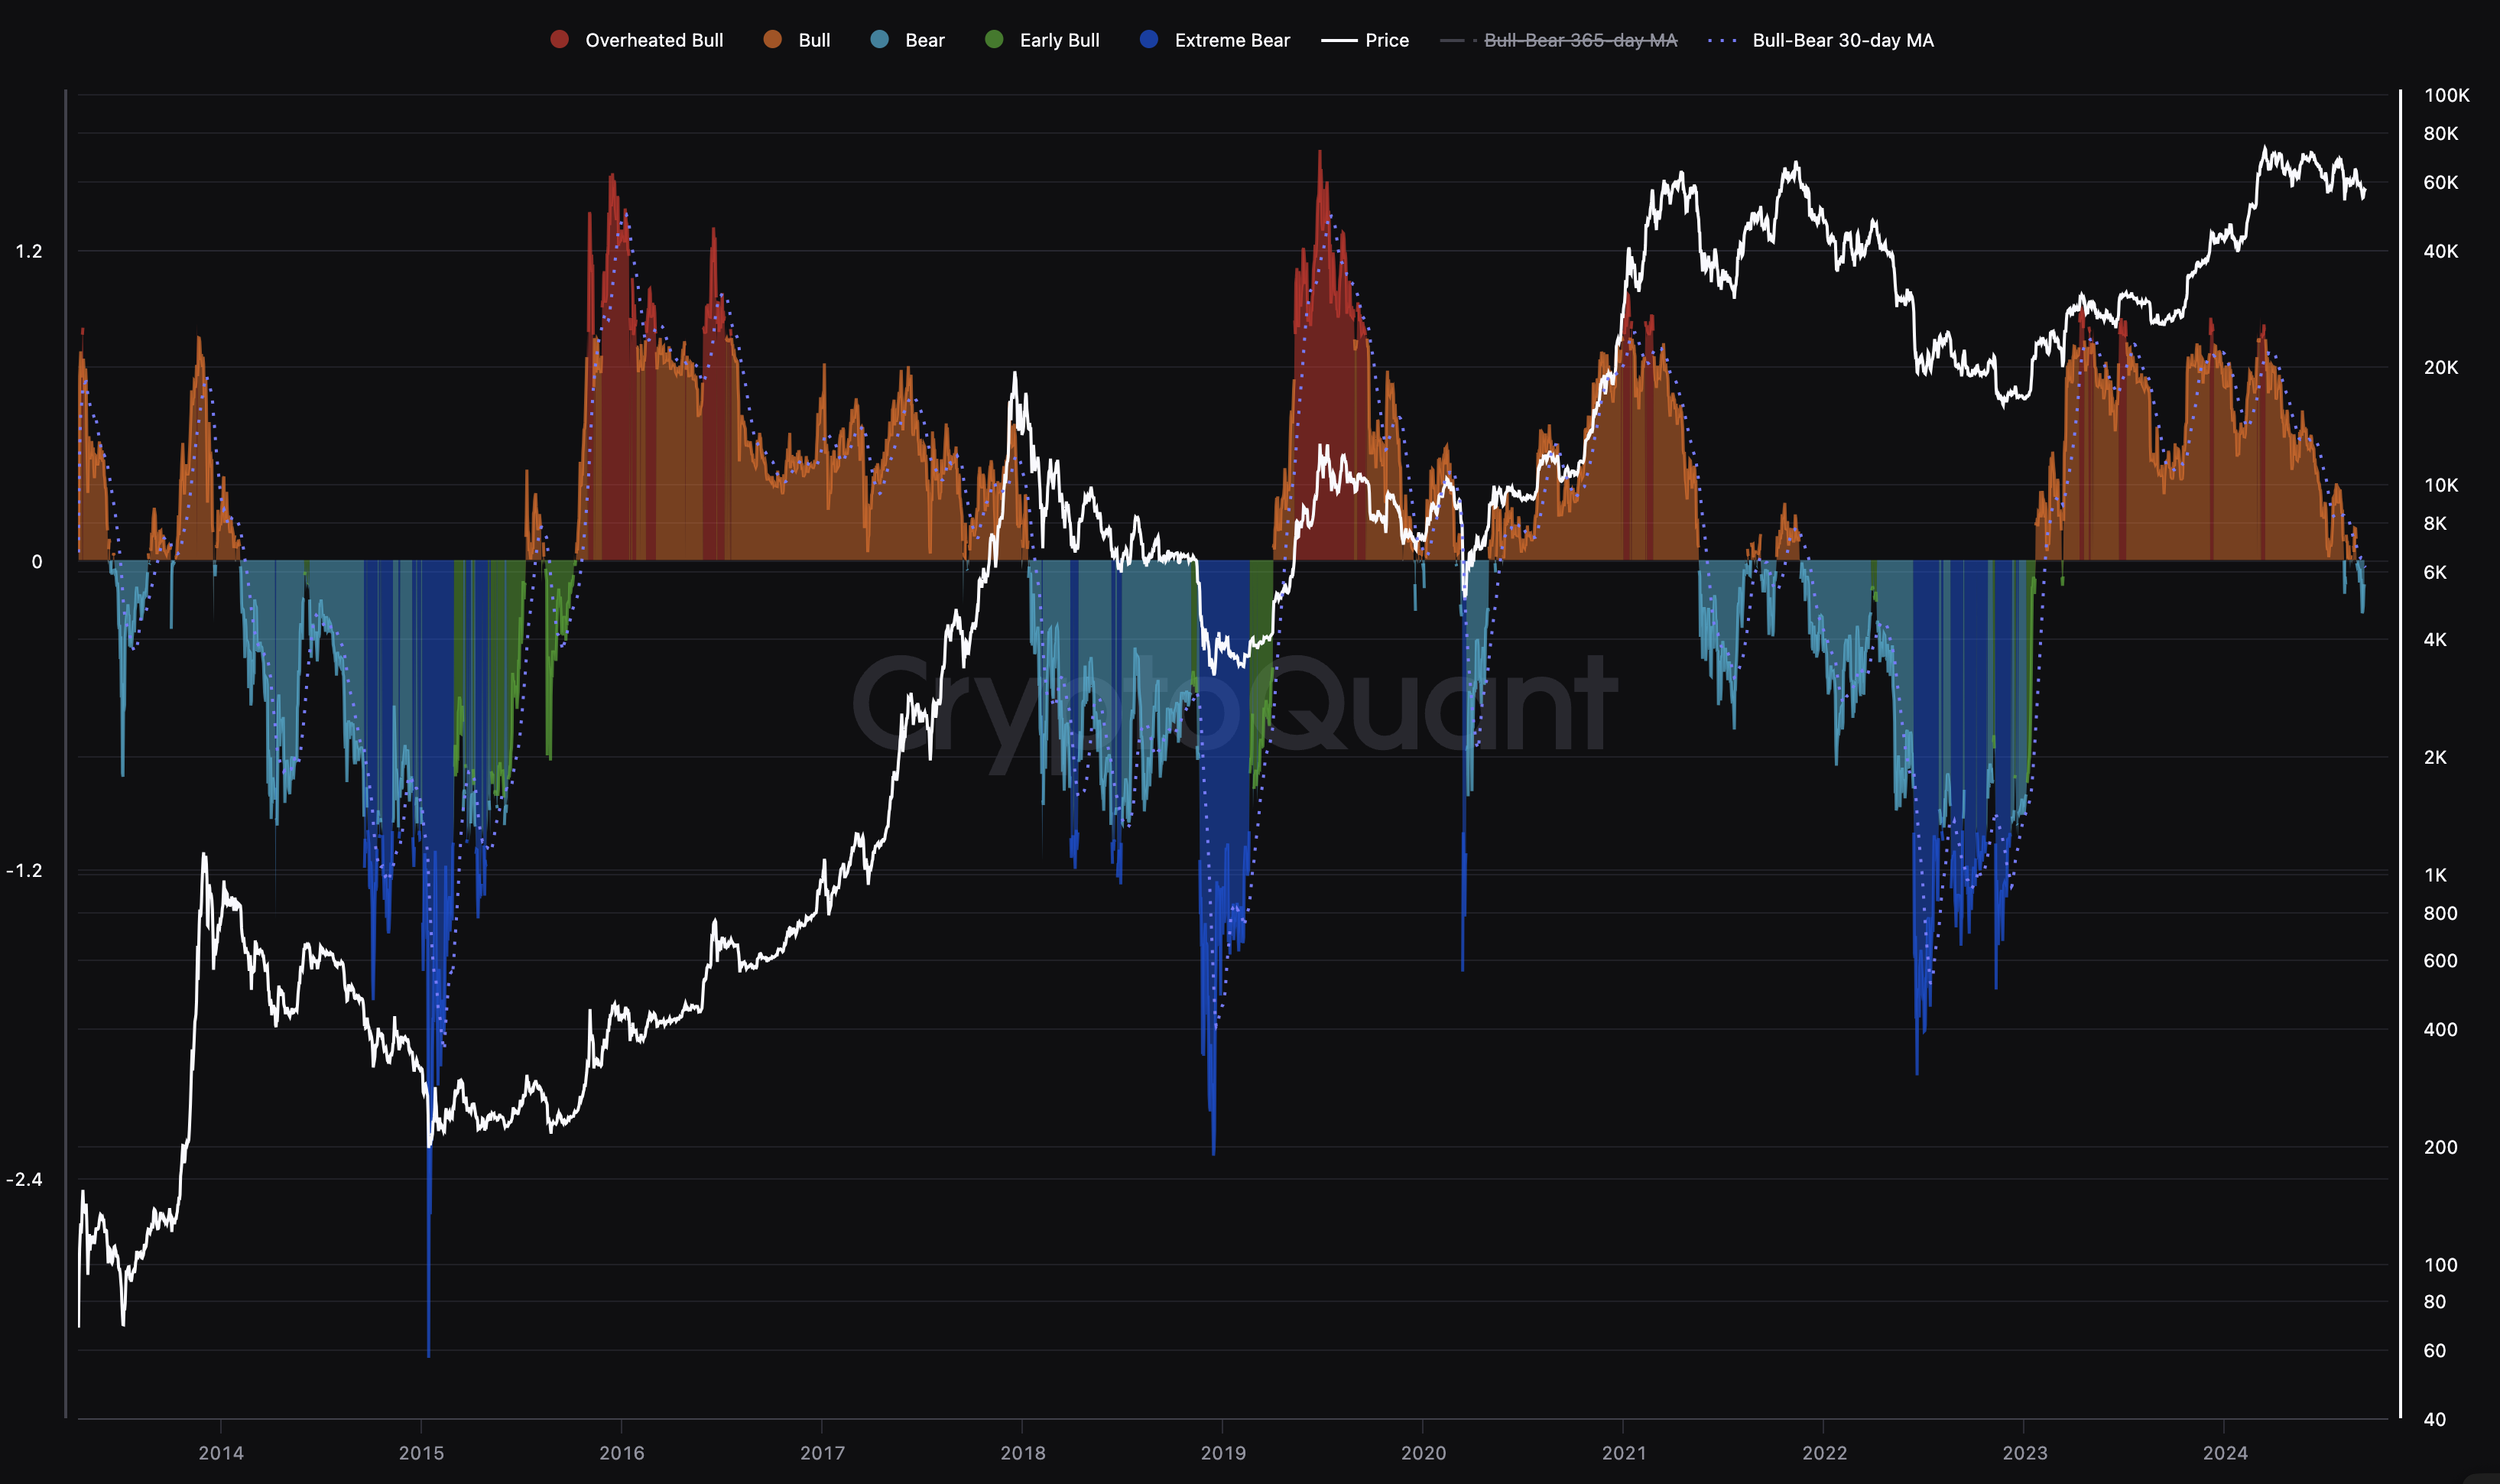
Following these milestones, Bitcoin might continue to be in a largely bearish phase. One reason for this bias is the current status of the Bull/Bear Cycle. This momentum metric measures the difference between the profit and loss index and the coin’s 365-day moving average.
When the metric is above zero, it’s a bull cycle. A reading below zero, on the other hand, indicates a bear market. As of this writing, the Bull/Bear Cycle indicator has fallen below the threshold, suggesting that Bitcoin’s price might have entered a bear mode.
Read more: Who Owns the Most Bitcoin in 2024?

BTC Price in Danger Unless Fresh Capital Enters the Market
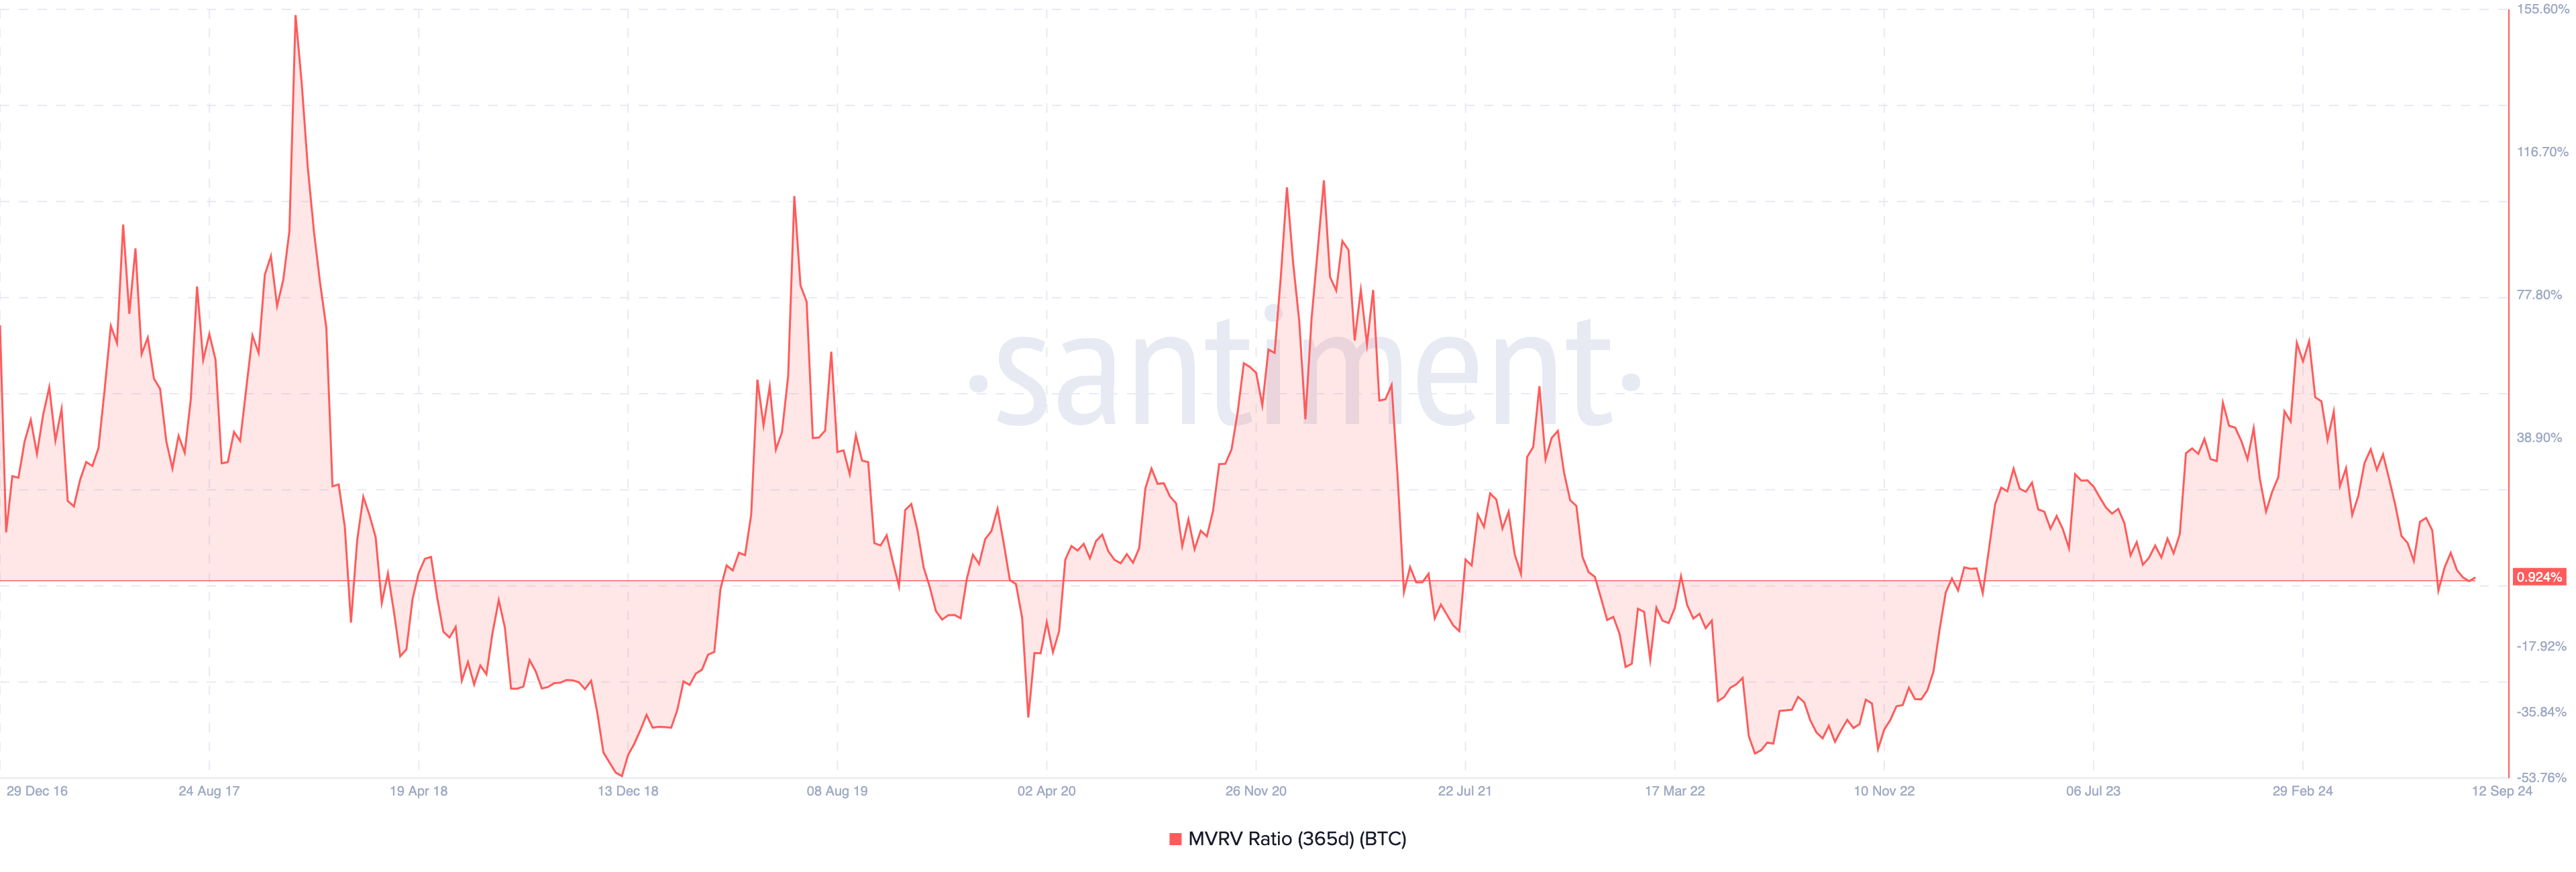
Another metric supporting this bearish bias is the 365-day Market Value to Realized Value (MVRV) ratio. This ratio shows how far or close Bitcoin’s price is from the Realized Price, the average price at which every coin holder purchased the cryptocurrency.
High values of the MVRV ratio indicate overvaluation. Low values, on the flip side, suggest undervaluation.
According to Santiment, Bitcoin’s 365-day MVRV ratio is less than 1%, indicating that the cryptocurrency could be subject to bearish forces. As seen in the chart below, once BTC slides to the negative territory, it becomes challenging to return to the upside.
Therefore, if the ratio eventually drops below the green region, Bitcoin’s price might drop to $45,000, and this bull cycle might finally transition to the bear cycle.

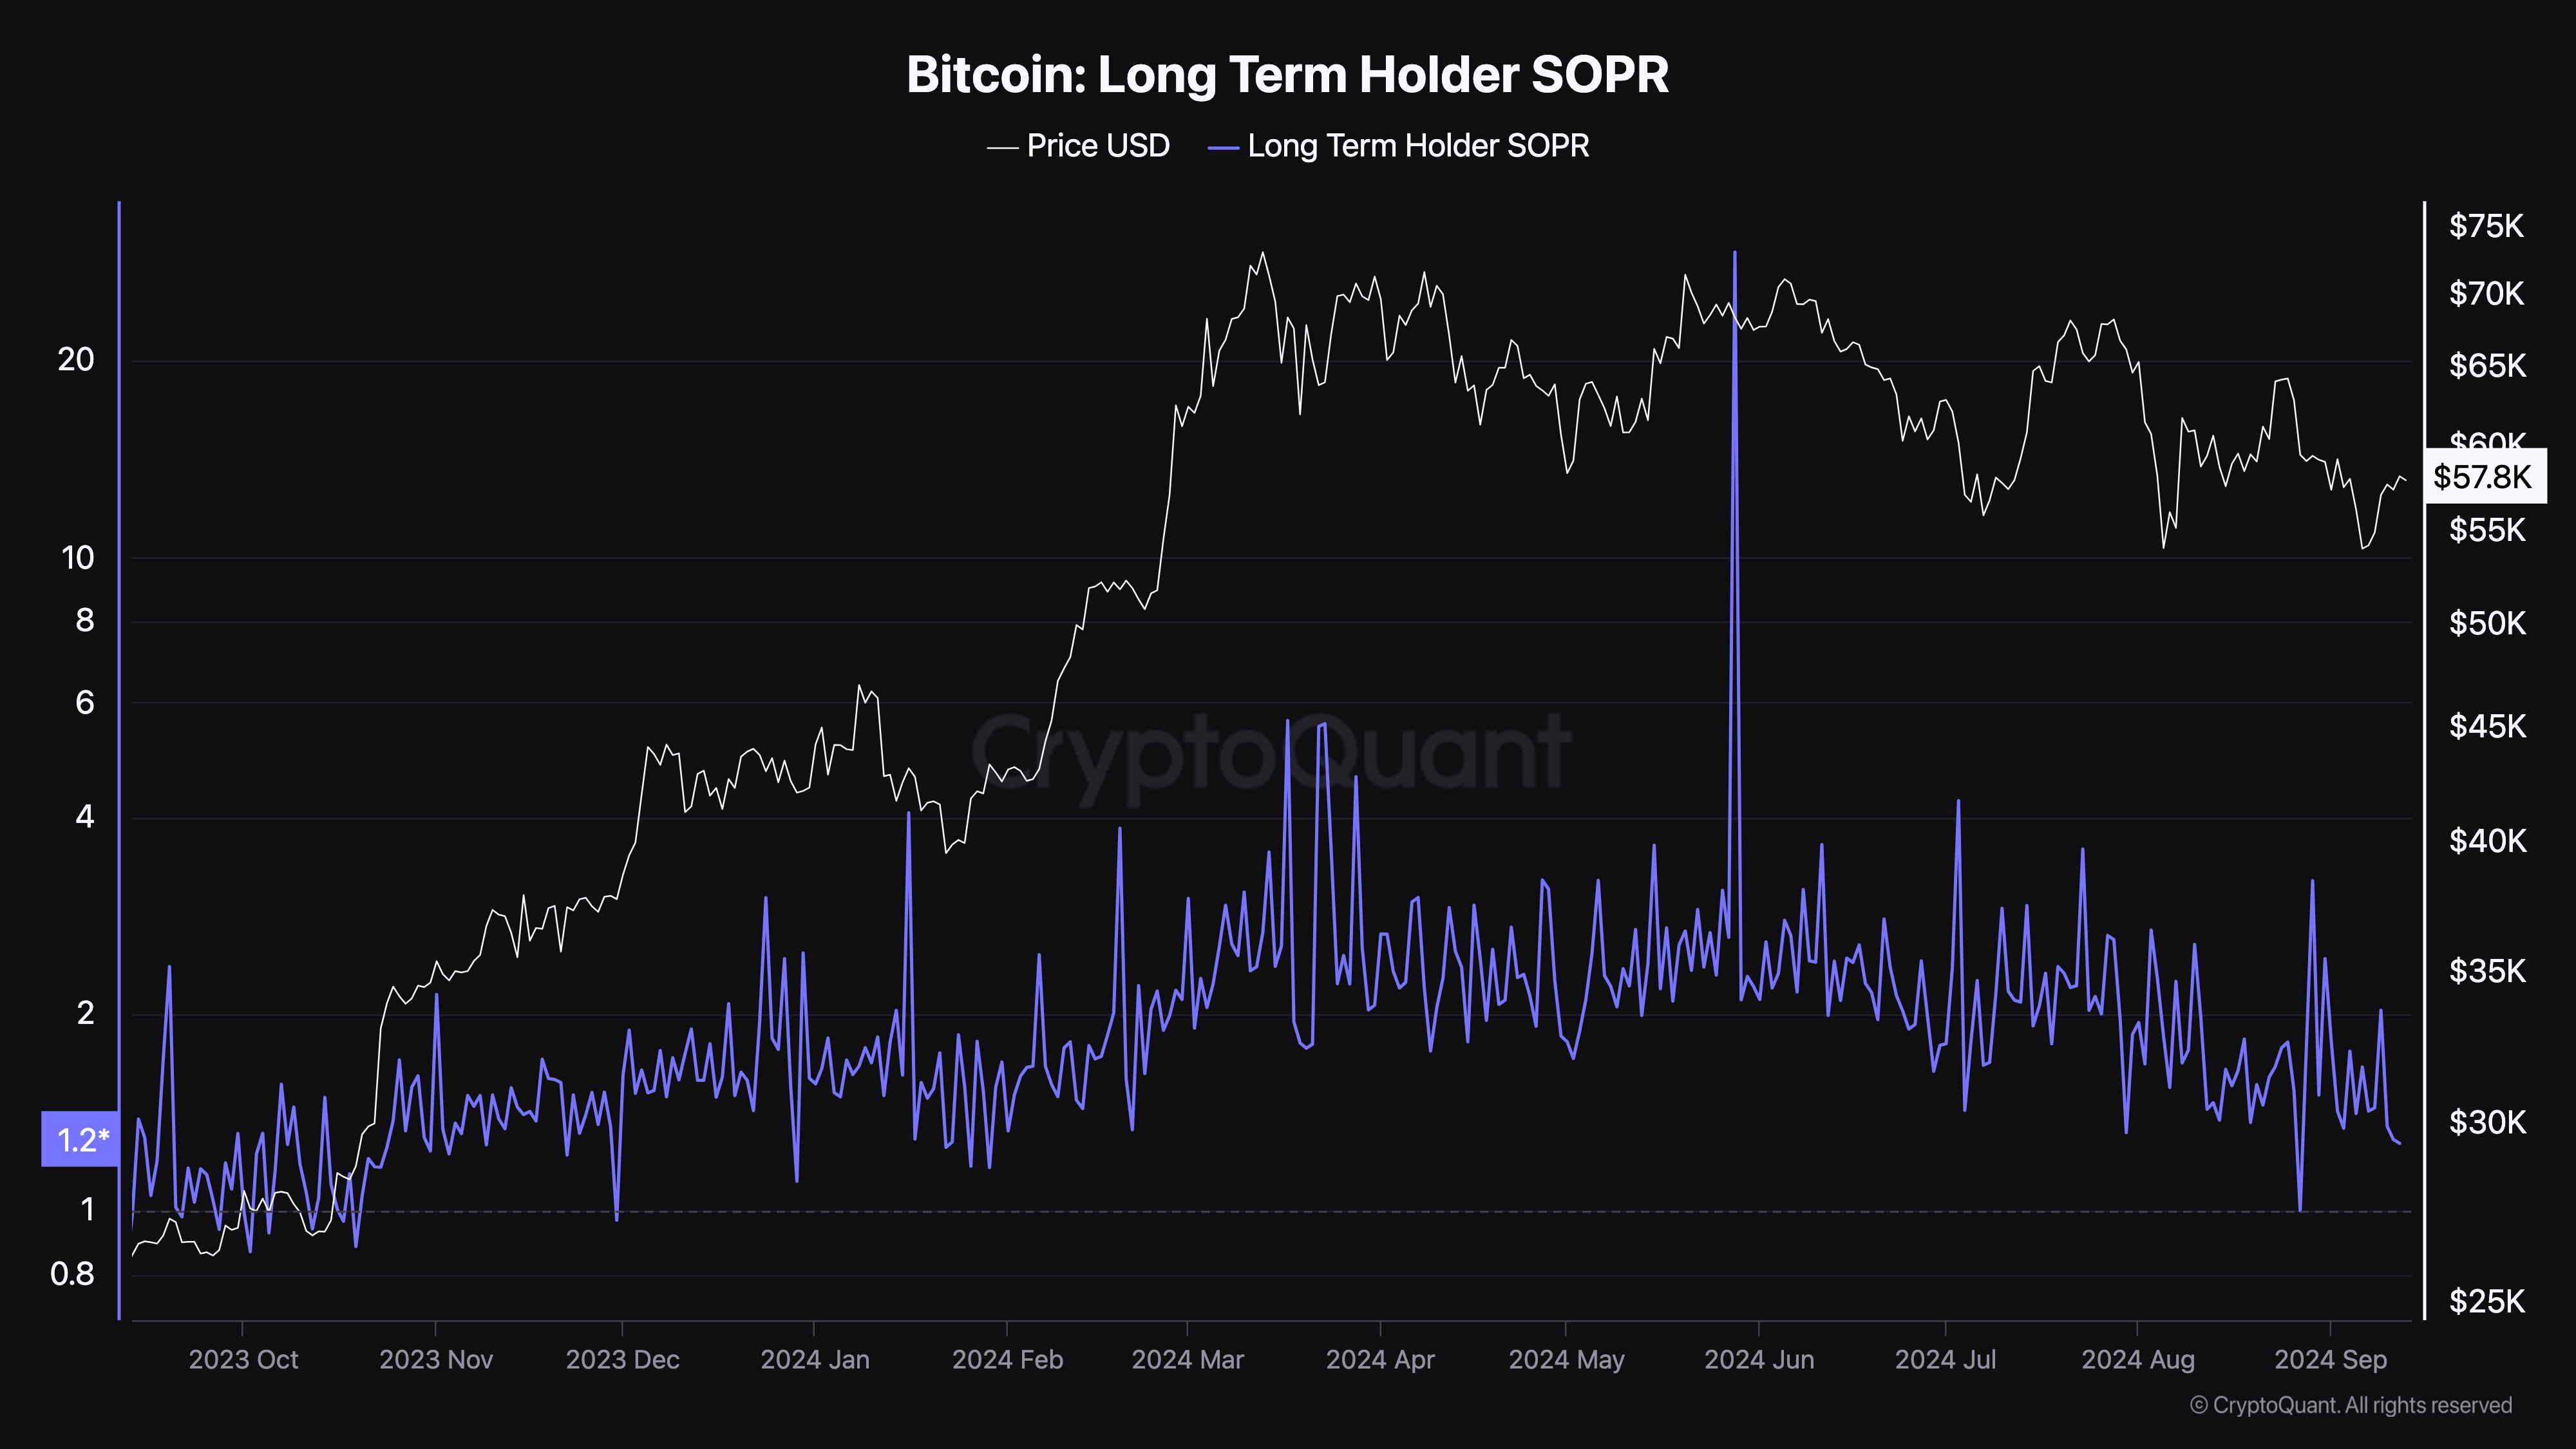
In addition, the Long-Term Holder (LTH) Spent Output Profit Ratio (SOPR) has been declining since July. An increase in LTH-SOPR indicates that holders are selling at a higher profit, making it easier for BTC to attract fresh demand.
The ongoing decline, in turn, suggests that long-term holders are selling at lower profits. This could make it difficult for Bitcoin to generate the higher demand necessary to drive a price increase.
Read more: 7 Best Crypto Exchanges in the USA for Bitcoin (BTC) Trading

However, Bitcoin could start climbing toward its all-time high if profits from traditional assets flow into BTC and other cryptocurrencies.
At the moment, Bitcoin is seeing a growing wave of positive sentiment, which is tied to the recent milestones achieved by gold and other assets. According to Santiment, a significant level of doubt may be necessary for BTC to make a strong push toward its all-time high.
“When the crowd begins conveying doubt again, BTC will truly begin testing its March all-time high market values,” the on-chain analytics platform said on X.
Disclaimer
In line with the Trust Project guidelines, this price analysis article is for informational purposes only and should not be considered financial or investment advice. BeInCrypto is committed to accurate, unbiased reporting, but market conditions are subject to change without notice. Always conduct your own research and consult with a professional before making any financial decisions. Please note that our Terms and Conditions, Privacy Policy, and Disclaimers have been updated.
Source link
Victor Olanrewaju
https://beincrypto.com/bitcoin-falls-behind-gold/
2024-09-13 08:38:55


