
Bitcoin has been experiencing a bearish retracement following a significant rejection from the 100-day and 200-day moving averages. This highlights the prevailing dominance of sellers, who seem to be intending to drive the price lower.
Technical Analysis
By Shayan
The Daily Chart
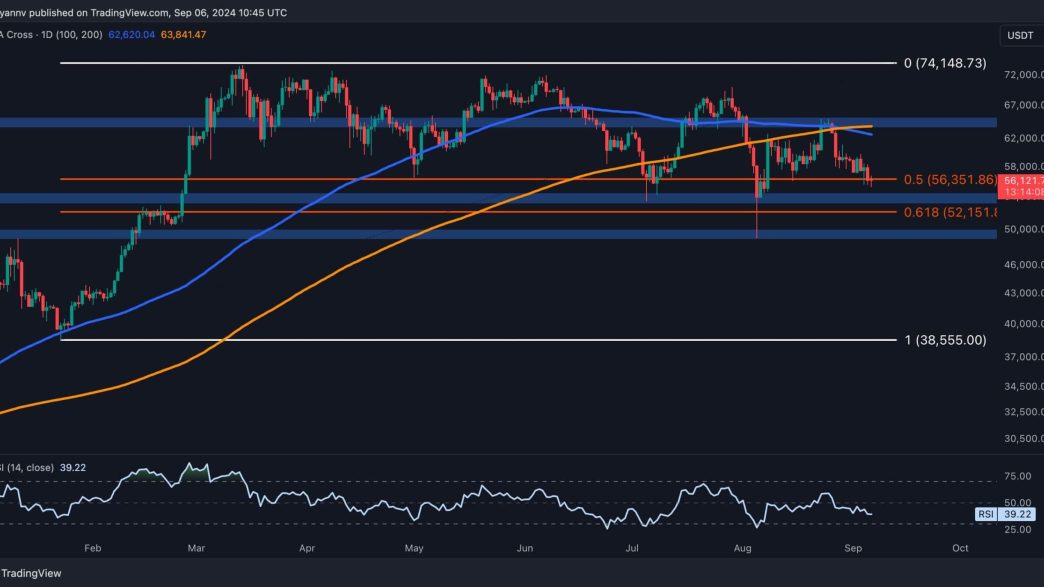
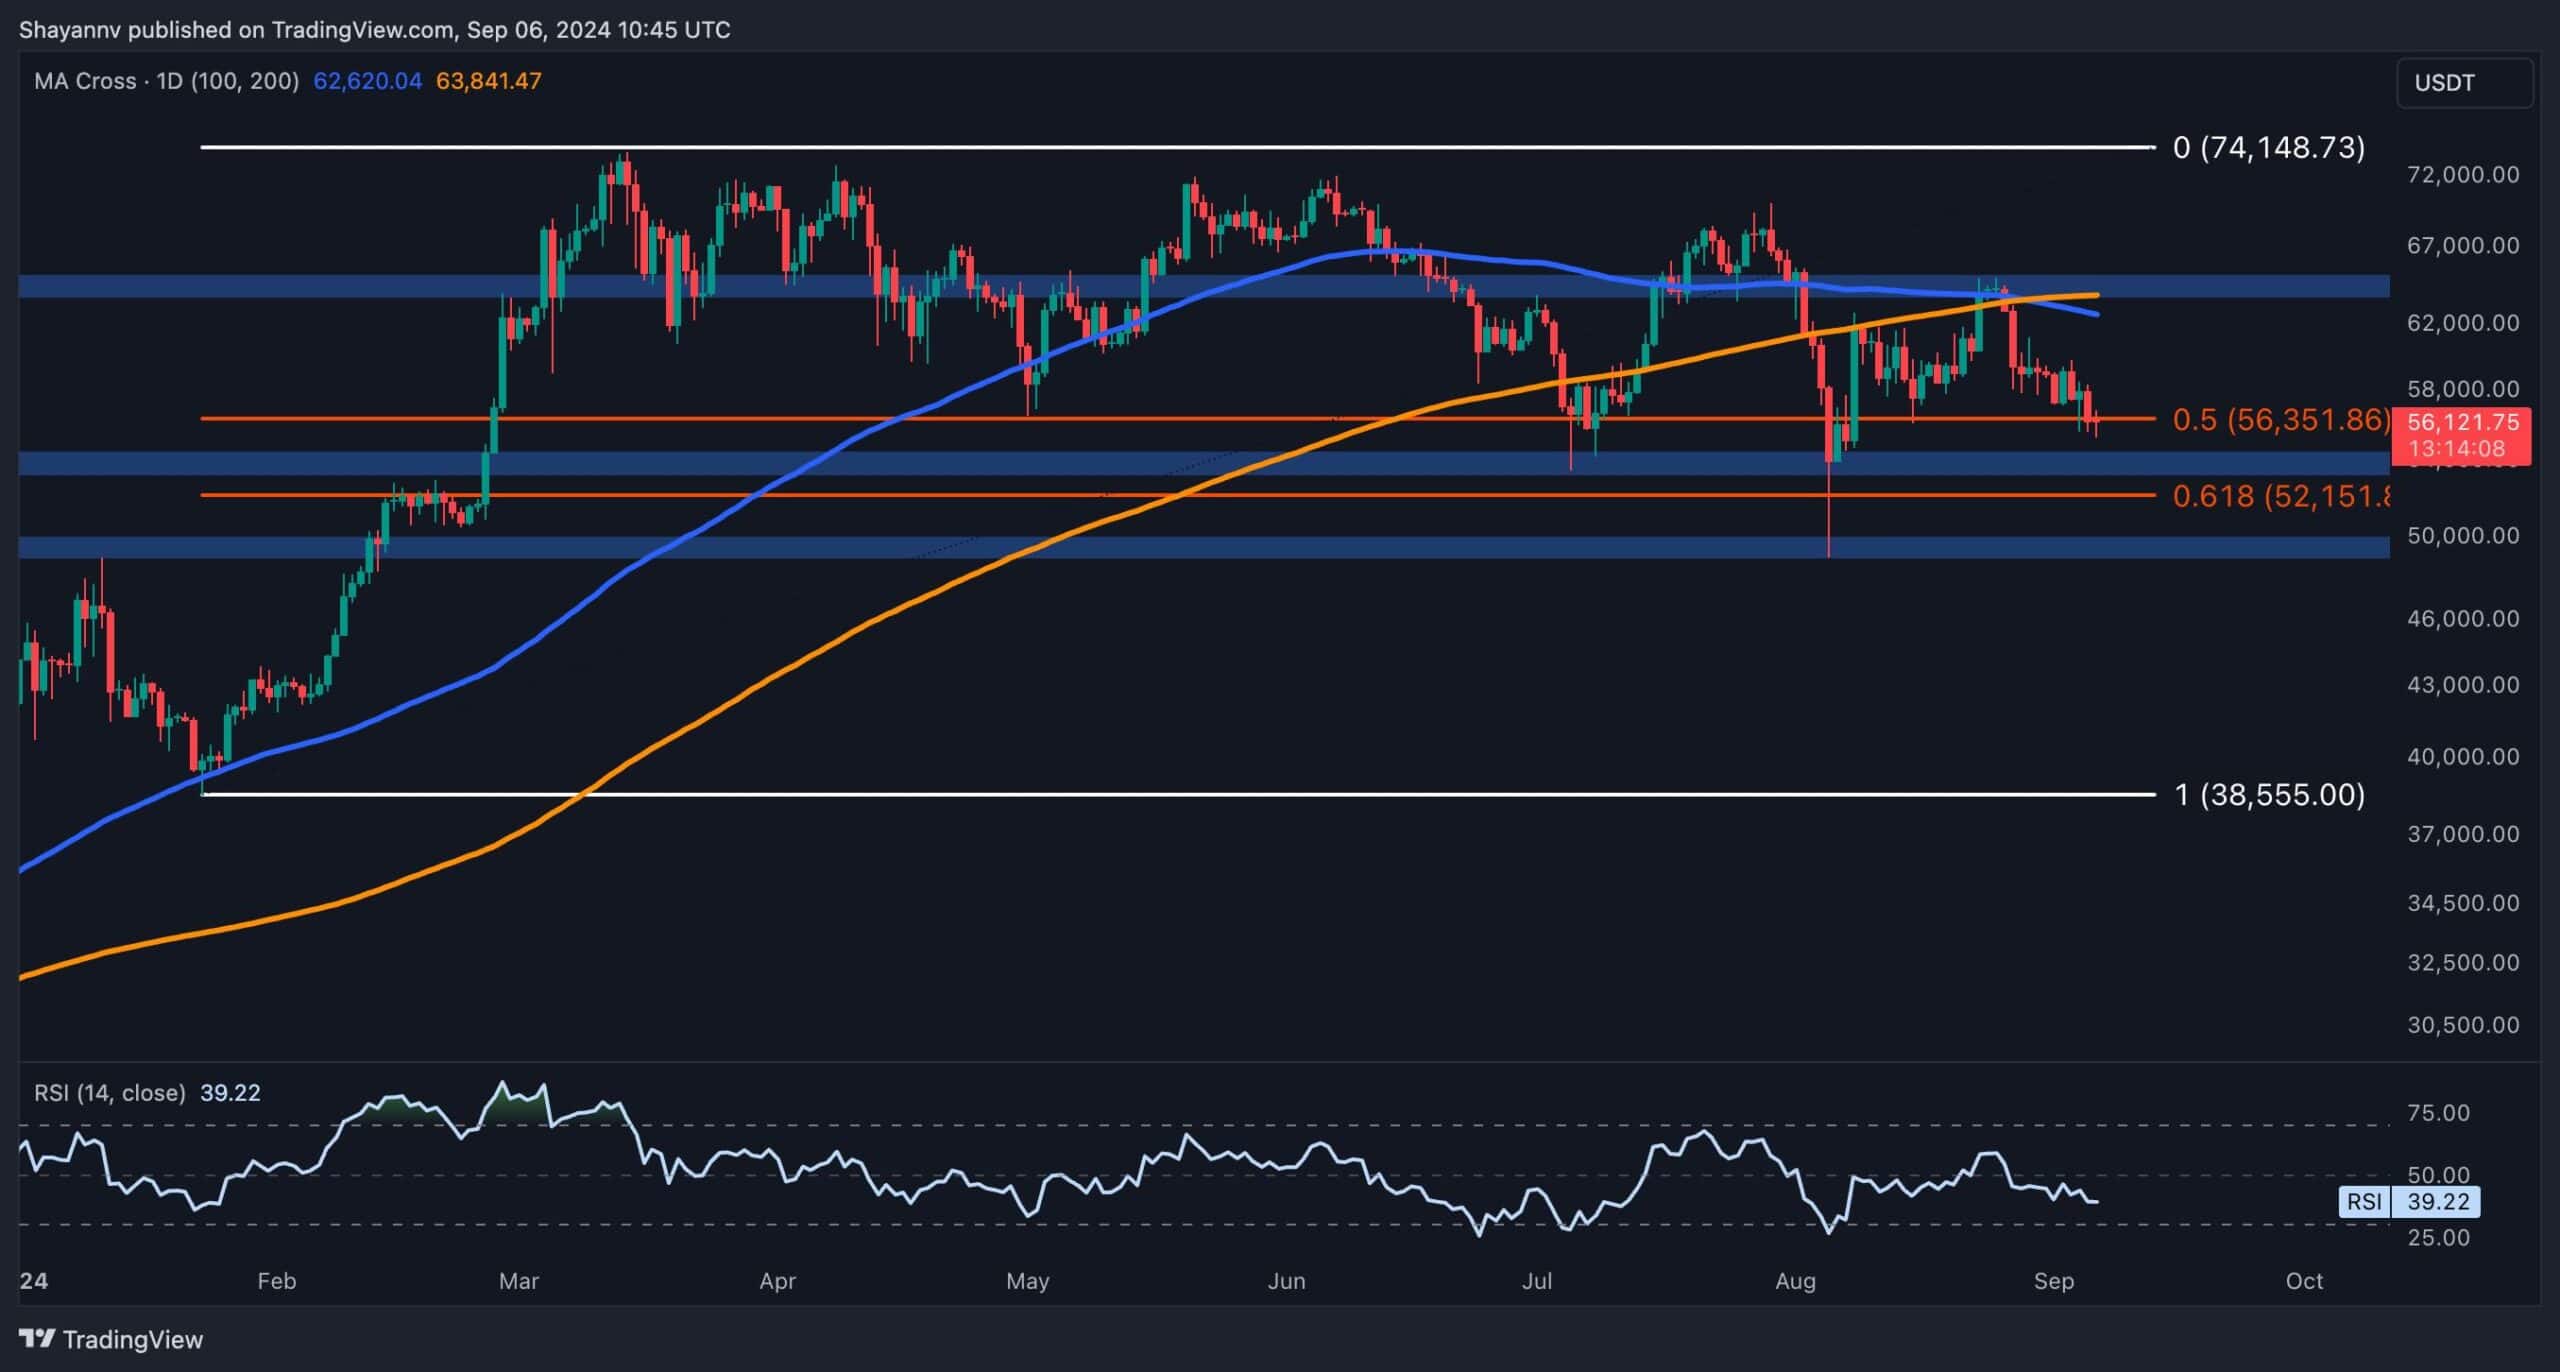
A closer look at Bitcoin’s daily chart shows that after a surge toward the 100-day and 200-day moving averages around the $64K mark, the price faced intensified selling pressure and was notably rejected.
This resulted in a pullback to these broken moving averages, signaling the beginning of a bearish decline. The price action indicates that sellers are firmly in control, with the 100-day MA crossing below the 200-day MA to form a “death cross,” further reinforcing the bearish outlook.
Currently, Bitcoin has entered a key support zone defined by the 0.5 to 0.618 Fibonacci retracement levels. This zone could provide temporary relief from the downtrend, potentially leading to a period of sideways consolidation.
The 4-Hour Chart
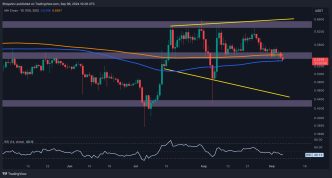
On the 4-hour chart, Bitcoin’s price has seen a clear bearish rejection at the $64K resistance level, leading to a steady decline.
The failure to establish new higher highs has turned the market trend decisively bearish, with lower highs and lower lows signaling intense selling activity. Bitcoin now sits at a critical support zone defined by the 0.5 and 0.618 Fibonacci retracement levels.
If sellers push the price below this range, the next target is the key $50K support level, where significant buying pressure may reemerge. Conversely, if Bitcoin finds support at this level, a bullish rebound toward the psychological $60K resistance could materialize.

On-chain Analysis
By Shayan
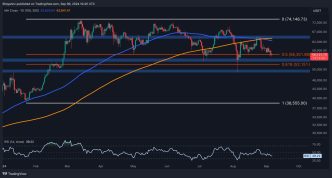
Examining futures market metrics can provide valuable insight into sentiment when assessing Bitcoin’s price movements. One key indicator is the Taker Buy/Sell Ratio, which measures whether buyers or sellers are more aggressive in executing their orders.
The chart shows a significant decline in the ratio after Bitcoin’s rejection from the $64K level. This drop indicates a surge in market sell orders, reflecting a broader sentiment of distribution among traders.
This behavior underscores growing bearish expectations as traders are positioning for a possible breakdown and further price declines, potentially toward the $50K support level. The increase in sell-side aggression indicates a short-term continuation of the bearish trend.

Binance Free $600 (CryptoPotato Exclusive): Use this link to register a new account and receive $600 exclusive welcome offer on Binance (full details).
LIMITED OFFER 2024 at BYDFi Exchange: Up to $2,888 welcome reward, use this link to register and open a 100 USDT-M position for free!
Disclaimer: Information found on CryptoPotato is those of writers quoted. It does not represent the opinions of CryptoPotato on whether to buy, sell, or hold any investments. You are advised to conduct your own research before making any investment decisions. Use provided information at your own risk. See Disclaimer for more information.
Cryptocurrency charts by TradingView.
Source link
CryptoVizArt
https://cryptopotato.com/bitcoin-price-analysis-is-50k-imminent-after-another-3-daily-crash-for-btc/
2024-09-06 14:27:22


