Bitcoin (BTC) and U.S. stocks have shown a negative correlation lately, with Bitcoin often moving in the opposite direction of traditional markets. This divergence has caught the attention of analysts and investors, especially as the cryptocurrency enters a period of consolidation along with the broader crypto market. Historically, shifts in this correlation—from negative to positive—have often signaled a bullish trend for Bitcoin.
Related Reading
As both markets face challenges, the changing dynamics between BTC and U.S. stocks could provide crucial insights into where the market is headed. Investors are closely watching this relationship, anticipating that a shift could indicate a potential breakout for Bitcoin.
Bitcoin Data Suggests Potential Uptrend
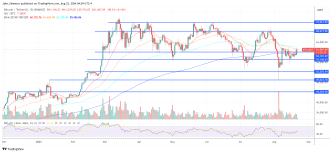
The negative correlation between Bitcoin (BTC) and the U.S. stock market, particularly the S&P 500 (SPX), has become increasingly evident. Prominent analyst and trader Daan on X recently highlighted this phenomenon by overlaying the BTC/USDT futures chart with SPX prices.
His analysis shows that while traditional markets like the SPX have experienced a swift recovery, Bitcoin has not followed suit. This divergence underscores the decoupling between these two markets, with Bitcoin lagging behind the broader stock recovery.
Another key analyst, Caleb Franzen, brought attention to this trend, sharing data revealing Bitcoin’s negative correlation with major stock indices. Specifically, Franzen points out that the 90-day correlation between Bitcoin and the Nasdaq-100 ($QQQ) currently stands at -27%. This negative correlation suggests that as tech stocks recover, Bitcoin has been moving in the opposite direction, which can signify unique market dynamics.
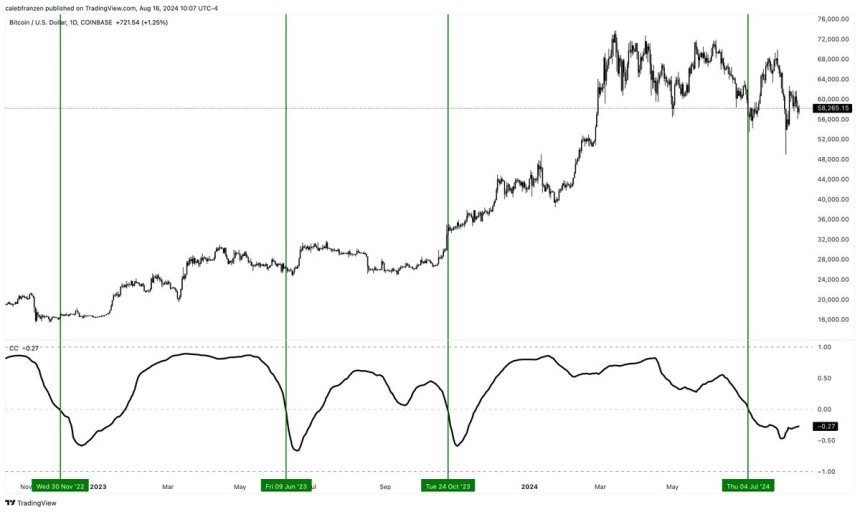
While periods of negative correlation between Bitcoin and stocks are not inherently bullish, historical evidence suggests that positive market shifts often follow such phases. The critical point for investors is to monitor a potential reversal of this correlation—when Bitcoin begins to move in tandem with the Nasdaq-100 ($QQQ) once again.
If Bitcoin’s correlation with tech stocks turns positive, it could signal a strengthening market and a possible uptrend for BTC. This shift could provide a key indicator for timing potential entry points in the market.
BTC Price Trading Below A Key Indicator
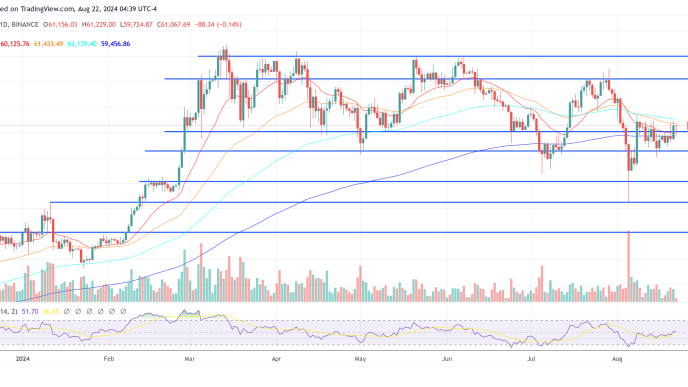
Bitcoin trades at $59,350, below the critical daily 200-day moving average (MA) at $62,915. This moving average is a key indicator many analysts use to gauge market trends. When BTC’s price is below the daily 200 MA, it typically suggests a downtrend or a significant correction. Conversely, trading above this level indicates market strength and bullish momentum.
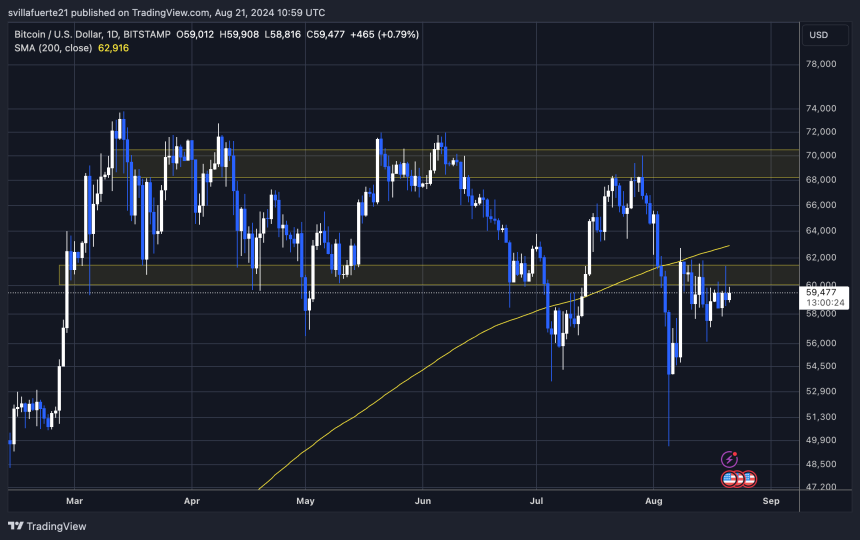
For Bitcoin to confirm the continuation of its bull market, it needs to reclaim the daily 200 MA and consistently close above it. This would signal a potential shift in trend, providing confidence to traders and investors that the bullish phase is still intact.
Currently, BTC is hovering around the key psychological level of $60,000, and the market remains in a consolidation phase after enduring months of uncertainty and volatility.
For the bullish scenario to unfold, Bitcoin must break above $63,000, retaking the daily 200 MA and surpassing the August 8th local high of $62,729. This would mark a significant recovery and indicate that the market is regaining its strength.
Related Reading
On the other hand, if BTC fails to close above $57,500 in the coming days, it could signal further downside pressure, potentially leading to a pullback to sub-$50,000 levels. The coming days will be crucial in determining whether Bitcoin can regain its upward momentum or if more bearish pressure lies ahead.
Cover image from Dall-E, charts from TradingView.
Source link
Sebastian Villafuerte
https://www.newsbtc.com/bitcoin-news/is-a-bitcoin-btc-negative-correlation-with-stocks-a-bullish-signal-analyst-reveals/
2024-08-21 22:00:37