
Over the last 30 days, Chainlink’s (LINK) price has increased by 22%. This surge, driven by a notable uptick in market interest, makes LINK one of the top gainers out of the top 20 cryptos within the same period.
As the broader market experiences a sideways movement, the question remains: will Chainlink be able to hold on to the hike?
Investor Behavior Offers Chainlink a Positive Outlook
According to IntoTheBlock, the cryptocurrency’s Coin Holding Time has climbed by 677% since the last week of July. The metric tracks investor behavior, noting whether they are selling their assets or holding on to them without transacting.
When holding time decreases, it signals that investors are selling, which could lead to a price drop. A spike in this metric, on the other hand, suggests a long-term holding approach, indicating strong confidence in the token’s future performance.
Furthermore, the noticeable spike reduces the available LINK supply for trading, potentially driving the price up.
Read more: What Is Chainlink (LINK)?
Another critical factor contributing to LINK’s positive outlook is the Market Value to Realized Value (MVRV) ratio. The MVRV ratio measures the market’s bottoms and tops while reflecting the level of unrealized profits or losses.
Uptrends in this ratio indicate a high level of unrealized profits and increase the probability that investors will book profits. When extreme, a cryptocurrency is termed overvalued, and prices might undergo a correction.
But when the MVRV ratio falls, there is a low degree of unrealized gains, signaling undervaluation. As seen in the chart below, Chainlink’s 30-day MVRV ratio is 13.56%.
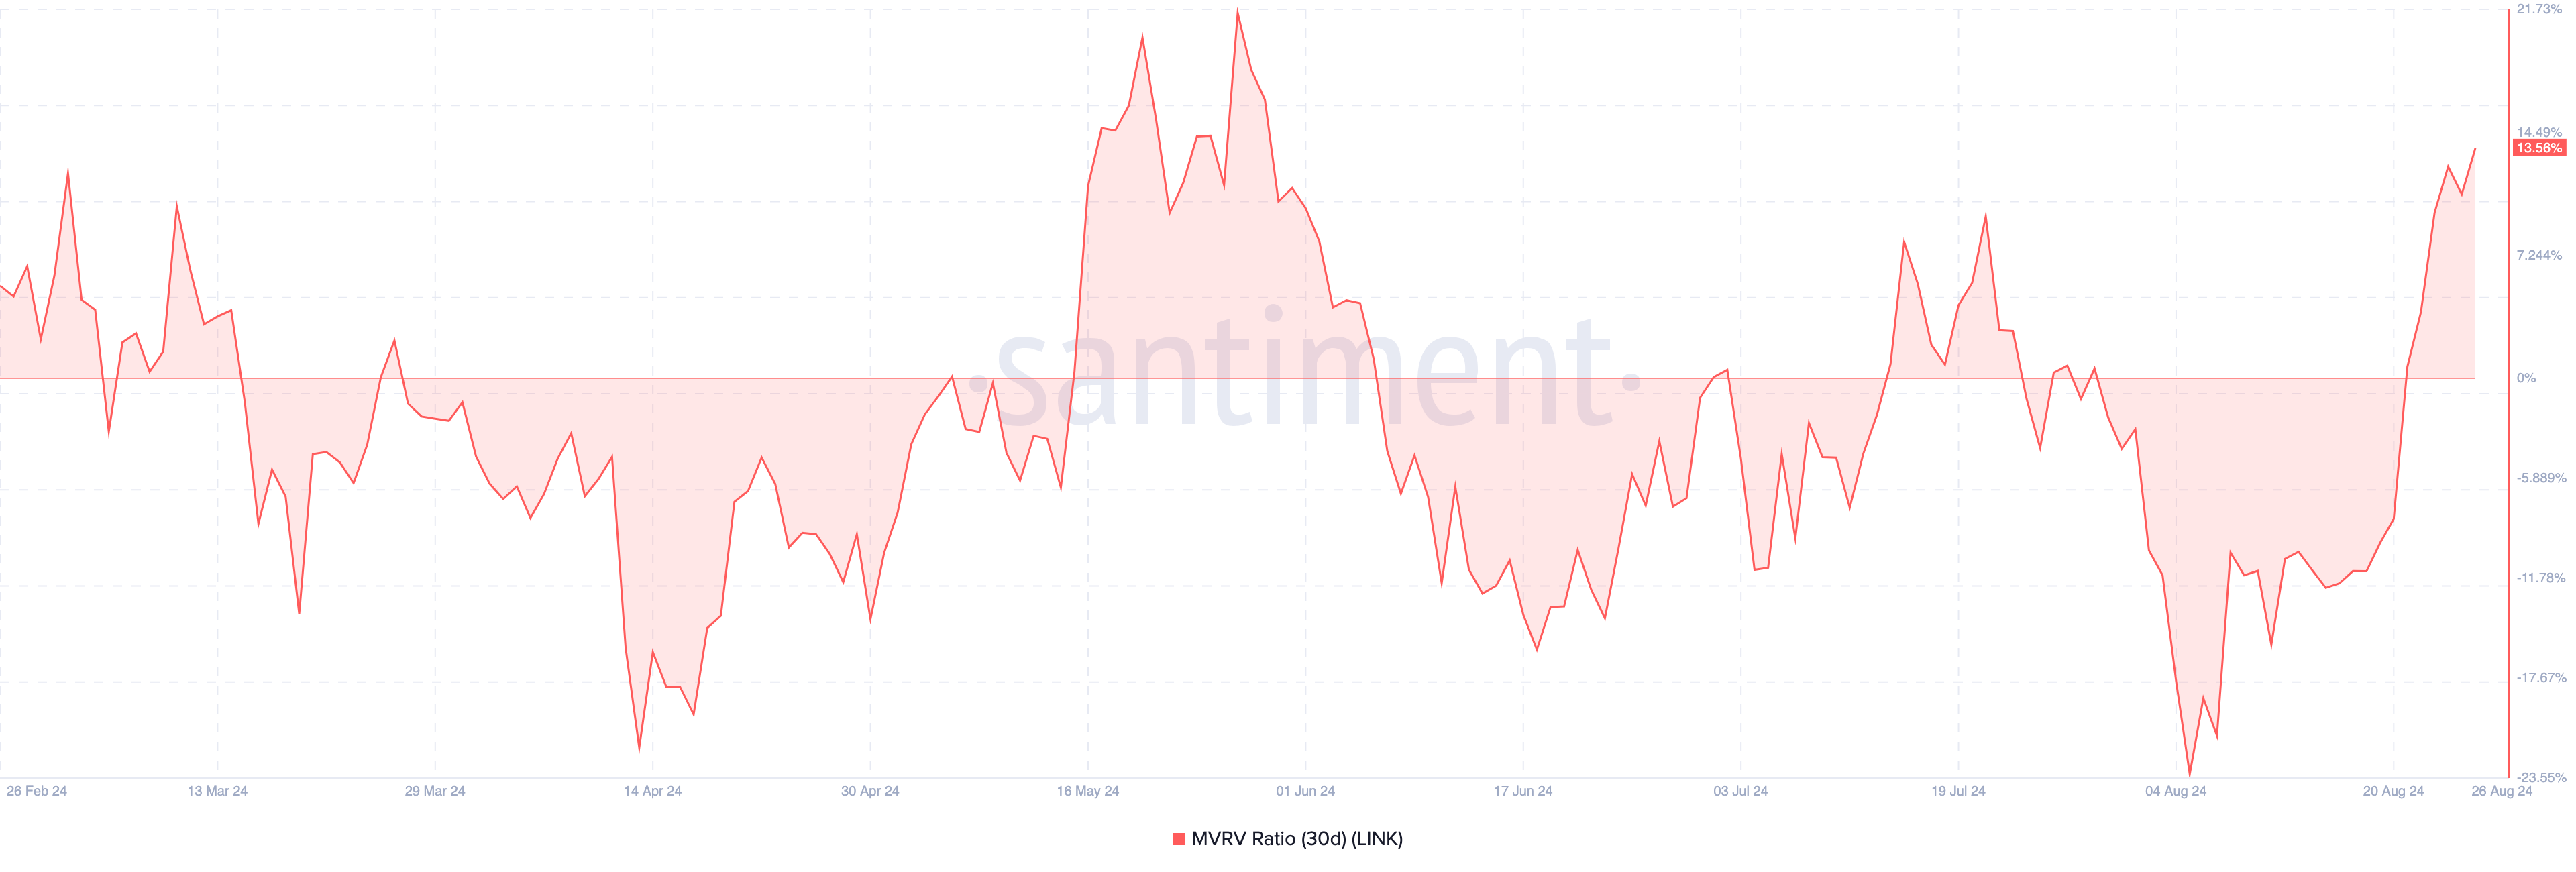
Historically, when the metric surpasses this region, it tends to go as high as 20%. If history rhymes with the current trend, LINK’s price might continue to trade much higher than $12.
LINK Price Prediction: After $12, Comes $14
On the daily chart, the Parabolic Stop-and-Reverse (SAR) reveals that LINK’s sustained uptrend might not be a false signal. As seen below, the series of dots below or above the price indicates the direction the cryptocurrency might move.
Typically, if the dots are above the price, it is a sell signal. However, at press time, the Parabolic SAR is below LINK’s value at $12.55. If this remains the same, LINK could continue increasing.
Also, the Elder Force Index (EFI) has exited negative territory and is back in the green segment. The EFI measures the strength of buyers and sellers in the market. If the reading is negative, bears are dominant.
Read more: How To Buy Chainlink (LINK) and Everything You Need To Know
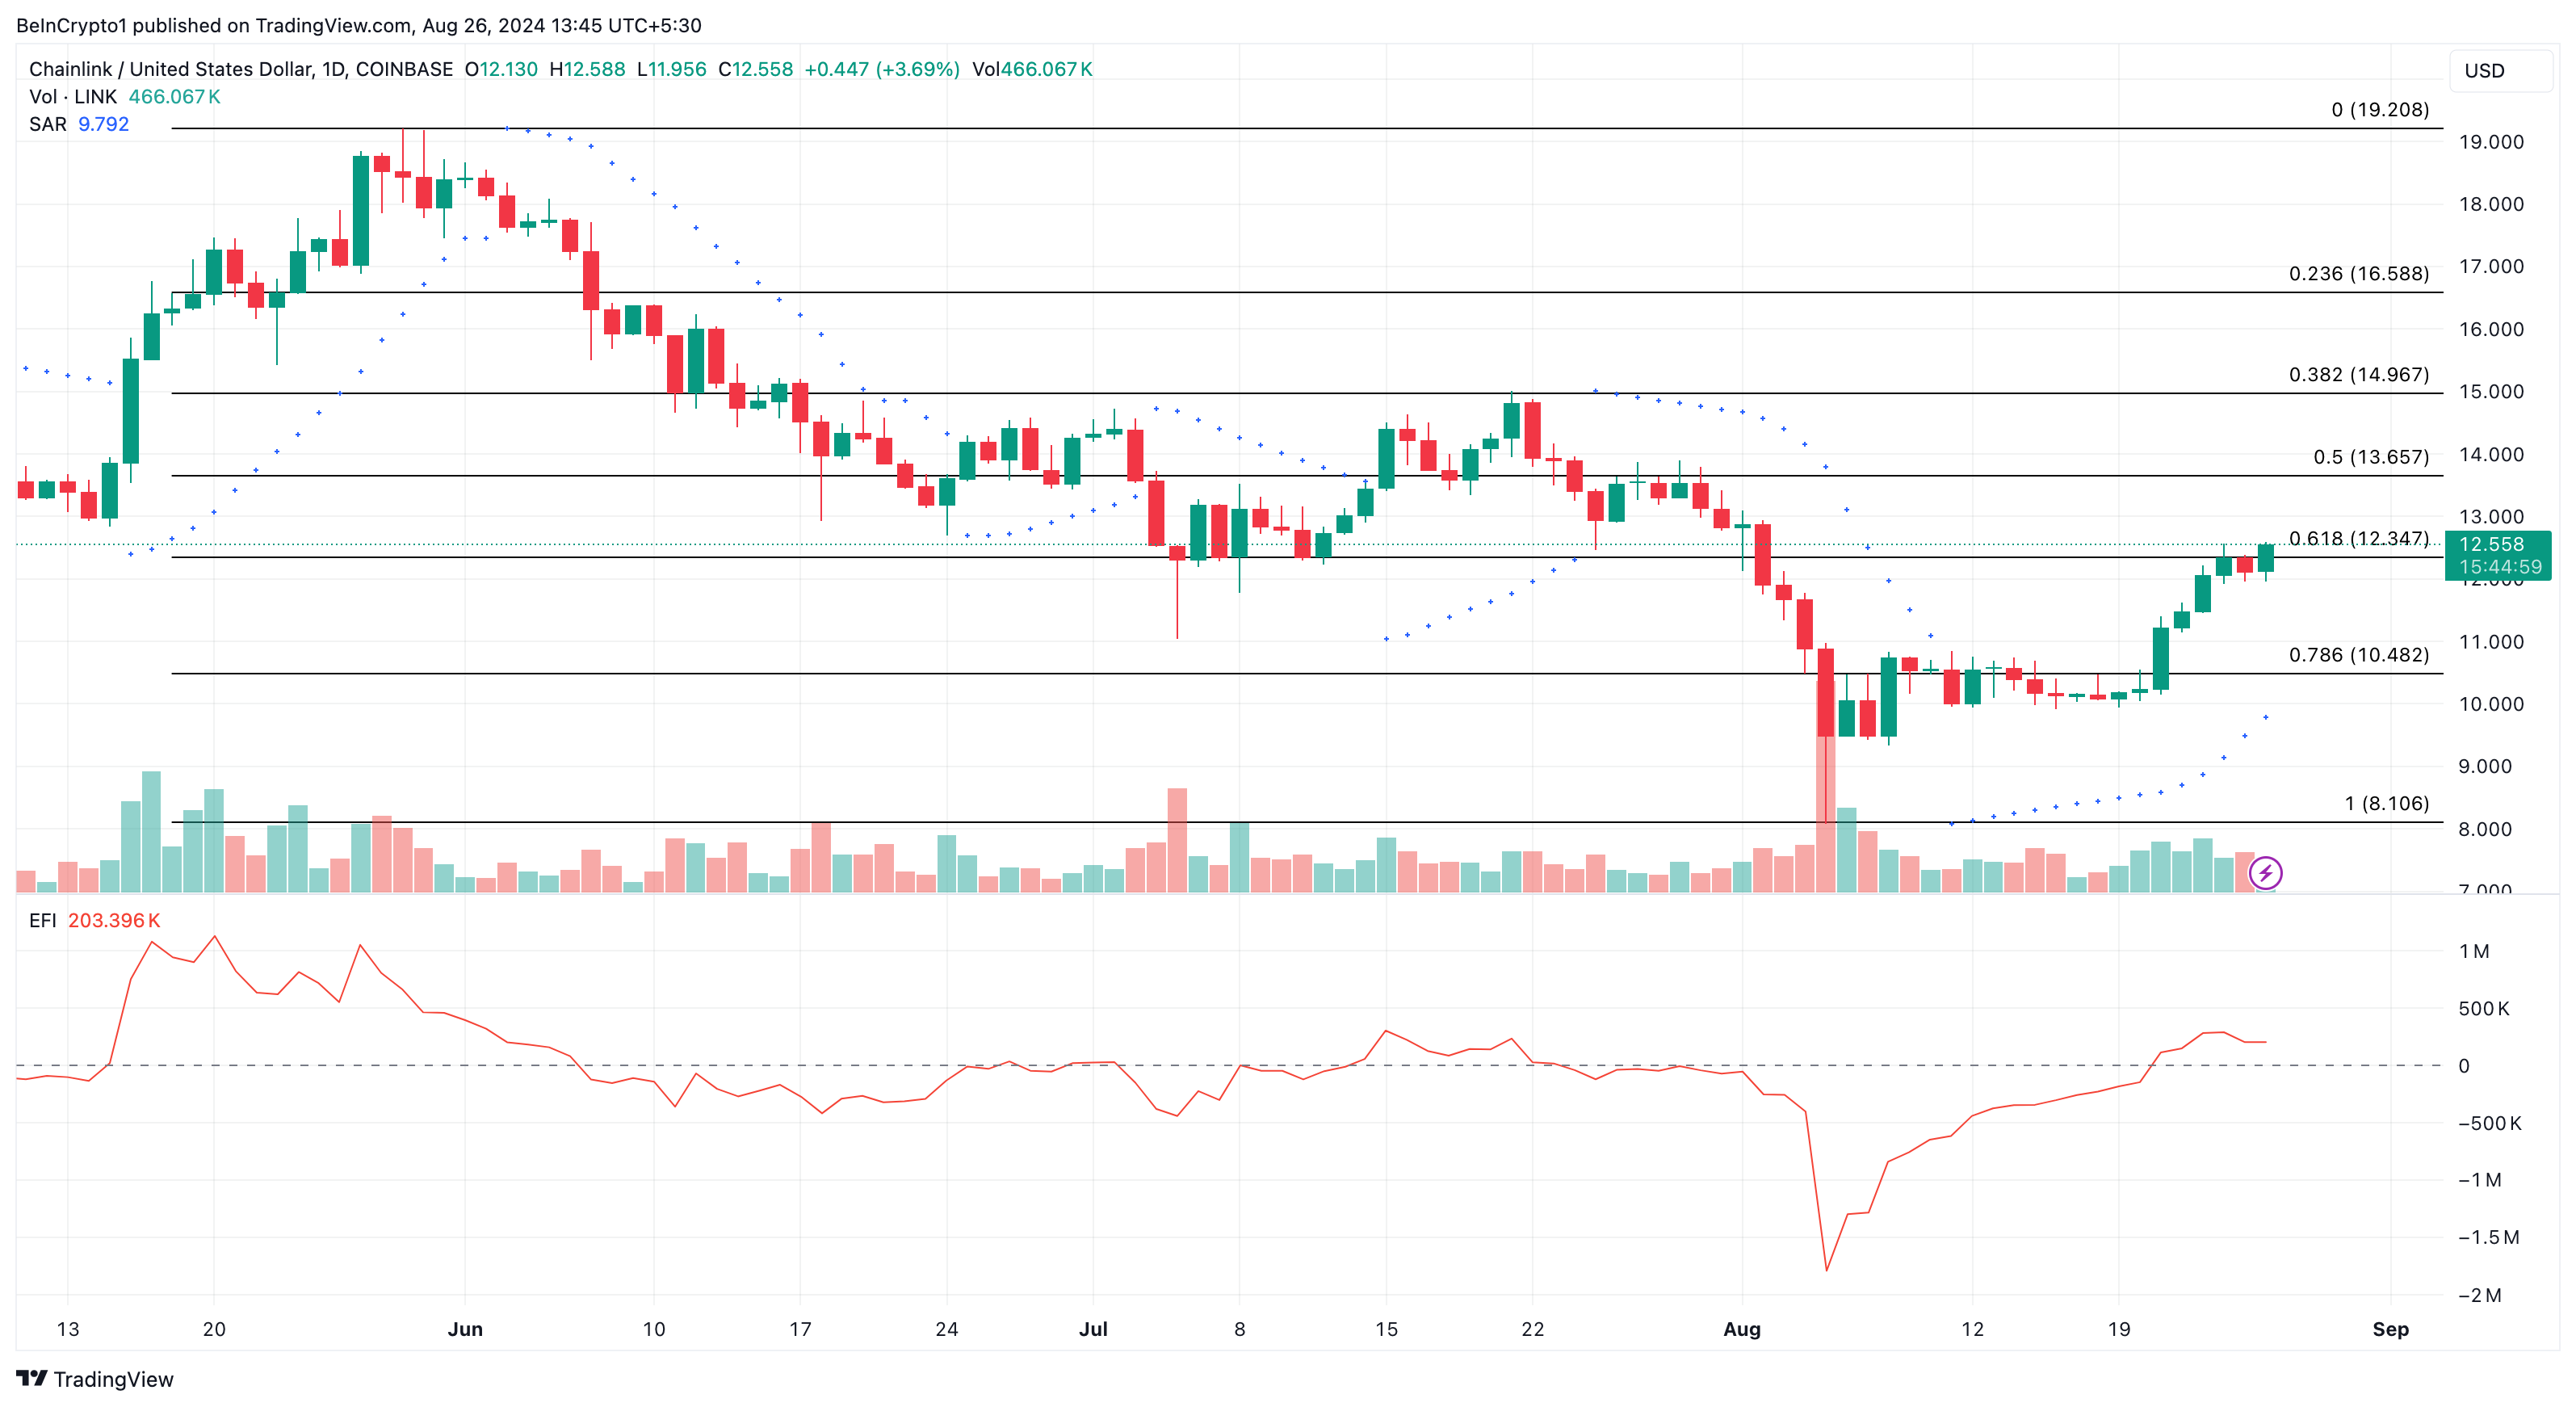
The recent rise indicates that bulls are preventing LINK bears from dragging the price down. As shown in the image above, Chainlink’s price could be poised to reach $13.65. Surpassing this level may push the cryptocurrency toward $14.96.
On the flip side, if bears manage to overpower bullish momentum, the token’s price could dip to $10.48.
Disclaimer
In line with the Trust Project guidelines, this price analysis article is for informational purposes only and should not be considered financial or investment advice. BeInCrypto is committed to accurate, unbiased reporting, but market conditions are subject to change without notice. Always conduct your own research and consult with a professional before making any financial decisions. Please note that our Terms and Conditions, Privacy Policy, and Disclaimers have been updated.
Source link
Victor Olanrewaju
https://beincrypto.com/chainlink-price-on-track-for-uptrend/
2024-08-26 11:00:00