Solana (SOL) price has experienced a strong rally, up 14.29% over the last 30 days. Despite some mixed signals in recent metrics, SOL has shown resilience, maintaining a generally bullish structure.
Indicators like the BBTrend and EMA lines suggest ongoing positive sentiment, but potential weaknesses are emerging. Whether SOL can sustain its upward momentum or faces a pullback will largely depend on how these indicators evolve in the coming days.
SOL BBTrend Is Positive
SOL’s BBTrend is currently at 4.73, maintaining a positive trend since October 12. The only exception was a brief dip into negative territory on October 29. This suggests ongoing bullish momentum for SOL despite that minor blip.
While the current BBTrend value is not as strong as the levels seen on October 23 and 24, which reached around 8 and 9, the fact that BBTrend remains positive is a promising sign for SOL holders.
Read more: 7 Best Platforms To Buy Solana (SOL) in 2024
BBTrend, or Bollinger Bands Trend, is a useful indicator that measures price strength relative to the Bollinger Bands. A positive BBTrend points to upward pressure, implying that the price is comfortably above its key averages.
Although the current value of 4.73 is lower than the recent highs, the recent upward movement suggests that buyers could be coming back into the market. This could be the result of the news of VanEck offering Solana staking to institutional investors.
Solana Current Uptrend is Not Strong Anymore
SOL’s ADX is currently at 12.3, as indicated by its DMI chart. This value suggests that the strength of the current trend is weak, implying that SOL lacks clear momentum in either direction.
With such a low ADX, traders might expect limited movement until a stronger trend emerges.

The DMI (Directional Movement Index) chart is a tool for assessing trend strength and direction. It consists of the ADX (Average Directional Index), which measures trend strength, and two directional lines: D+ and D-. The D+ line represents bullish pressure, while the D- line indicates bearish pressure.
Currently, SOL’s D+ is at 19.6, and D- is at 22.4, suggesting a slightly more bearish sentiment, with selling pressure outweighing buying pressure. This imbalance, combined with the weak ADX, implies a lack of strong trend direction at the moment.
SOL Price Prediction: Back to $194 in November?
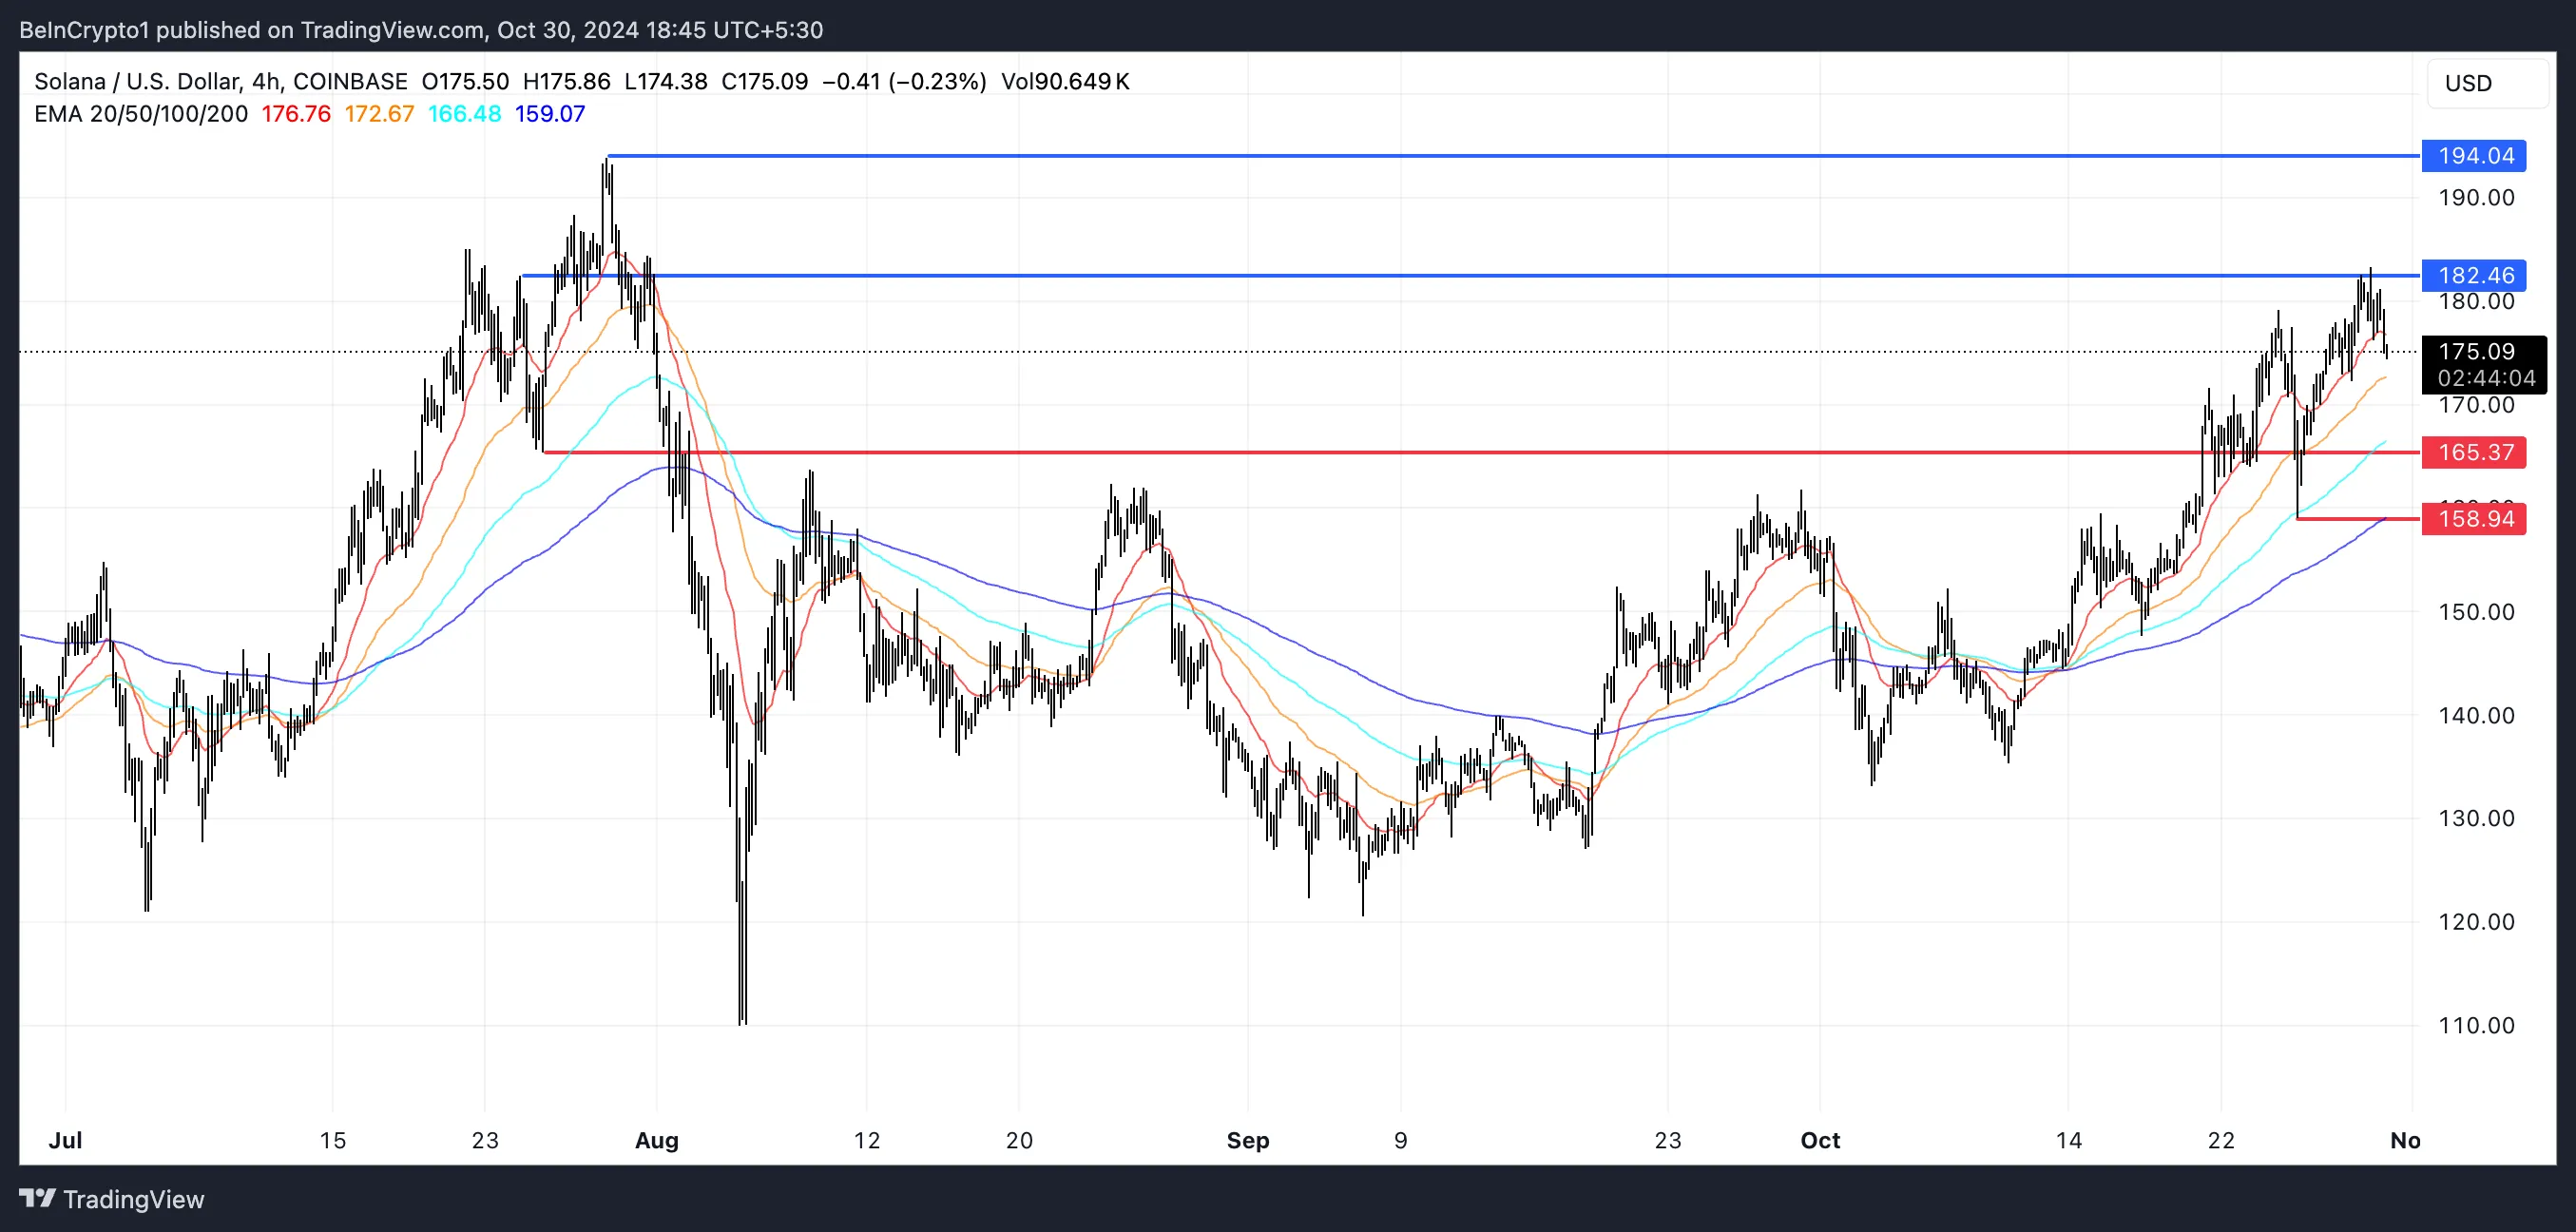
SOL’s EMA lines remain bullish, with short-term EMAs positioned above the long-term EMAs. However, the short-term lines have started to move downward slightly recently.
If this downward movement continues and the short-term EMAs cross below the long-term EMAs, it would form a “death cross,” a bearish signal indicating the potential start of a significant downtrend.
Read more: 13 Best Solana (SOL) Wallets To Consider in October 2024

If a downtrend emerges, SOL price has support levels at $165 and $158.9, suggesting a possible 9% correction if these levels are tested. Conversely, if the bullish momentum regains strength, SOL may test resistance at $182.
Should it break through this resistance, the SOL price could rise to $194, representing a 10.8% gain and reaching its highest level since late July. The next few days will be critical in determining whether SOL maintains its bullish structure or experiences a reversal.
Disclaimer
In line with the Trust Project guidelines, this price analysis article is for informational purposes only and should not be considered financial or investment advice. BeInCrypto is committed to accurate, unbiased reporting, but market conditions are subject to change without notice. Always conduct your own research and consult with a professional before making any financial decisions. Please note that our Terms and Conditions, Privacy Policy, and Disclaimers have been updated.
Source link
Tiago Amaral
https://beincrypto.com/solana-sol-price-mixed-signals/
2024-10-30 21:30:00


