Ripple has recently encountered significant selling pressure near the $0.65 resistance zone, triggering a sharp decline.
This movement signals a potential shift toward bearish dominance as the price breaks below the ascending wedge pattern’s lower boundary. XRP may continue its descent toward the $0.5 threshold in the coming sessions.
By Shayan
The Daily Chart
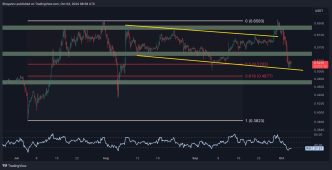
On the daily chart, XRP surged towards the ascending wedge’s upper boundary and the primary resistance zone of $0.65, only to face substantial rejection.
This area, aligning with previous swing highs, is a formidable resistance level and has halted further price increases in recent months. Following the rejection, Ripple entered the crucial price range of $0.5-$0.55, where short-term consolidation is likely to occur.
Given the break below the ascending wedge’s lower trendline, a bearish continuation is expected. If XRP attempts a pullback to retest the broken wedge, the price could face more selling pressure, potentially driving it toward lower thresholds, particularly the $0.5 support level.
The 4-Hour Chart
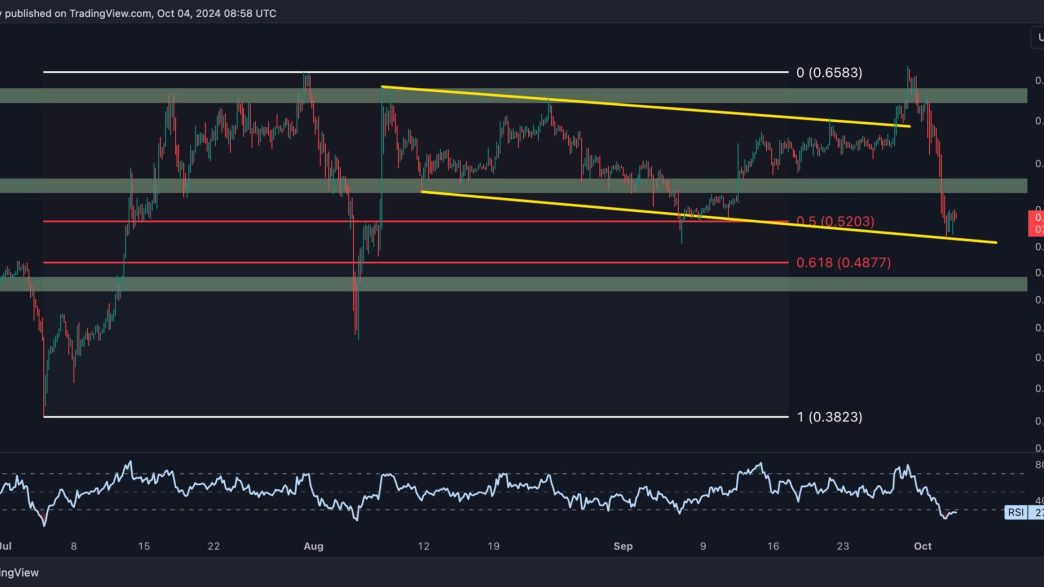
The 4-hour chart reveals a false breakout after Ripple briefly surpassed the $0.65 level. This move brought in substantial demand, but the surge was met with intense selling pressure, leading to a sharp reversal.
XRP’s price quickly fell back inside the flag pattern from which it had broken out.
Currently, the cryptocurrency is testing a critical support region marked by the flag’s lower trendline and the Fibonacci retracement levels of 0.5 ($0.52) and 0.618 ($0.48). This range is expected to hold the price temporarily, leading to a potential short-term bullish corrective move and sideways consolidation before the next major trend direction is established.
Binance Free $600 (CryptoPotato Exclusive): Use this link to register a new account and receive $600 exclusive welcome offer on Binance (full details).
LIMITED OFFER 2024 at BYDFi Exchange: Up to $2,888 welcome reward, use this link to register and open a 100 USDT-M position for free!
Disclaimer: Information found on CryptoPotato is those of writers quoted. It does not represent the opinions of CryptoPotato on whether to buy, sell, or hold any investments. You are advised to conduct your own research before making any investment decisions. Use provided information at your own risk. See Disclaimer for more information.
Cryptocurrency charts by TradingView.
Source link
CryptoVizArt
https://cryptopotato.com/ripple-price-analysis-is-xrp-headed-to-a-crash-below-0-50/
2024-10-04 12:56:23

