

Mantle (MNT) is down more than 10% following the Bybit hack, where roughly $174 million of cmETH – a Mantle-based coin providing liquidity for ETH in the MNT ecosystem – was stolen. The hack, linked to the North Korean Lazarus Group, triggered panic selling, causing MNT’s Relative Strength Index (RSI) to plummet to oversold levels.
Although MNT’s RSI has since rebounded to 39.9, it remains in bearish territory, reflecting cautious sentiment. Additionally, MNT’s Chaikin Money Flow (CMF) is trying to recover but is still deeply negative, while its Exponential Moving Average (EMA) lines suggest persistent downward momentum.
MNT RSI Touched Strong Oversold Levels After Bybit’s Hack
Mantle’s RSI dropped sharply from 54.7 to 22.9 within a few hours following the Bybit hack, where the North Korean hacking group Lazarus stole $1.5 billion, making it the biggest crypto hack ever. Among the assets stolen was cmETH, a Mantle-based coin providing liquidity for ETH in the MNT ecosystem.
This massive outflow of funds triggered panic selling, leading to a significant decline in MNT’s Relative Strength Index (RSI). RSI is a momentum oscillator that measures the speed and change of price movements, typically ranging from 0 to 100.
It is commonly used to identify overbought or oversold conditions, with values above 70 indicating overbought conditions and below 30 suggesting oversold territory. Mantle’s RSI plummeting to 22.9 signaled extreme overselling, reflecting intense bearish sentiment amid the fallout from the hack.
Following this sharp decline, Mantle’s RSI has rebounded to 39.9, showing signs of recovery in the last few hours. An RSI below 30 generally indicates that an asset is oversold and could be due for a price bounce as selling pressure wanes.
Now, with RSI approaching the neutral zone (30-50 range), it suggests that the extreme selling momentum has eased, potentially attracting bargain-hunters or bottom-fishers. If RSI continues to rise, it could indicate growing bullish momentum and a possible reversal in MNT’s price trend.
However, if RSI fails to break above the 50 threshold, it could signify continued uncertainty and a lack of buying strength, leaving MNT vulnerable to further downside risk.
Mantle CMF Is Trying to Recover, But It’s Still Very Negative
MNT’s Chaikin Money Flow (CMF) was already in negative territory before the Bybit hack, reflecting a bearish trend and selling pressure. However, following the hack, MNT’s CMF plunged even further, reaching a negative peak of -0.35 yesterday.
CMF is an indicator that measures the volume-weighted average of accumulation and distribution over a set period. It ranges from -1 to 1, with positive values suggesting buying pressure and accumulation, while negative values indicate selling pressure and distribution.
The sharp decline to -0.35 signaled intense outflows from Mantle. That confirms significant selling momentum amid the heightened market fear and uncertainty triggered by the hack.
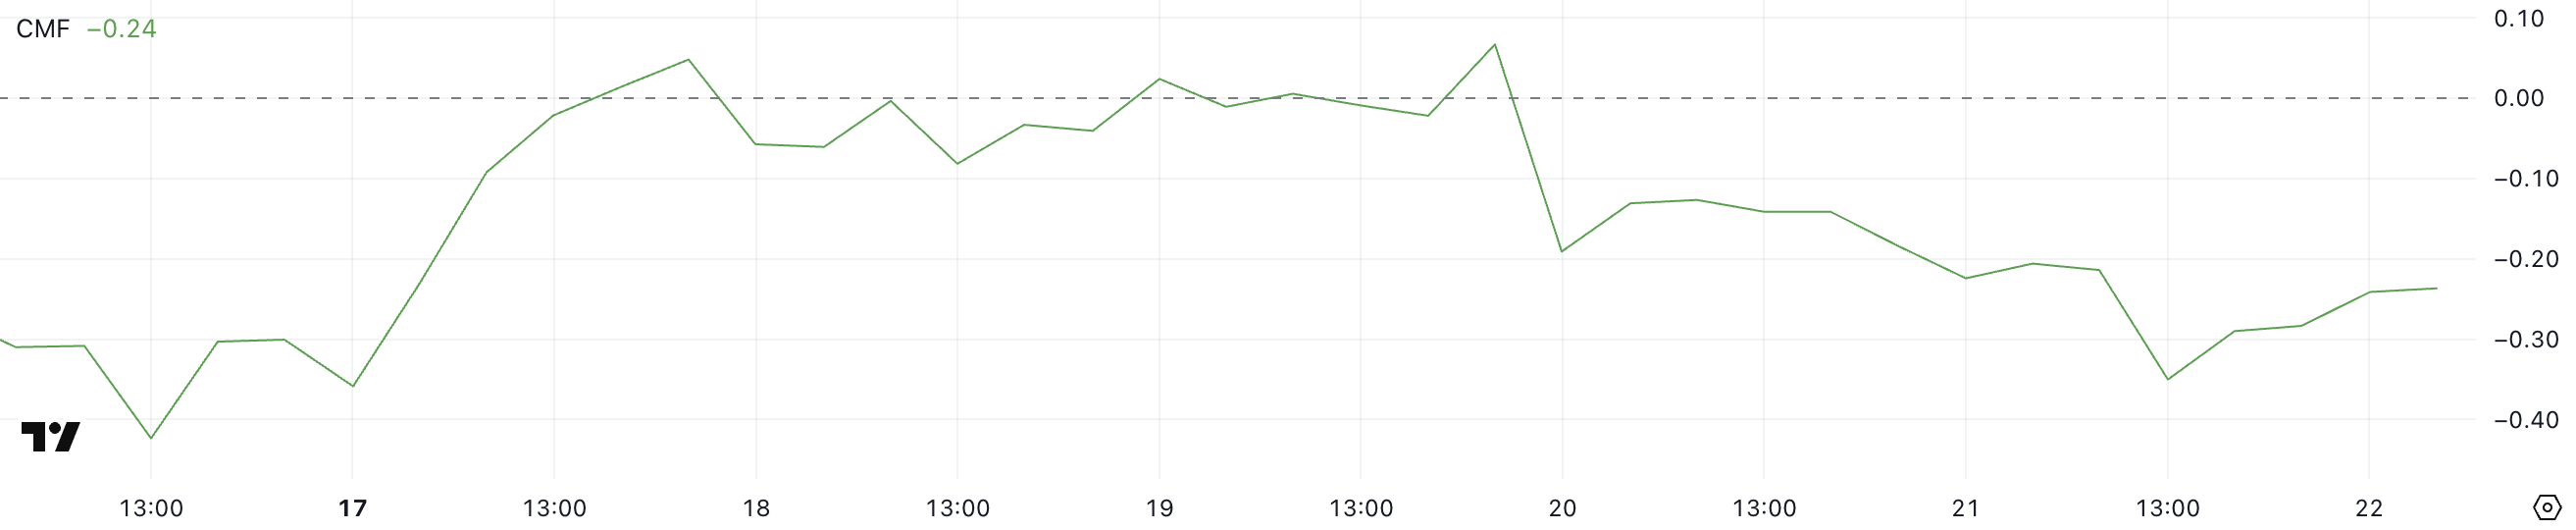
After reaching this negative peak, MNT’s CMF has started to recover, currently sitting at -0.24. Although still far from turning positive, this upward movement suggests that selling pressure is gradually easing.
A rising CMF, even while negative, can indicate that bearish momentum is losing steam. If buying volume continues to increase, that could potentially pave the way for a price stabilization or even a reversal. However, as long as CMF remains in negative territory, MNT price is likely to face resistance.
A shift to positive CMF would be a more convincing sign of bullish sentiment returning. That could signal a stronger likelihood of a price recovery.
Mantle Dropped Below $1 For the First Time Since Early February
MNT’s Exponential Moving Average (EMA) lines are currently very bearish, with all short-term EMAs below the long-term ones. This setup indicates strong downward momentum, as recent prices are weaker compared to historical trends.
If this bearish trend continues, MNT could test the support at $0.81.
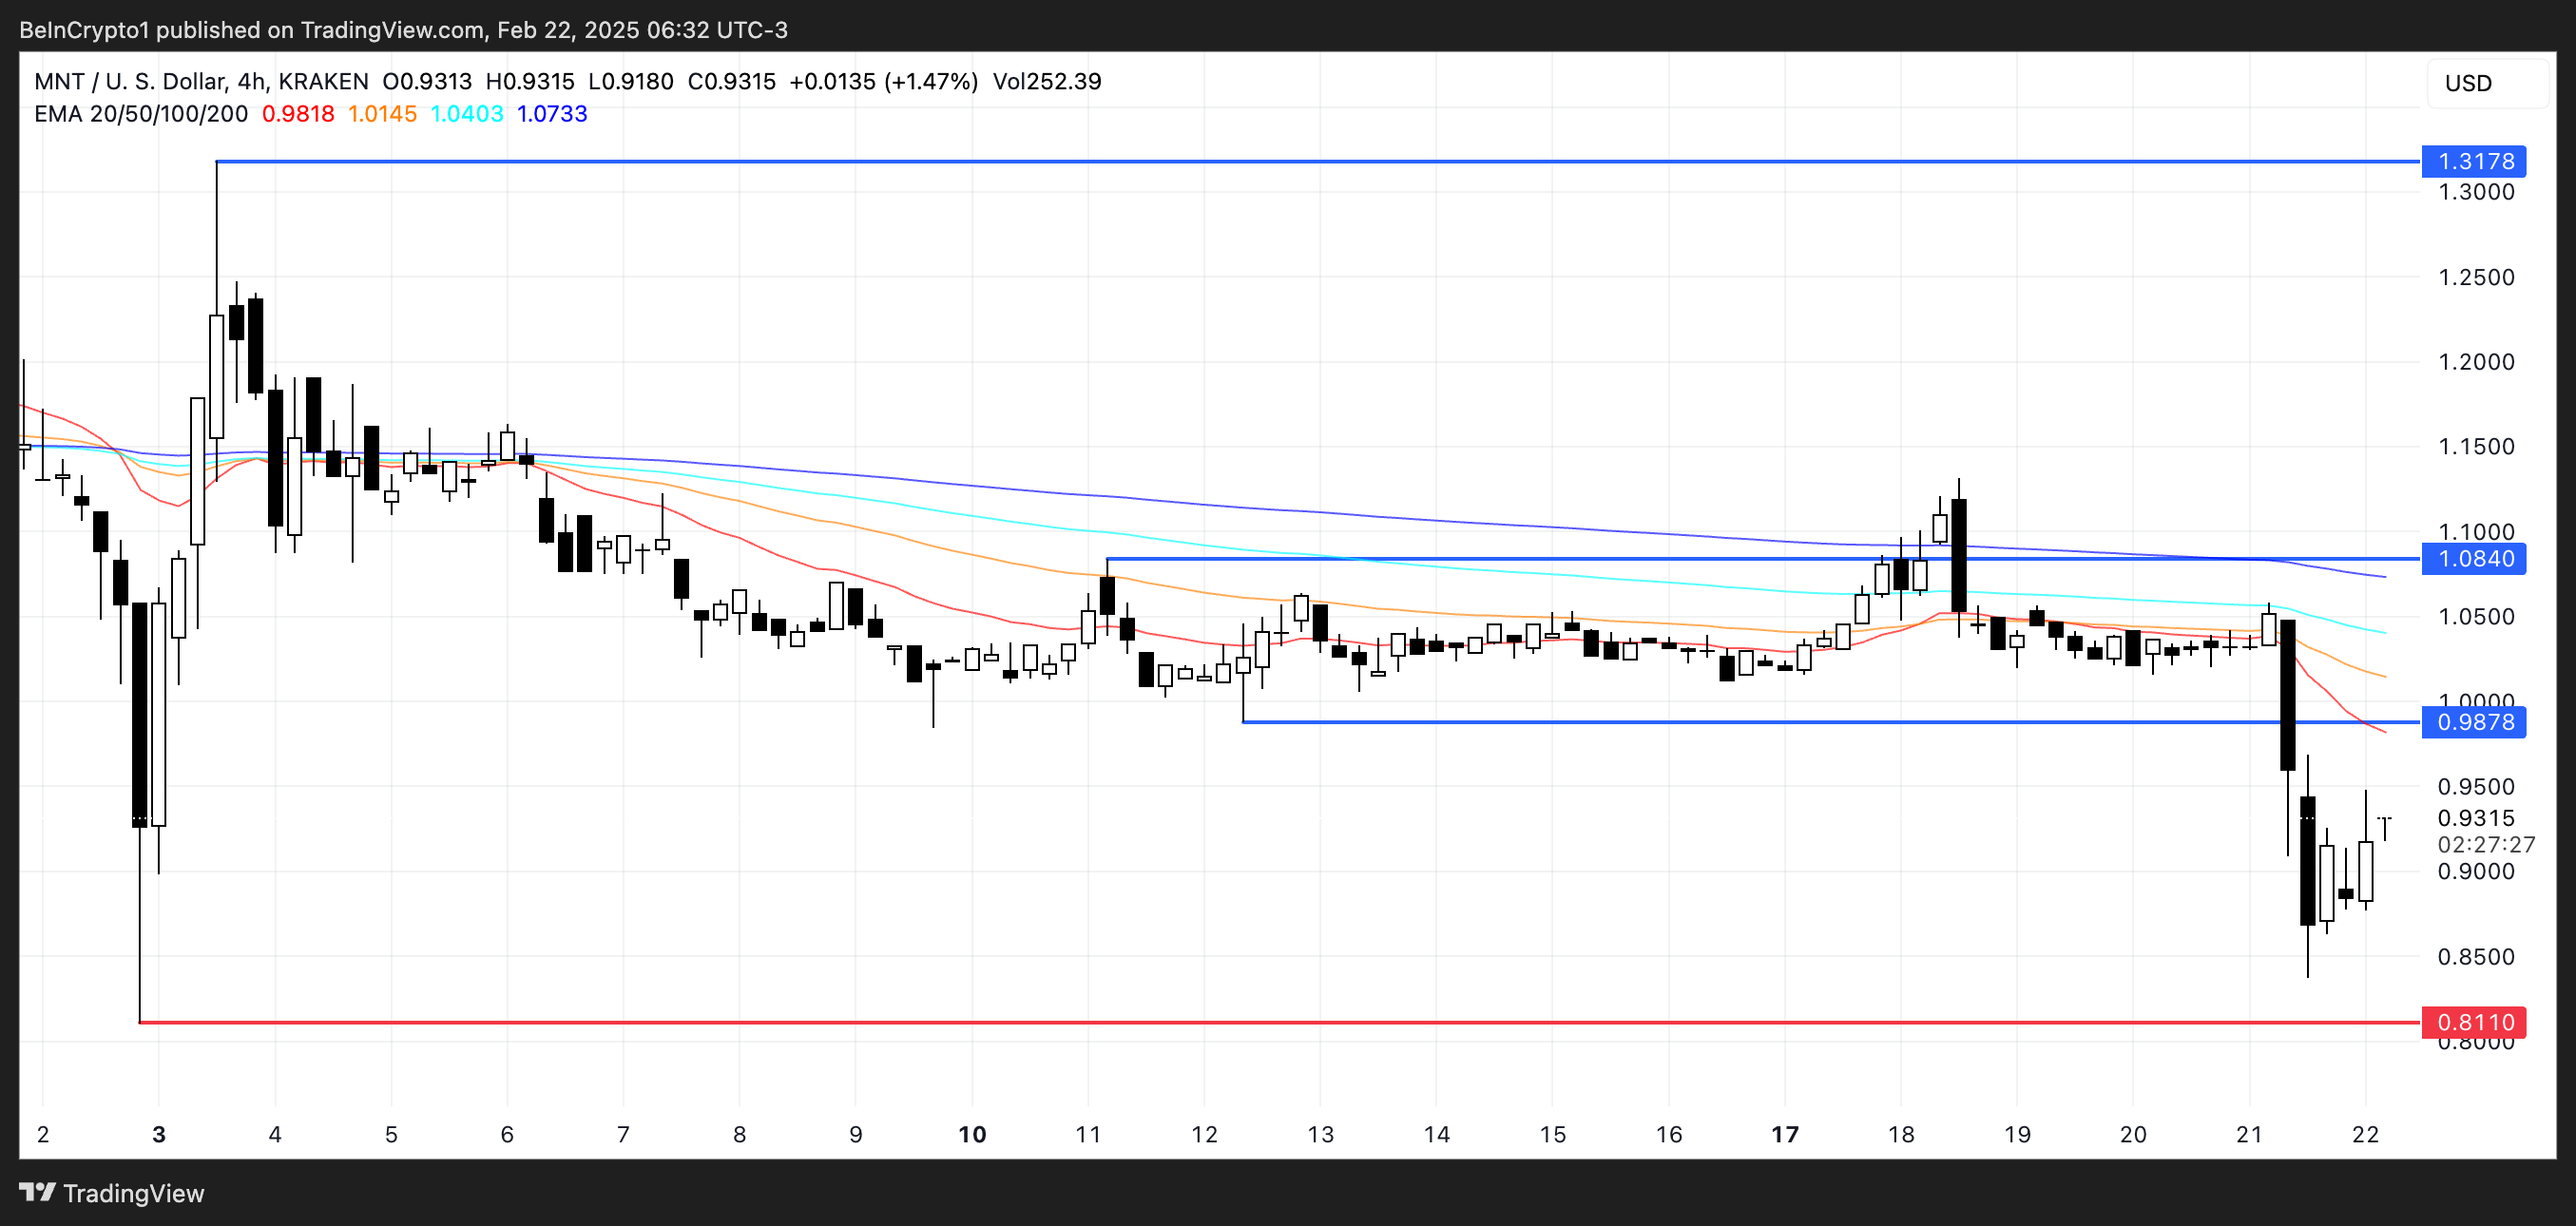
On the other hand, if Mantle starts to recover from the recent drop, it could test the resistance at $0.98. If this level is broken, the next target would be $1.08.
A strong uptrend could push MNT to $1.31, representing a potential 41% upside. However, for this bullish scenario to unfold, short-term EMAs would need to cross above long-term ones, signaling renewed buying momentum.
Disclaimer
In line with the Trust Project guidelines, this price analysis article is for informational purposes only and should not be considered financial or investment advice. BeInCrypto is committed to accurate, unbiased reporting, but market conditions are subject to change without notice. Always conduct your own research and consult with a professional before making any financial decisions. Please note that our Terms and Conditions, Privacy Policy, and Disclaimers have been updated.
Source link
Tiago Amaral
https://beincrypto.com/mantle-price-drops-after-bybit-hack/
2025-02-22 11:18:54