

Tron (TRX) price is currently exhibiting signs of bullish momentum; however, its price is down, while all the other biggest coins in the market are positive today.
While various indicators show a bullish outlook, there are also signals that point to an important possible turning point for TRX.
TRX Ichimoku Cloud Shows a Bullish Momentum
The Ichimoku Cloud chart for TRX price reveals a generally favorable outlook. Currently, TRX price remains above the Kumo (cloud), which is typically a positive signal for bullish sentiment. The cloud itself is moderately thick, suggesting a reasonable level of support below the current price if a retracement were to occur.
Additionally, the green Senkou Span A, above the red Senkou Span B, forms a bullish cloud ahead, reinforcing optimism for further gains. The Kijun-sen (red line) lies below the current price, offering support, though its flat trajectory hints at a pause in momentum.
Meanwhile, the Tenkan-sen (blue line) closely follows price action, maintaining a positive outlook for short-term momentum, though a potential bearish signal could arise if it crosses below the Kijun-sen.
Read more: 7 Best Tron Wallets for Storing TRX
The Chikou Span (green lagging line), which is positioned above the price level from 26 periods ago, further confirms that TRX’s current trend is backed by positive momentum. However, as the Chikou Span nears the current price level, it signals that the ongoing bullish momentum might face challenges and could enter a consolidation phase.
While the broader sentiment for TRX remains bullish, the asset appears to be at a pivotal point, requiring either a breakout above resistance or strong support to sustain its upward trajectory.
DMI Suggests Moderate Trend Strength
The Directional Movement Index (DMI) for Tron (TRX) provides valuable insights into the current trend strength. The yellow line, representing the Average Directional Index (ADX), is currently around 23.8, suggesting a moderate trend strength, though not particularly strong.
The blue line (+DI), which measures the strength of positive price movements, is at 11.3, indicating relatively weak buying pressure at this point. Meanwhile, the red line (-DI), which measures the strength of negative price movements, is slightly higher at 13.3, suggesting that selling pressure currently outweighs buying pressure, though not by a significant margin.
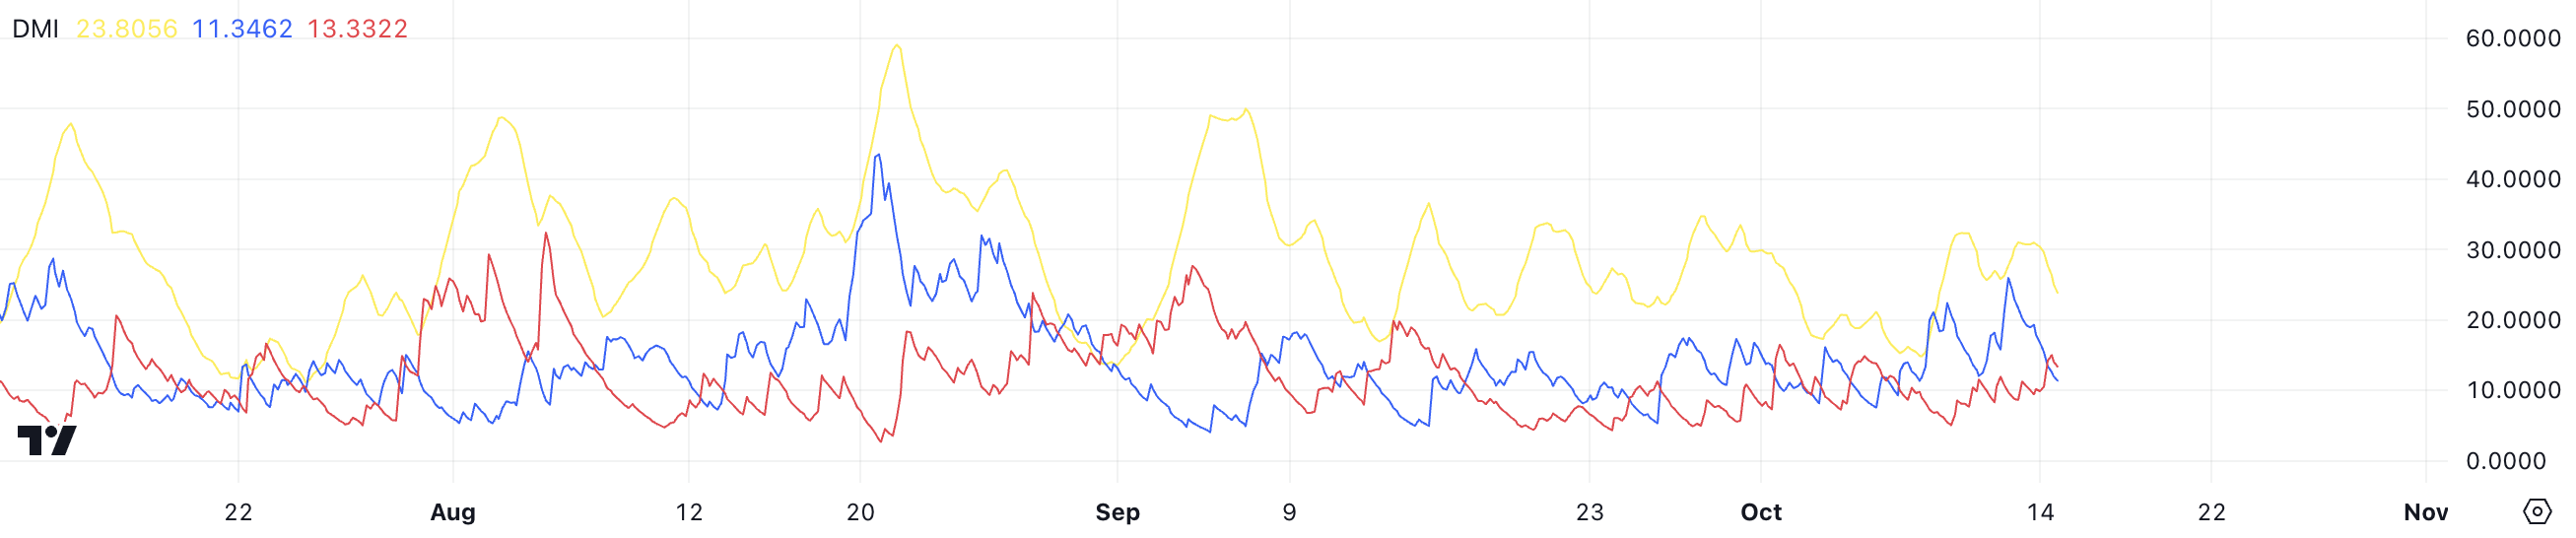
The ADX, which has fluctuated considerably in recent months, shows that TRX’s trend strength has varied, with some periods of high volatility followed by more subdued phases. The current positioning of the +DI and -DI lines below 20 indicates a lack of significant momentum for either bulls or bears, pointing to a range-bound or consolidative period.
For TRX to regain a more decisive upward trajectory, the +DI would need to cross above the -DI, combined with an increase in the ADX value above 25, to signal a strengthening trend. Overall, the DMI suggests that while the broader sentiment is slightly bearish, there is room for a potential shift, contingent on increased buying pressure and an improvement in trend strength.
TRX Price Prediction: Potential Trend Reversal in Play
TRX’s EMA lines are currently showing a bullish pattern, with short-term EMAs positioned above the long-term EMAs. This setup typically indicates positive momentum and a continuation of the uptrend.
However, the short-term EMA lines are starting to turn downward. This could suggest a potential reversal of the current trend. If this downward shift continues, it may indicate a weakening of buying pressure and a transition toward a more bearish phase for TRX.
Exponential Moving Averages (EMAs) are a type of moving average that gives more weight to recent data, making them more responsive to the latest price movements compared to Simple Moving Averages (SMAs). Short-term EMA lines reflect recent price behavior, while long-term EMA lines provide a broader view of the overall trend.
Read More: TRON (TRX) Price Prediction 2024/2025/2030
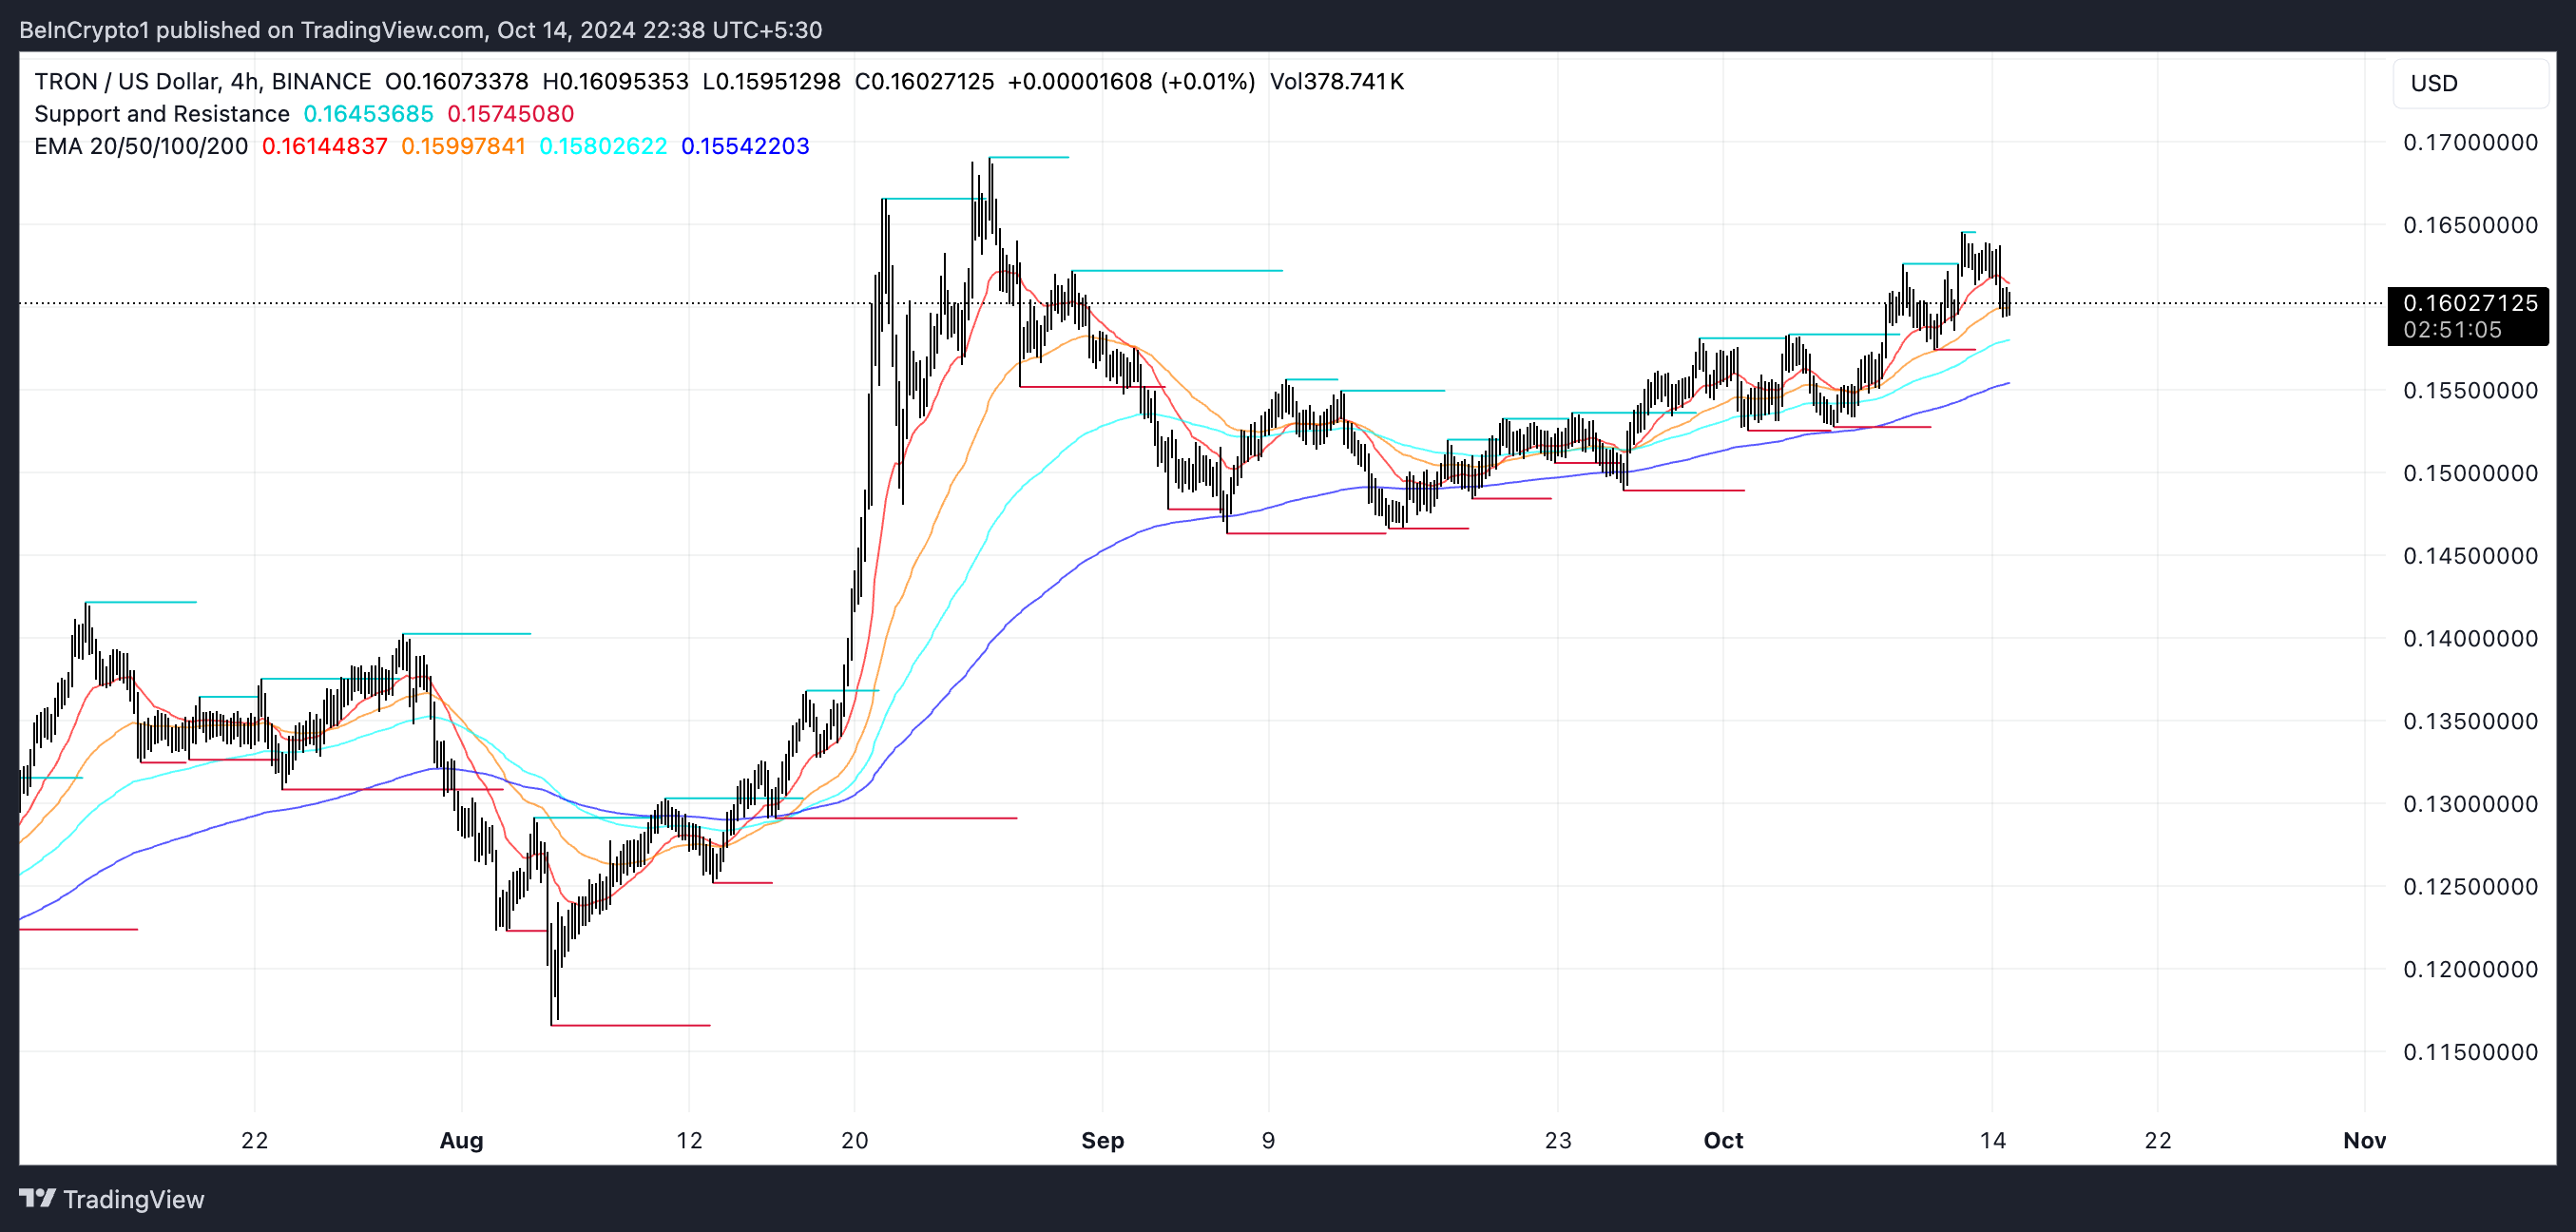
If the uptrend continues, TRX will likely test its next resistances at $0.166 and potentially even $0.169, suggesting room for further gains if buying pressure strengthens.
However, if the trend reverses, as implied by the recent movement of the EMA lines, TRX may test support levels at $0.155, $0.152, or even as low as $0.1462. These support zones could play a crucial role in determining whether the bearish momentum deepens or if a rebound is possible.
Disclaimer
In line with the Trust Project guidelines, this price analysis article is for informational purposes only and should not be considered financial or investment advice. BeInCrypto is committed to accurate, unbiased reporting, but market conditions are subject to change without notice. Always conduct your own research and consult with a professional before making any financial decisions. Please note that our Terms and Conditions, Privacy Policy, and Disclaimers have been updated.
Source link
Tiago Amaral
https://beincrypto.com/trx-price-approaching-crucial-levels/
2024-10-14 23:00:00