Optimism (OP) price has surged 43.40% in the last seven days, showcasing strong bullish momentum in the market. The uptrend is supported by rising trend strength, with the ADX confirming growing momentum and EMA lines showing a bullish setup.
Despite the rally, a declining trend in daily active addresses suggests caution, as it may indicate reduced network activity and potential pressure on OP’s price. Whether OP can sustain this momentum to test resistance at $3 or face a deeper correction depends on the strength of buyer interest in the coming days.
OP Current Uptrend Is Strong
Optimism currently has an ADX of 28.7, a significant surge from below 15 just a day ago. The sharp rise in ADX indicates that the strength of OP’s current trend is increasing fast, signaling growing momentum behind the price movement.
The ADX measures trend strength, with values above 25 indicating a strong trend and below 20 suggesting a weak or nonexistent trend. At 28.7, OP’s ADX confirms that its uptrend is gaining traction and could sustain further upward momentum if this strength persists.
The positive directional index (D+) is at 38.8, while the negative directional index (D-) is at 9.37, showing that bullish pressure far outweighs bearish activity. This large gap between D+ and D- reflects strong buyer dominance, reinforcing the uptrend.
The combination of a rising ADX and a high D+ suggests that OP’s price could continue climbing as long as market conditions remain favorable and buying pressure persists.
OP Daily Active Addresses Bring An Important Signal
OP 7-day moving average of daily active addresses was 14,200 as of November 21.
This metric reflects the number of unique wallet interactions with the network, which indicates continued strong activity but is down from the yearly peak of 26,300 on October 13.
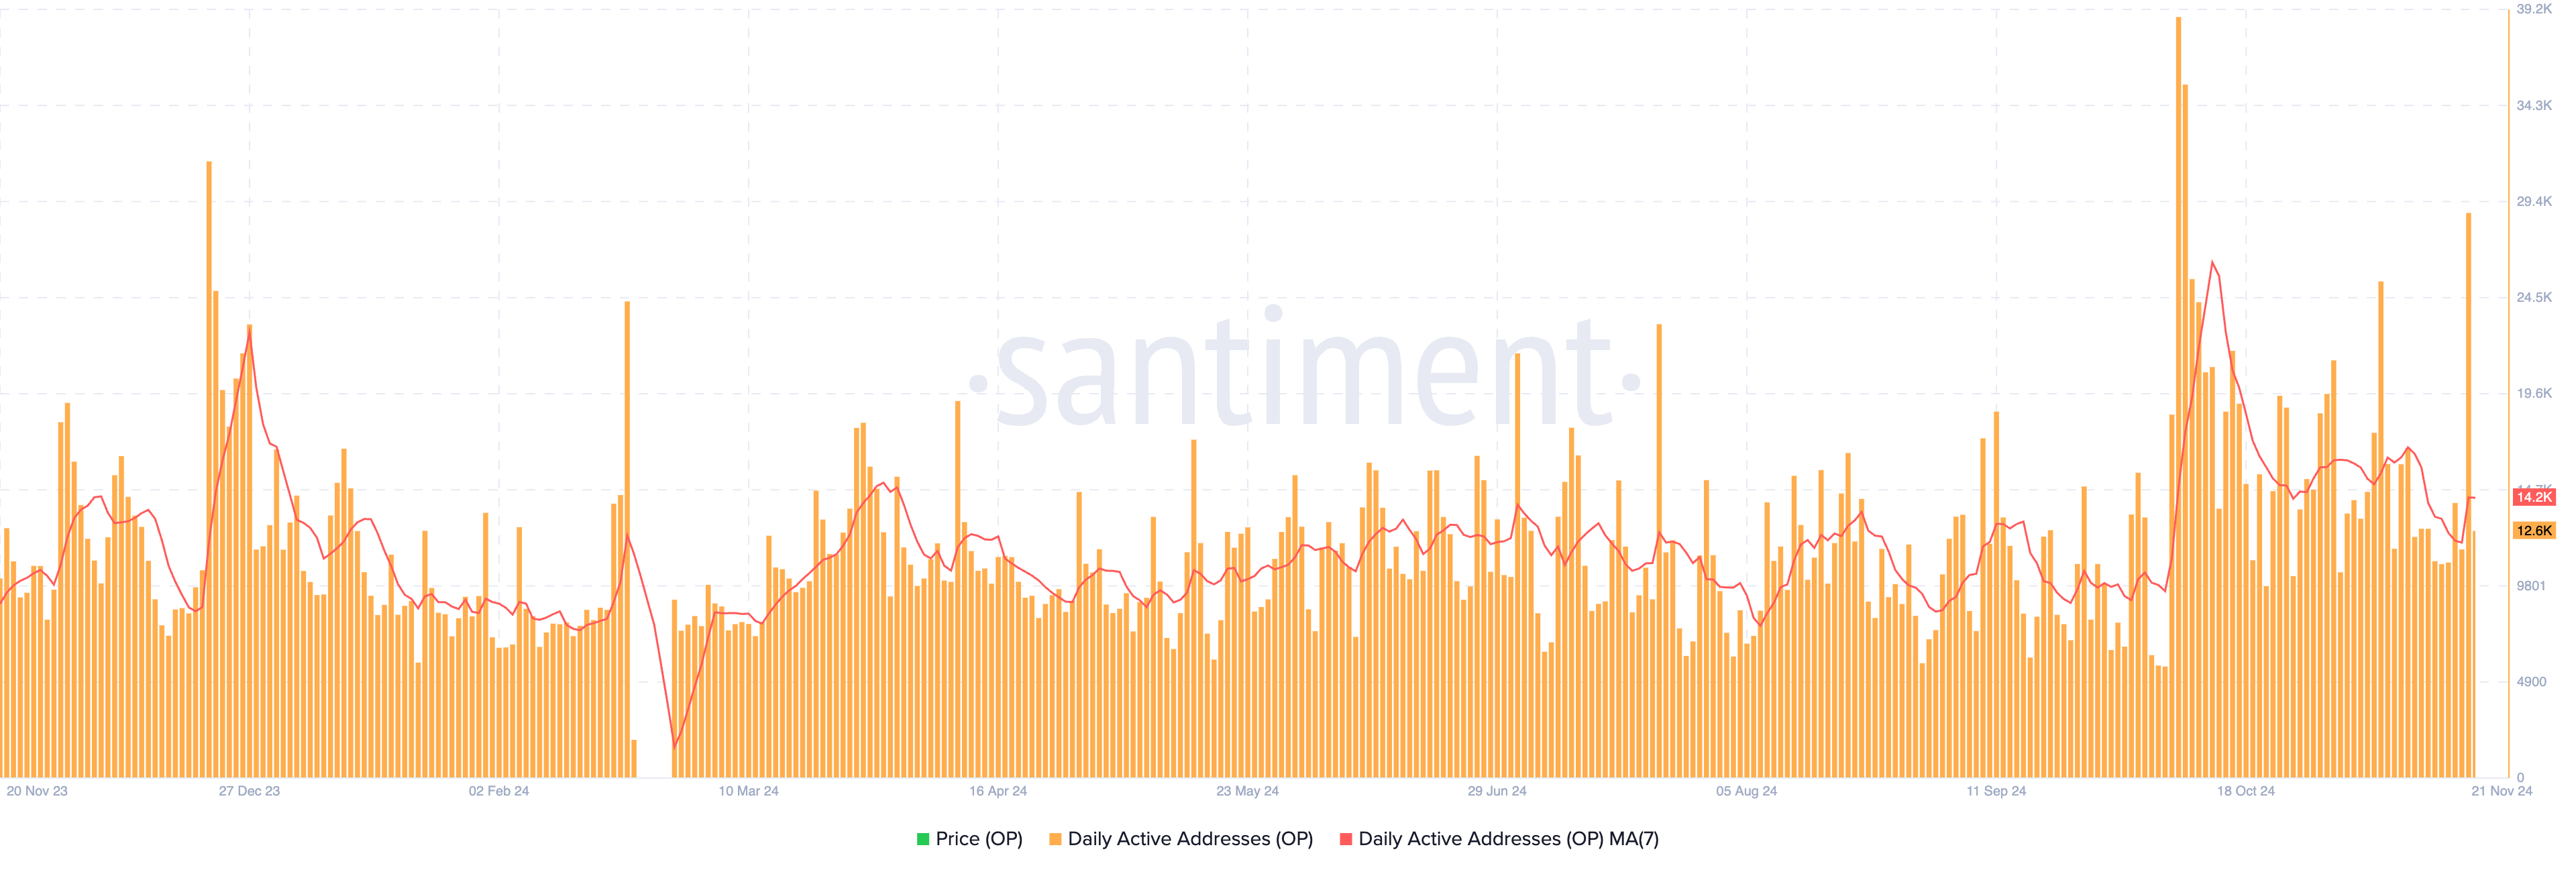
Daily active addresses are a crucial metric because they provide insights into network usage and overall demand. A decreasing trend in this metric may signal waning interest or reduced activity on the network, which could translate into lower buying pressure for OP.
If the trend continues to decline, it may exert downward pressure on OP price as market enthusiasm fades. However, a reversal in this metric could reignite bullish sentiment and support future price growth.
Optimism Price Prediction: Can OP Reach $3 In November?
If Optimism price maintains its uptrend, it could test the next resistance levels at $2.55 and potentially $3.04. Breaking above $3.04 could pave the way for OP price to challenge $3.41, its highest price since April.
This bullish scenario is supported by the EMA lines, which show a favorable setup with short-term lines positioned above the long-term ones, indicating strong momentum.
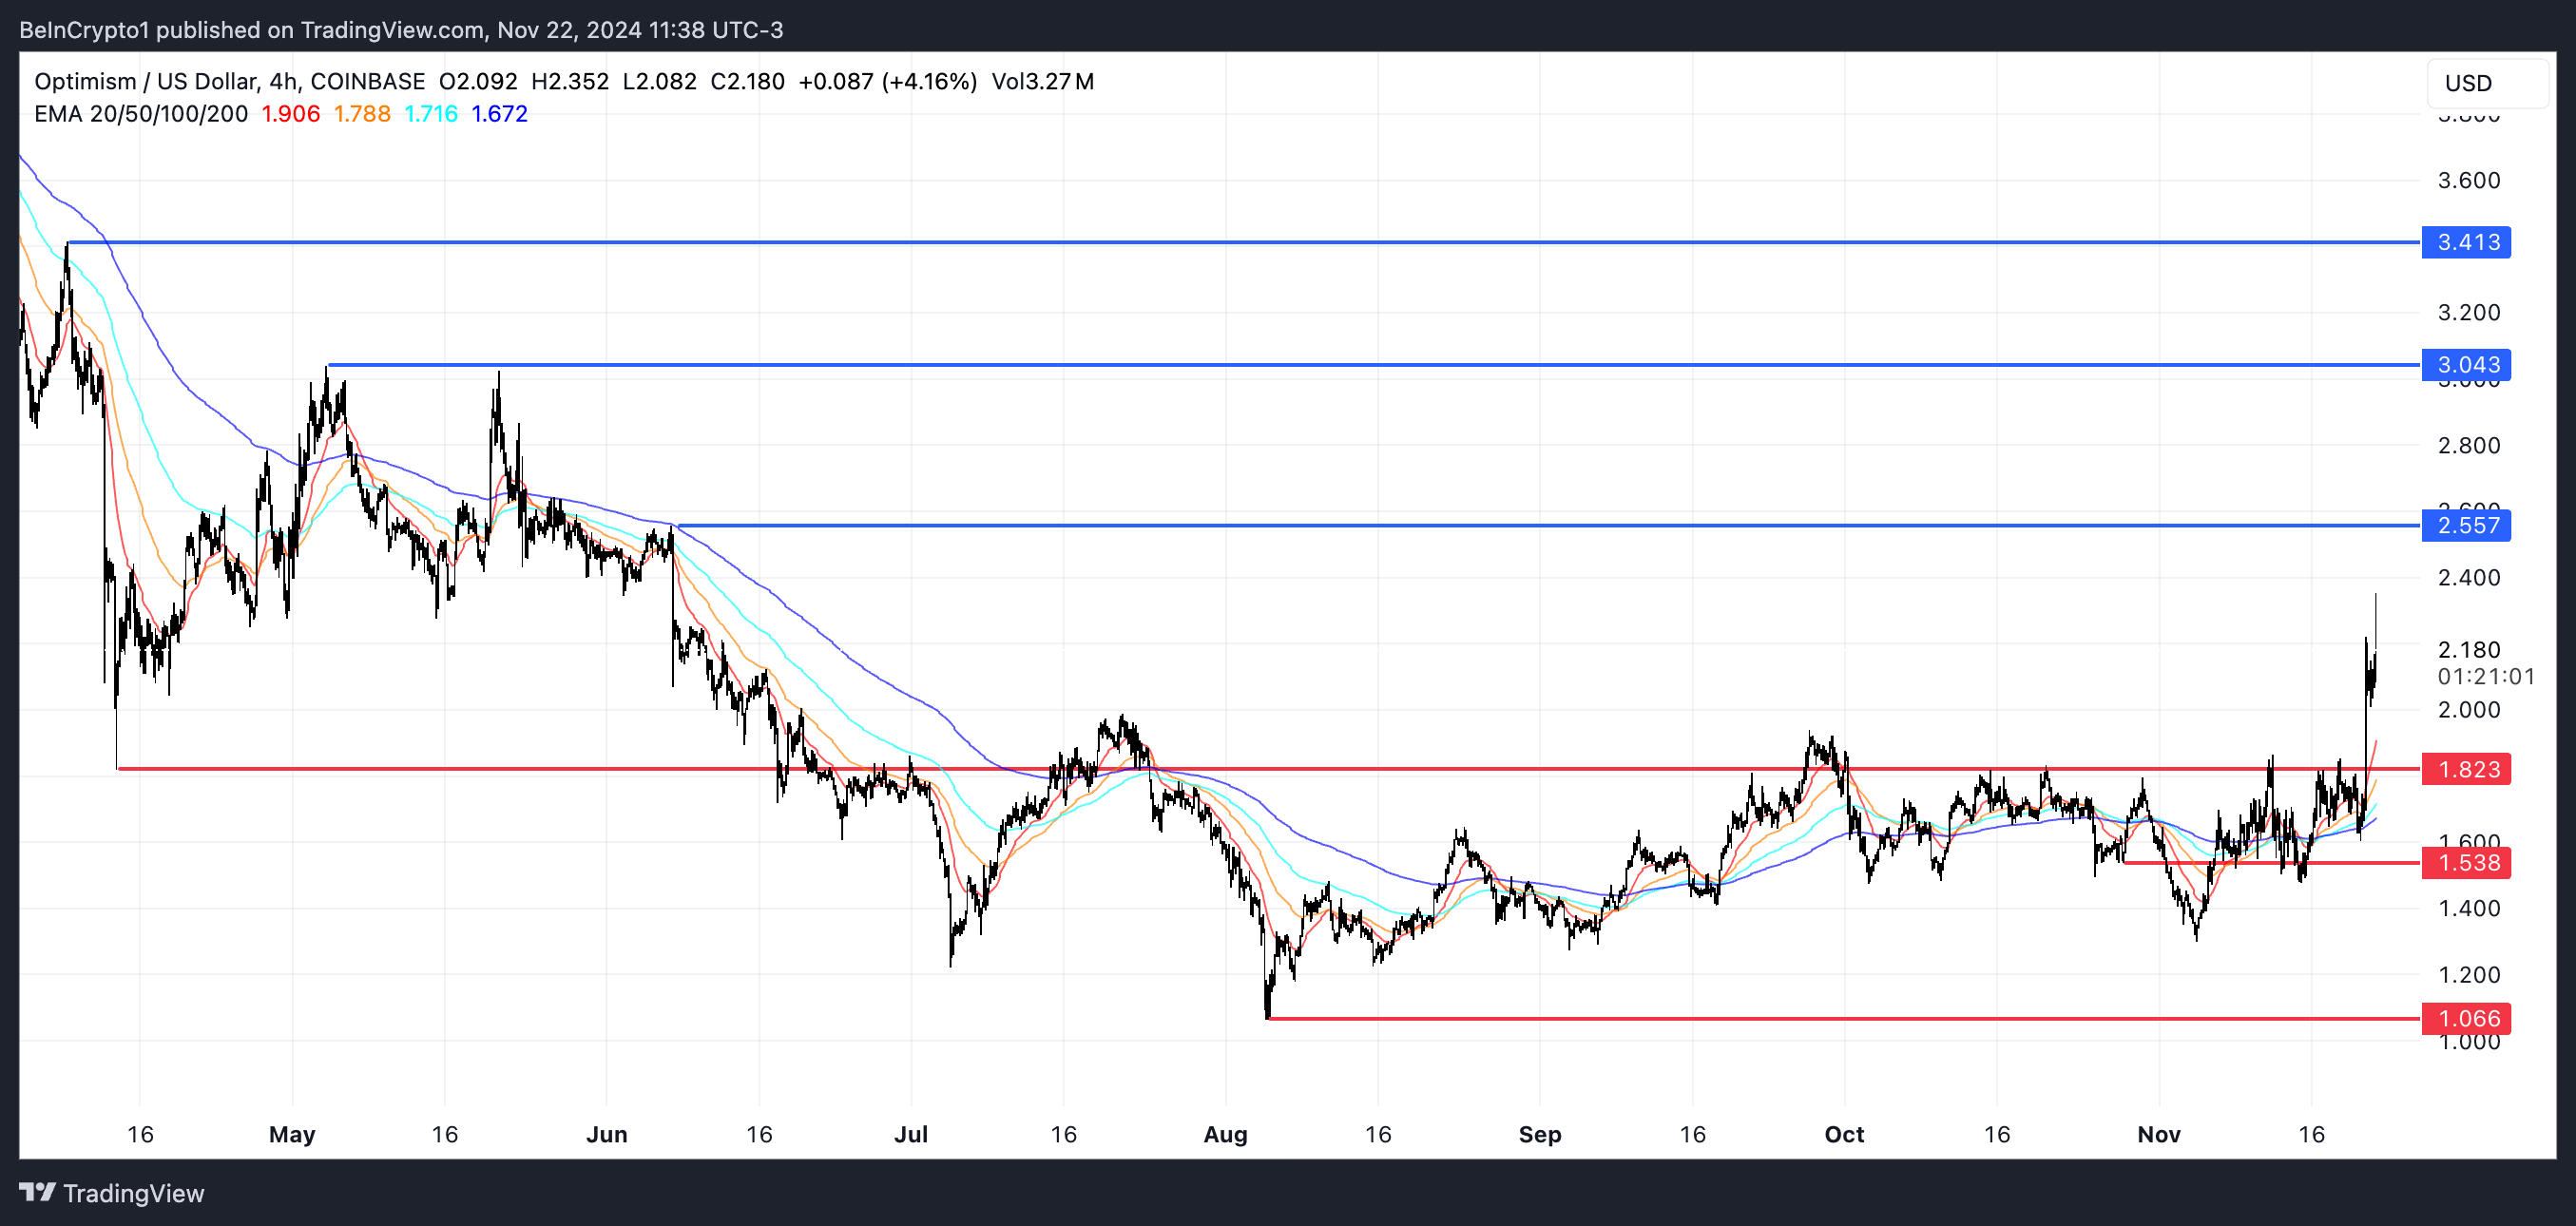
However, if the trend reverses, OP price could face significant downward pressure, with the next supports at $1.82 and $1.53.
If these levels fail to hold, the price could drop further to $1.06, representing a steep 51% correction.
Disclaimer
In line with the Trust Project guidelines, this price analysis article is for informational purposes only and should not be considered financial or investment advice. BeInCrypto is committed to accurate, unbiased reporting, but market conditions are subject to change without notice. Always conduct your own research and consult with a professional before making any financial decisions. Please note that our Terms and Conditions, Privacy Policy, and Disclaimers have been updated.
Source link
Tiago Amaral
https://beincrypto.com/optimism-op-price-rallies-momentum/
2024-11-22 17:30:00


