PEPE price has been on a strong rally, climbing nearly 60% over the past seven days. The bullish momentum has been fueled by positive technical indicators, including supportive EMA lines and a healthy RSI level.
However, some signs suggest that while buyers remain in control, the intensity of the uptrend may be starting to moderate.
PEPE’s Current Trend Is Still Strong
PEPE’s ADX is currently at 46.13, a slight decline from over 50 just a day ago. This drop suggests that while the trend strength remains strong, the intensity of the uptrend might be weakening somewhat.
Despite this, PEPE has been in a solid uptrend, climbing 59.69% in the last seven days. This indicates that buyers are still in control, but the momentum could be starting to moderate.
The Average Directional Index (ADX) is a technical indicator used to measure the strength of a trend, regardless of its direction. ADX values below 20 suggest a weak trend, while values above 25 indicate a strong trend. With PEPE’s ADX currently at 46.13, the uptrend remains powerful, although the recent dip in ADX hints that the trend’s vigor might be tapering off.
It suggests that while PEPE is still experiencing bullish momentum, investors should watch for signs that the strength of the move may be losing some steam, which could lead to a period of consolidation.
PEPE Is Not In The Overbought Stage Anymore
PEPE’s Relative Strength Index (RSI) is currently at 60.56, down from nearly 80 just a few days ago. This decrease indicates that the buying pressure has eased significantly after reaching overbought conditions.
The drop in RSI suggests that while there is still positive momentum, it is no longer as intense as it was recently, and the risk of an immediate correction has lessened.

Typically, an RSI above 70 means buyers have pushed the asset into overbought territory, which could trigger a price correction. On the other hand, an RSI below 30 suggests sellers have driven the asset into oversold conditions, possibly creating a buying opportunity.
PEPE’s RSI is currently at 60.56, which means it is no longer in overbought territory but still shows a healthy level of bullish momentum.
PEPE Price Prediction: Biggest Price Since May 2024?
PEPE’s EMA lines are currently displaying a very strong bullish configuration, with short-term EMAs positioned above long-term EMAs, and the price sitting comfortably above all of them.
If the uptrend continues, PEPE could test its next resistance at $0.00001580. Should this resistance be broken, the price could potentially climb to $0.00001726, which would be its highest level since May—a move representing a possible 30.85% increase.
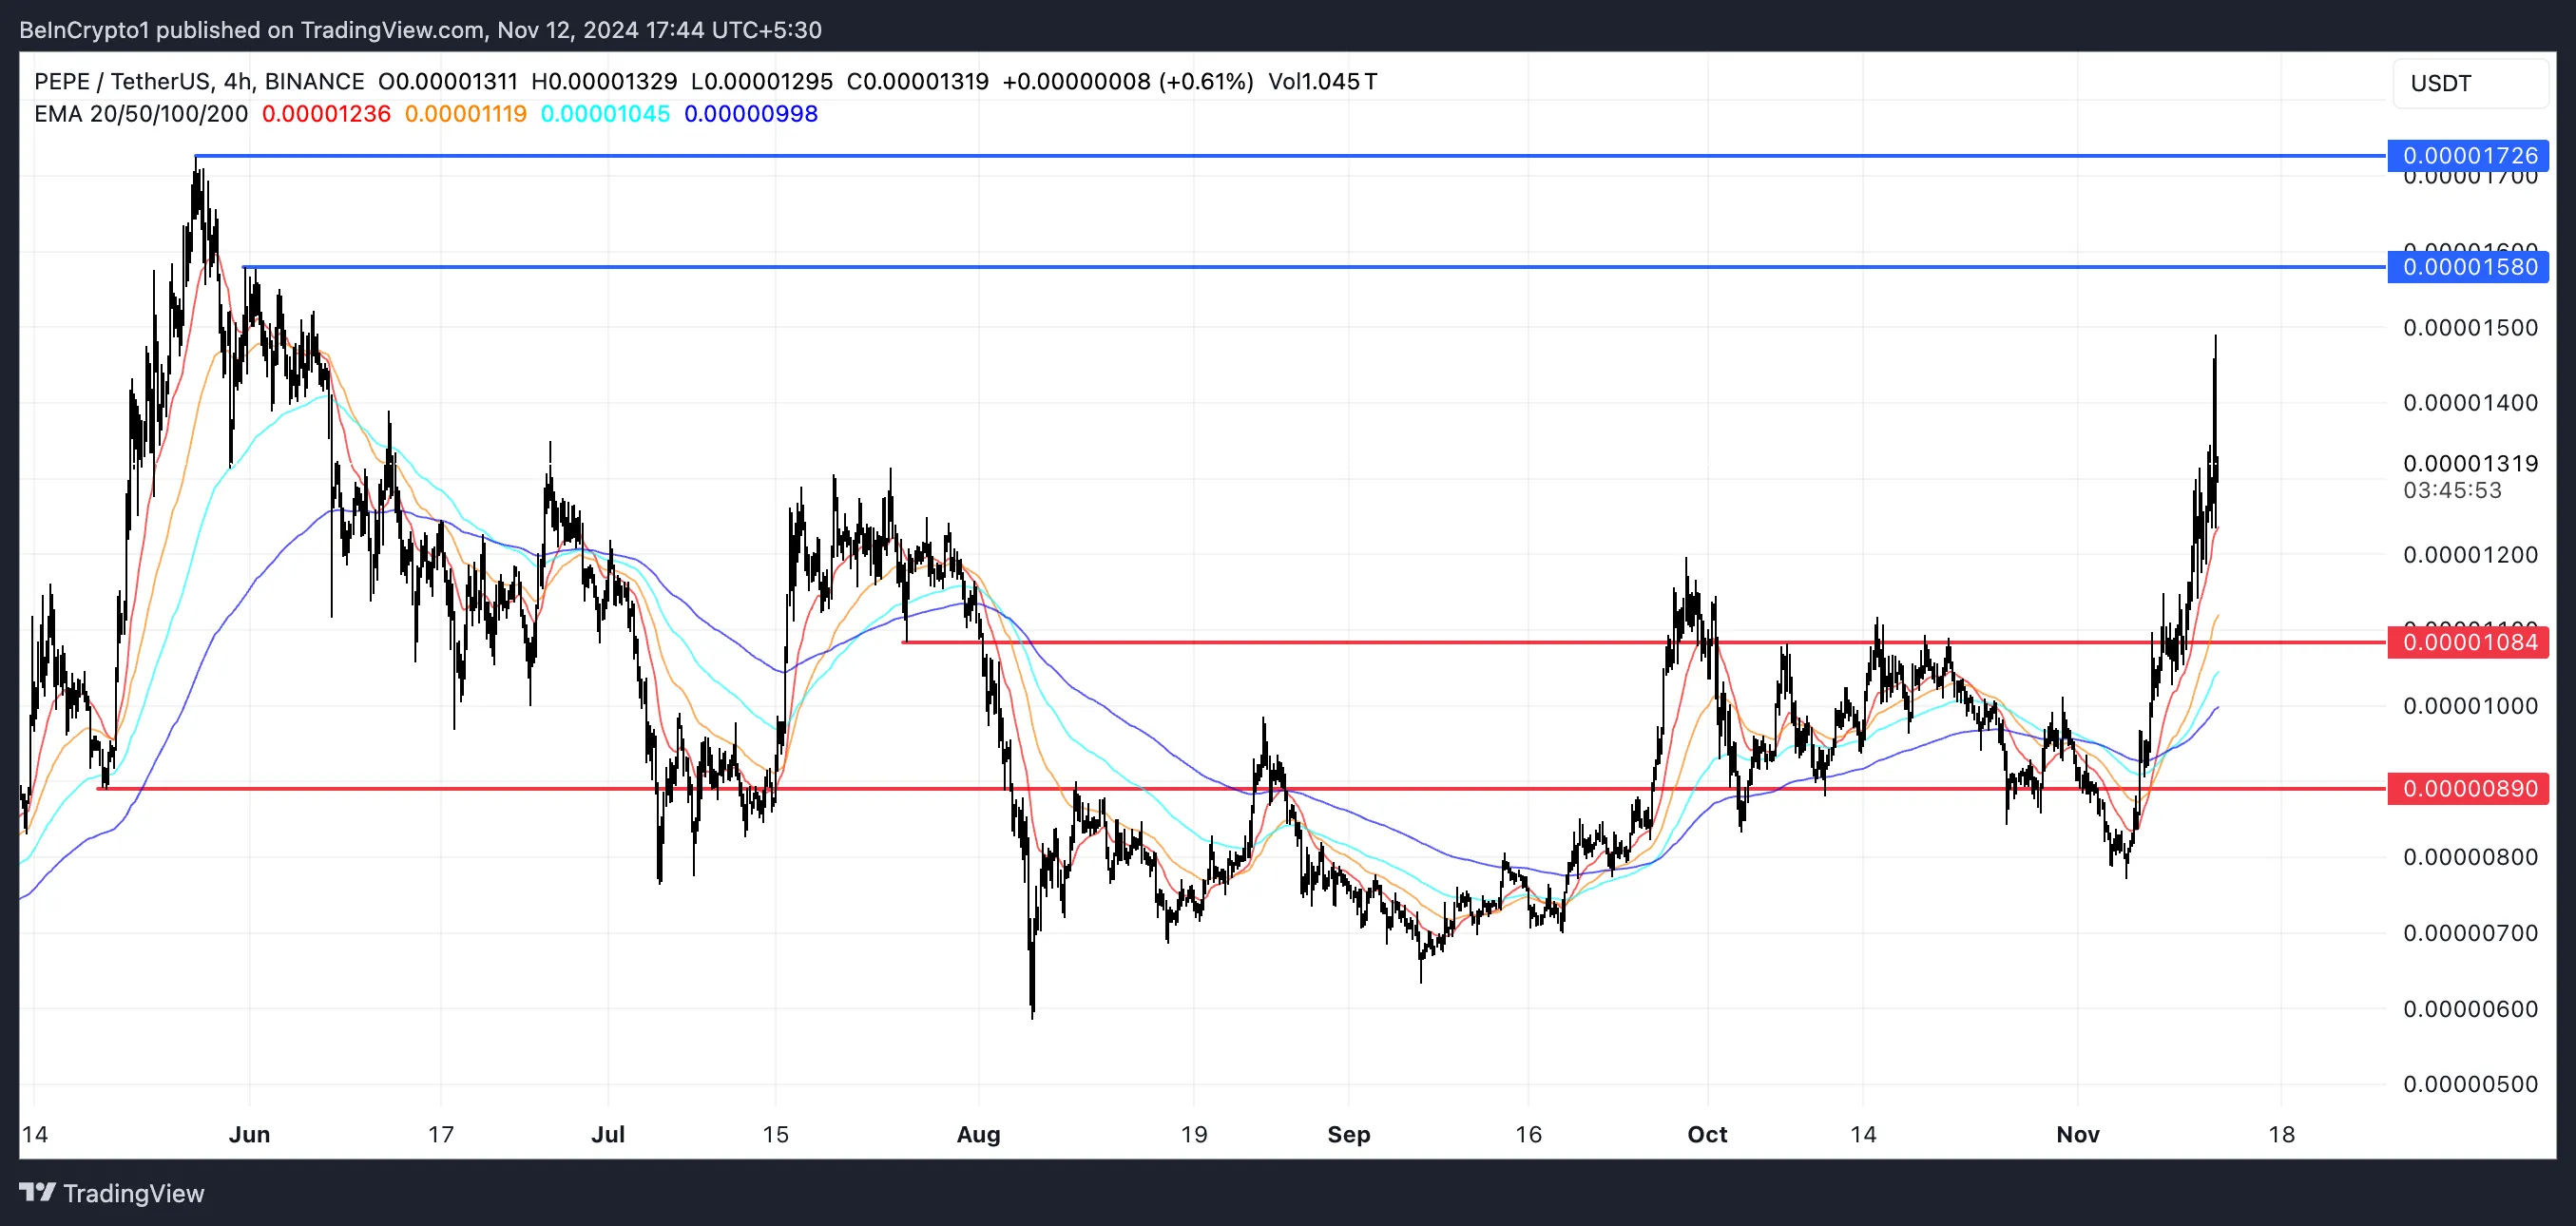
However, if the bullish momentum fades and selling pressure emerges, PEPE price could correct down to a support level of around $0.00001084.
If this support fails, the price could drop further to $0.0000089, marking a potential 32% decline from current levels.
Disclaimer
In line with the Trust Project guidelines, this price analysis article is for informational purposes only and should not be considered financial or investment advice. BeInCrypto is committed to accurate, unbiased reporting, but market conditions are subject to change without notice. Always conduct your own research and consult with a professional before making any financial decisions. Please note that our Terms and Conditions, Privacy Policy, and Disclaimers have been updated.
Source link
Tiago Amaral
https://beincrypto.com/pepe-price-builds-breakout/
2024-11-13 00:00:00


