

Ethereum’s (ETH) price dipped below its 20-day exponential moving average (EMA) and 50-day simple moving average (SMA) on October 1. Since then, it has struggled to break back above these levels, which have become resistance points.
The failure to overcome these resistance levels suggests a potential hesitation among buyers to enter the market at higher prices.
Ethereum Struggles Below Resistance
Ethereum is currently trading at $2,398, slightly below its 20-day Exponential Moving Average (EMA) of $2,462 and its 50-day Simple Moving Average (SMA) of $2,483. The 20-day EMA reflects the average closing price over the last 20 days, while the 50-day SMA provides a longer-term perspective by tracking the asset’s average closing price over the past 50 days.
When an asset’s price falls below these moving averages, it typically indicates a bearish trend or a loss of upward momentum. In this case, these moving averages act as resistance levels, making it challenging for Ethereum to rally unless there is a significant increase in demand.
Read more: How to Invest in Ethereum ETFs?
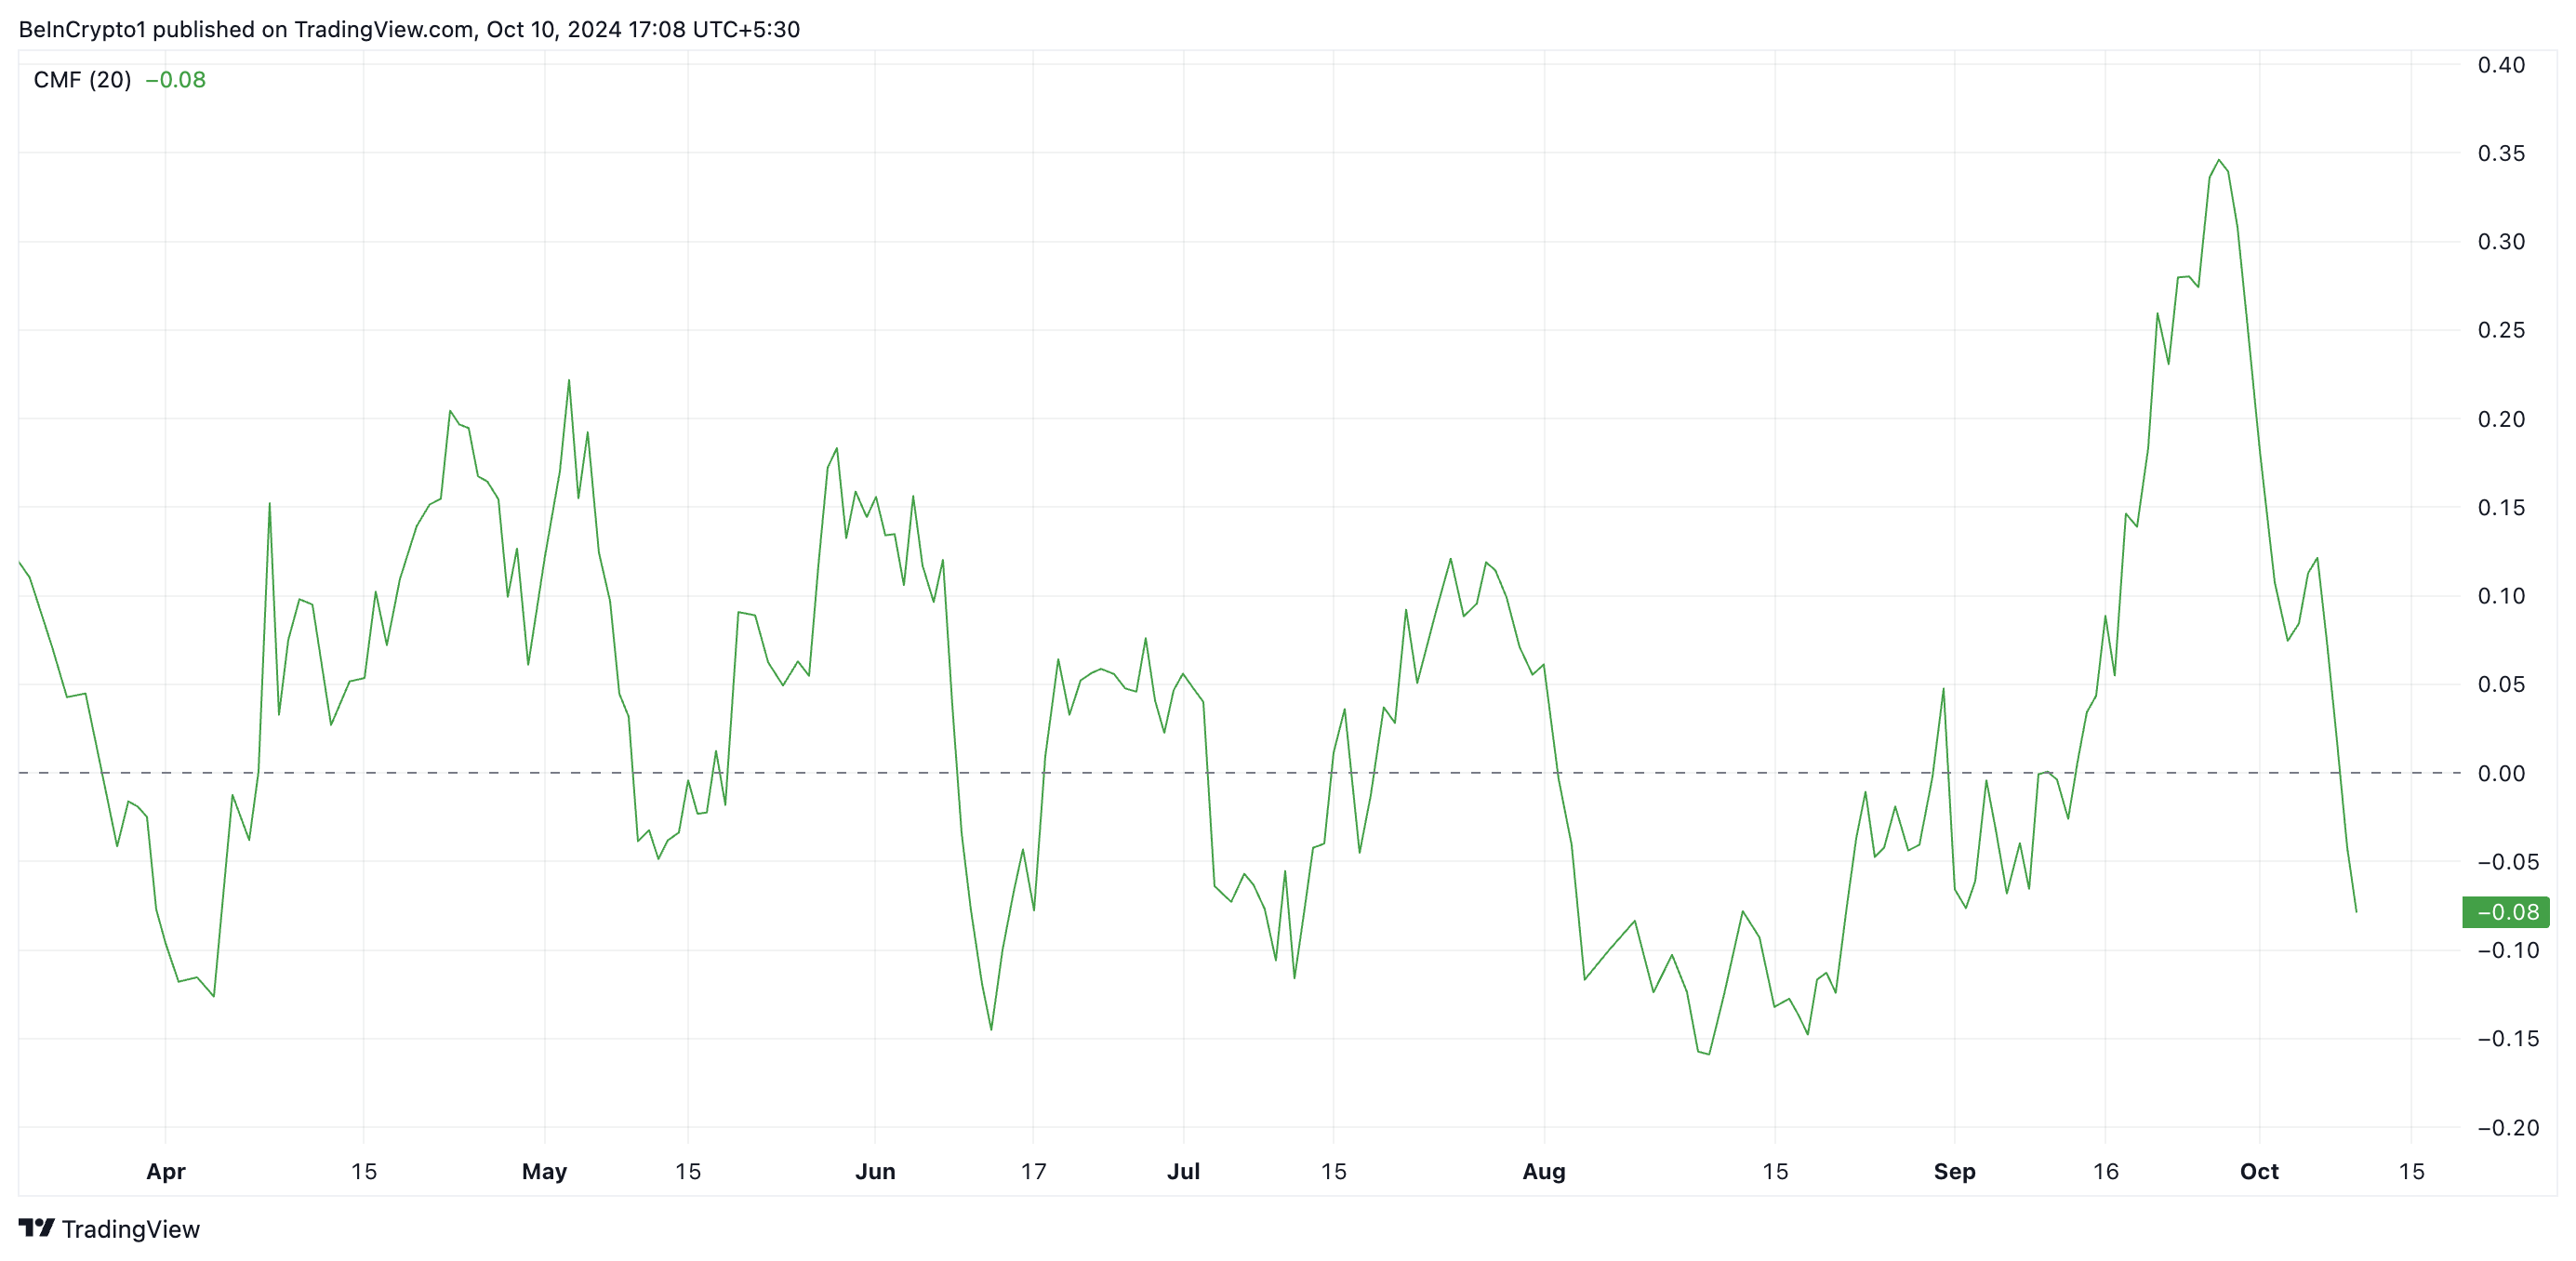
Such demand is lacking in the Ethereum market, as evidenced by its negative Chaikin Money Flow. This indicator, which measures money flow into and out of the coin’s market, is in a downward trend and below the zero line at -0.08.
When an asset’s CMF is negative, it indicates more selling pressure than buying pressure. It reflects the bearish sentiment among traders and investors, hinting at an extended decline.
Ethereum Price Prediction: Brace For More Declines
Ethereum’s Parabolic Stop and Reverse (SAR) indicator, assessed on a one-day chart, confirms the bearish bias against the leading altcoin. Since October 1, the dots that make up this indicator have rested above Ethereum’s price, suggesting that the coin is in a downtrend. Traders often interpret this as a signal to sell or to exit long positions.
If selling pressure continues to gain momentum, Ethereum’s price may drift further away from its 20-day EMA and 50-day SMA, reinforcing the downward trend. In this scenario, the price could potentially decline to $2,062.
Read more: Ethereum (ETH) Price Prediction 2024/2025/2030
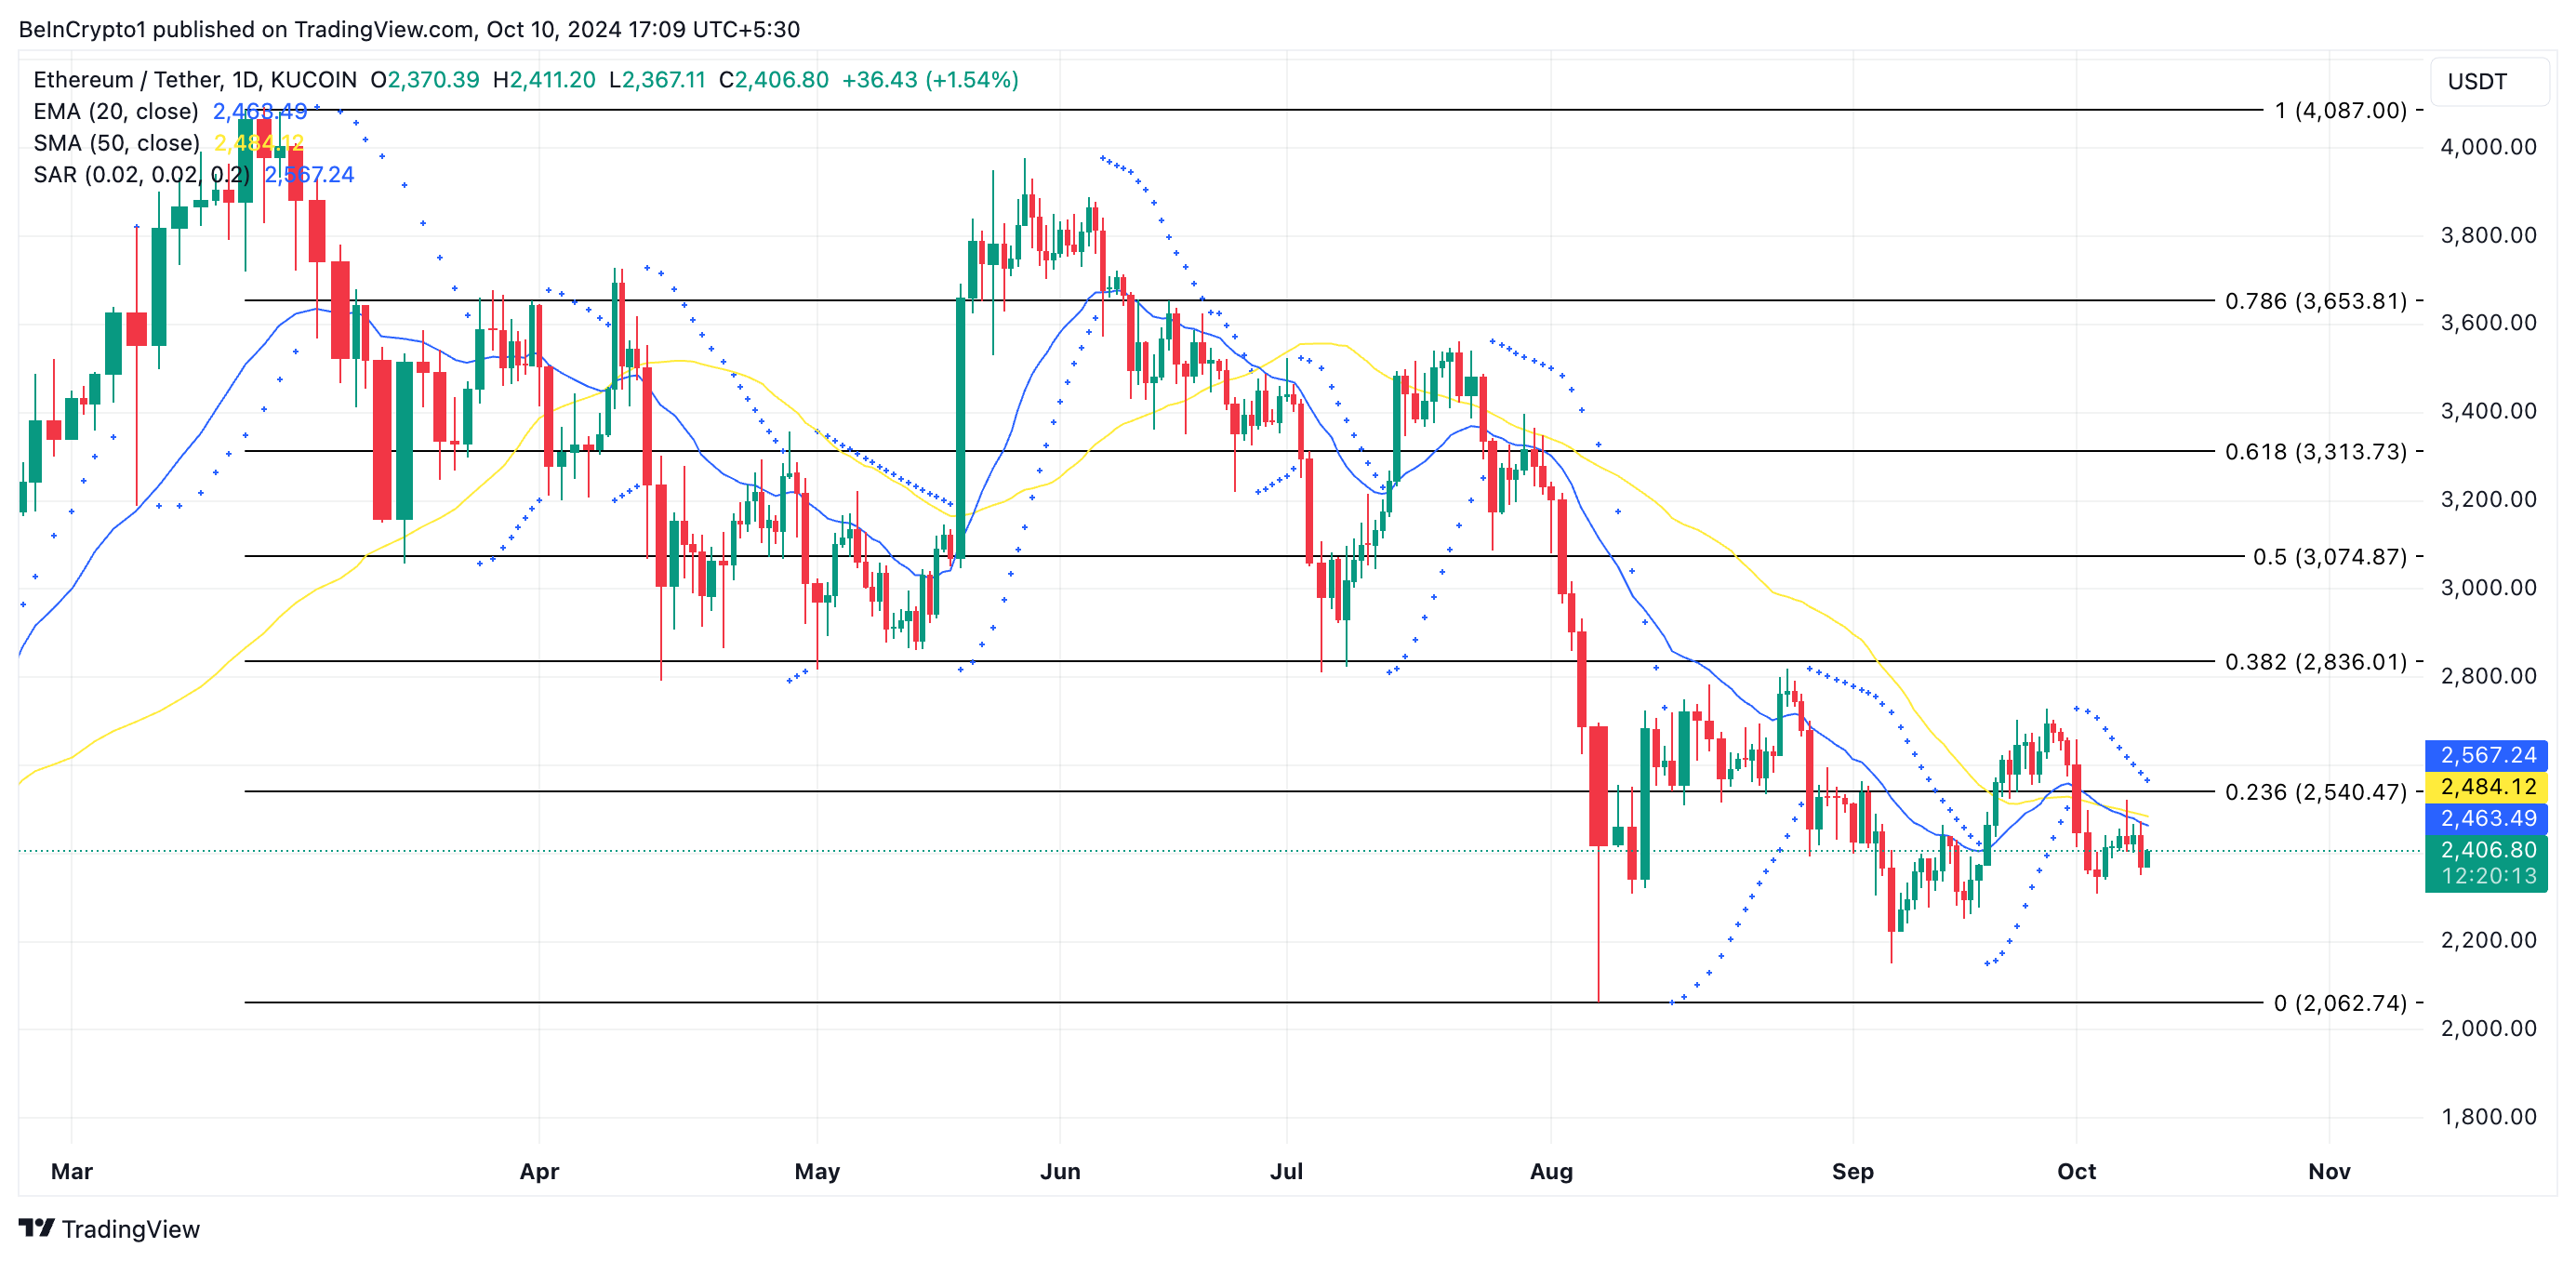
However, this bearish outlook could be overturned if buying pressure increases. Should this occur, Ethereum’s price might break through the resistance established by the 20-day EMA and 50-day SMA, allowing it to trade at $2,836.
Disclaimer
In line with the Trust Project guidelines, this price analysis article is for informational purposes only and should not be considered financial or investment advice. BeInCrypto is committed to accurate, unbiased reporting, but market conditions are subject to change without notice. Always conduct your own research and consult with a professional before making any financial decisions. Please note that our Terms and Conditions, Privacy Policy, and Disclaimers have been updated.
Source link
Abiodun Oladokun
https://beincrypto.com/ethereum-price-stalls/
2024-10-10 19:00:00