

On Wednesday, Bitcoin (BTC) exchanged hands for as much as $61,809 after the US Bureau of Labor Statistics (BLS) released July’s Consumer Price Index (CPI) inflation data, which came in at 2.9%, lower than what was recorded in June.
However, this proved to be a “fakeout” as the leading coin’s price soon plummeted to trade below the $60,000 price mark.
Bitcoin‘s Brief Rally to $62,000
A “fakeout” occurs when an asset’s price moves in one direction, often misleading traders, before quickly reversing its course. This happened with BTC, which rallied to almost $62,000 after the BLS released July’s CPI.
As the market settled, the leading coin reversed its trend and dropped below $60,000 which appears to have formed a critical resistance level. As of this writing, BTC trades at $58,069, falling 8% in the past 24 hours.
Since it peaked at $62,400 on August 9, the flagship crypto has found it challenging to hold above $60,000, reducing the number of daily transactions that have resulted in profit since then. An assessment of the coin’s ratio of daily transaction volume in profit to loss (using a seven-day moving average) shows that on Thursday, BTC traders recorded more losses than profits.
At press time, the metric’s value is 0.88, indicating that for every transaction that has ended in a loss so far today, only 0.88 transactions have returned a profit.
Further, the past 24 hours have seen an uptick in the demand for short positions, as evidenced by its negative funding rate. As of this writing, the coin’s funding rate across cryptocurrency exchanges is -0.004%.
Read more: Bitcoin (BTC) Price Prediction 2024/2025/2030
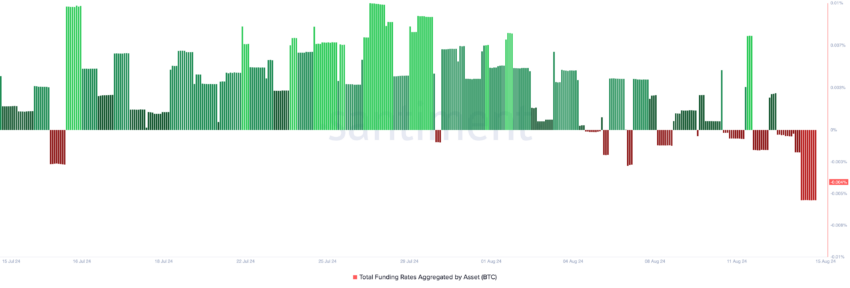
When an asset’s funding rate is negative, there is more demand for short positions. This means more traders are buying the asset in anticipation of a price decline than there are traders acquiring the coin and hoping for a rally.
BTC Price Prediction: Coin Trades Below Key Moving Average
BTC’s decline below the $60,000 price level has pushed its price below its 20-day exponential moving average (EMA). This measures the coin’s average price over the past 20 trading days.
When an asset’s price trades below this moving average, it signals a bearish trend or downward momentum in the short term. This suggests the recent price action is weaker than the average over the past 20 days.
If BTC falls further from this key moving average, it may plunge to the next support level at $54,847.
Read more: Who Owns the Most Bitcoin in 2024?
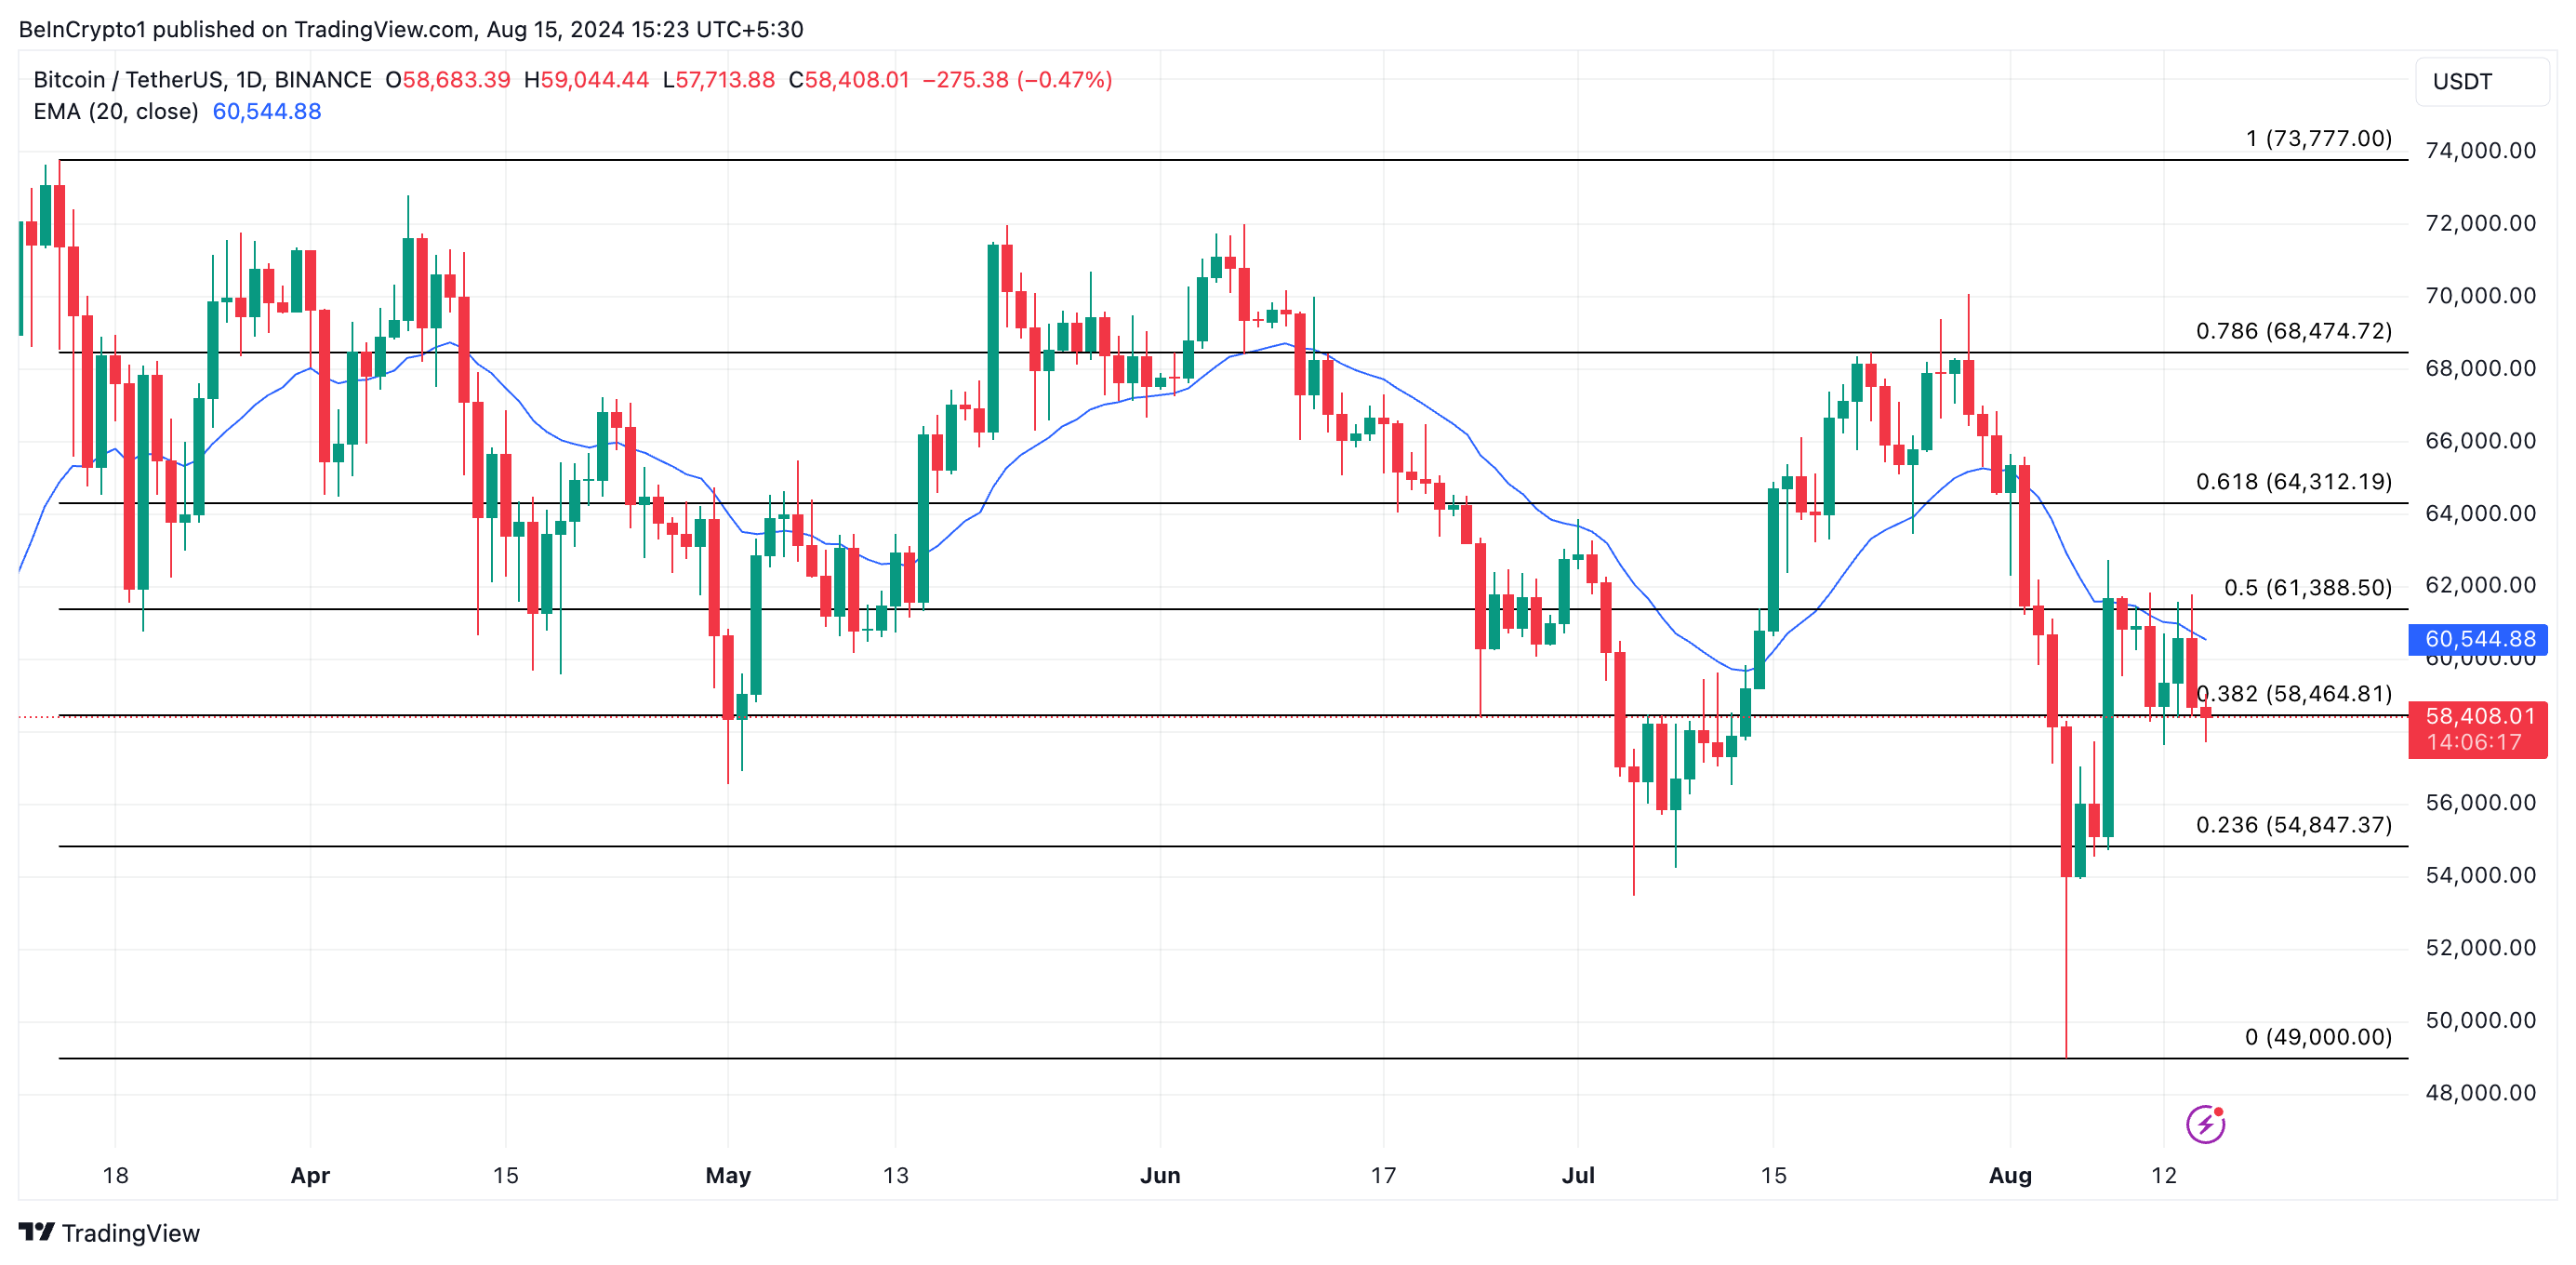
However, if market sentiment shifts from bearish to bullish, the coin’s price may reclaim the $60,000 mark and trade above it at $61,388.
Disclaimer
In line with the Trust Project guidelines, this price analysis article is for informational purposes only and should not be considered financial or investment advice. BeInCrypto is committed to accurate, unbiased reporting, but market conditions are subject to change without notice. Always conduct your own research and consult with a professional before making any financial decisions. Please note that our Terms and Conditions, Privacy Policy, and Disclaimers have been updated.
Source link
Abiodun Oladokun
https://beincrypto.com/bitcoin-fakeout-btc-price-dips/
2024-08-15 14:00:00