
Ethereum’s (ETH) price continues to grapple with significant strain, having fallen below $2,400 for the second time in three days.
While the broader market might hope that this latest decline marks the bottom, on-chain analysis begs to differ.
Investors Move Away from ETH
On August 24, Ethereum’s price climbed to $2,800, sparking speculation that the cryptocurrency might retest $3,000. But that did not happen, as ETH continues to trade lower. At press time, Ethereum’s Coinbase Premium Index has plummeted, suggesting that the price might succumb to another notable decline.
The Coinbase Premium Index gauges the difference between the Ethereum spot price on Binance and that of Coinbase. High values of this indicator suggest substantial buying pressure in the US. Low values, however, signify that US investors are refraining from buying but selling.
Based on CryptoQuant’s data, the index has dropped to -0.042, suggesting a notable decline in buying pressure from American investors.
Read more: 9 Best Places To Stake Ethereum in 2024
Likewise, the spot Ethereum ETFs have also faced a lack of demand. On-chain data from Santiment reveals that the ETH supply available on exchanges has been climbing.
One month ago, the amount of ETH in exchanges was 19.94 million. Today, the same metric is over 21 million, indicating that more coins have flowed into these centralized platforms.
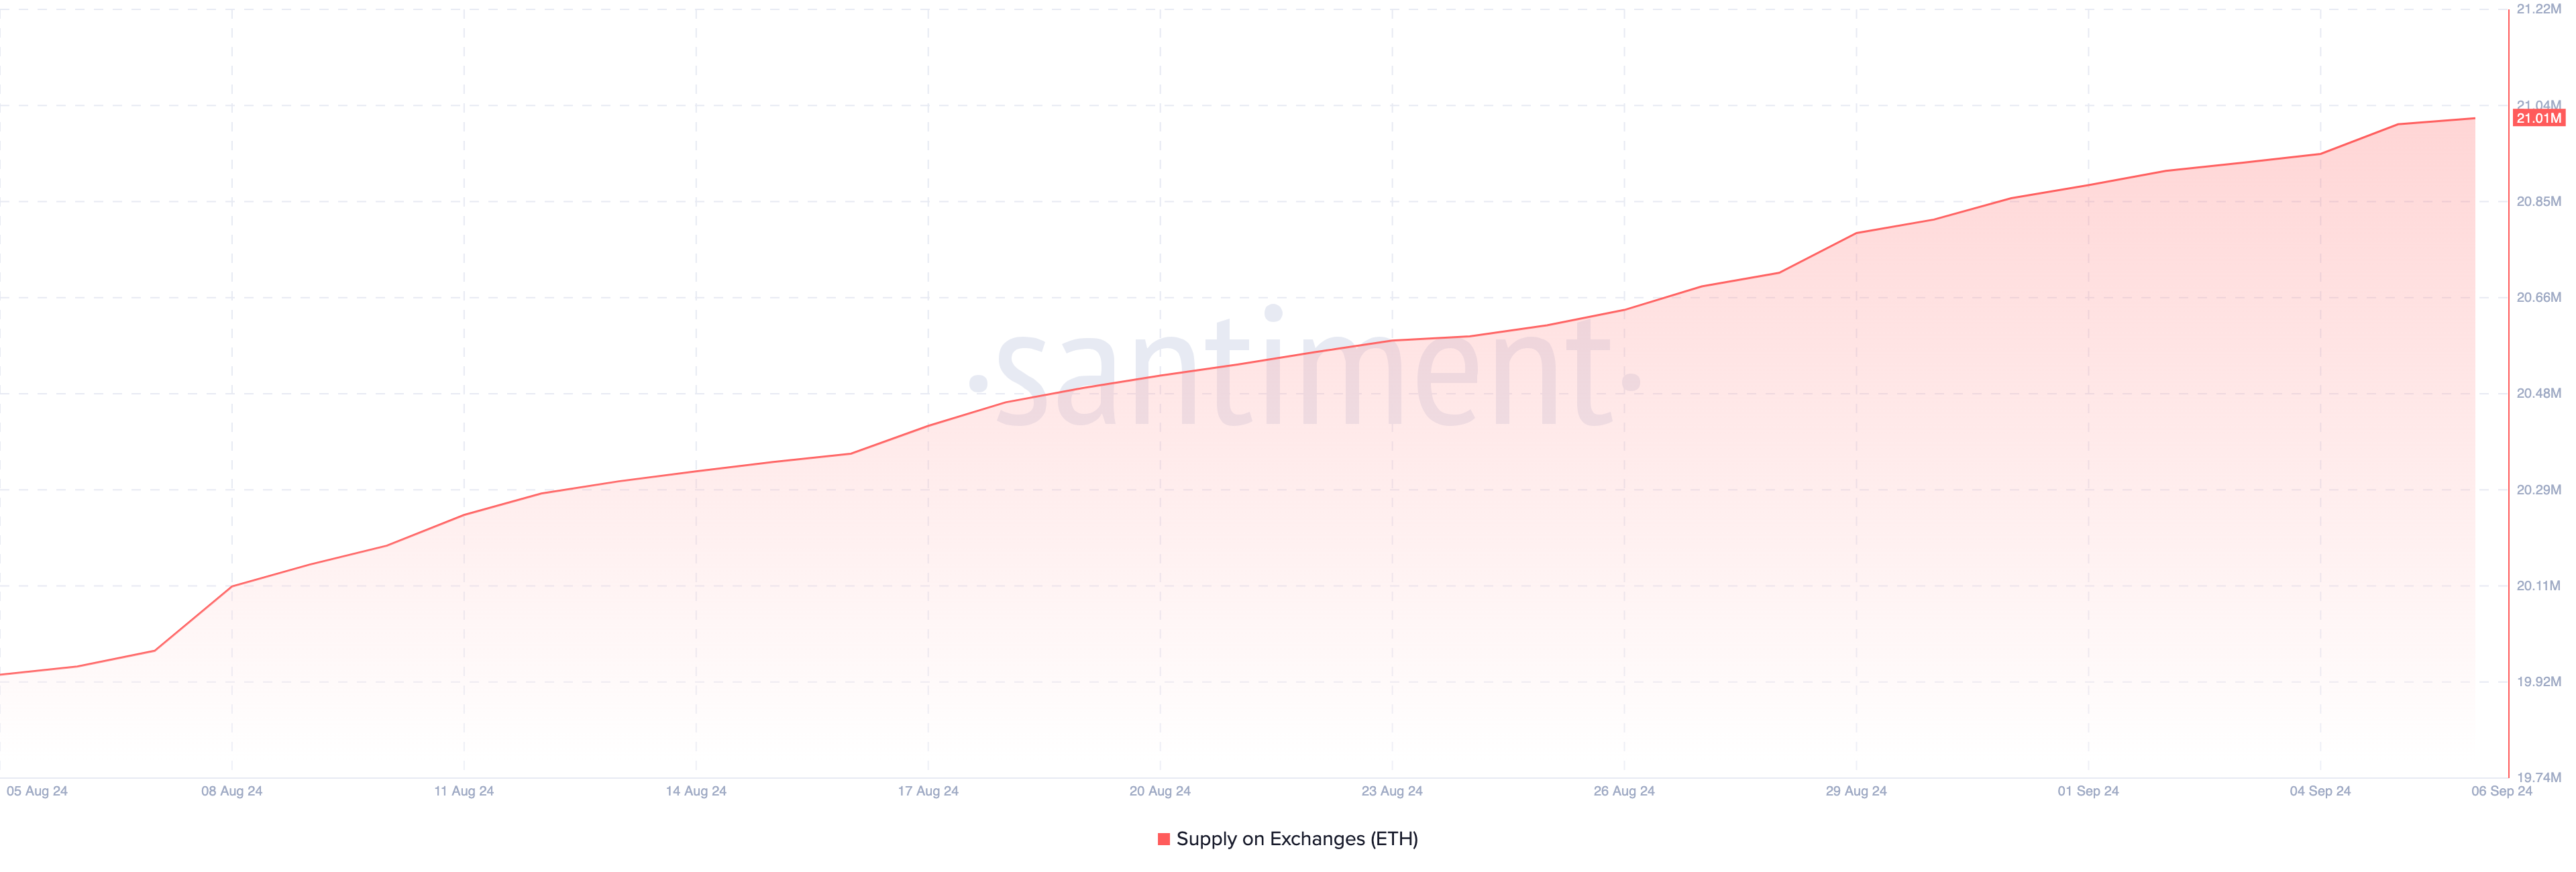
A low exchange supply typically signals bullish conditions, as it indicates that most investors are not planning to sell soon. However, given Ethereum’s current situation, it might encounter significant selling pressure, which could drive the price lower.
Ethereum Price Prediction: Freefall
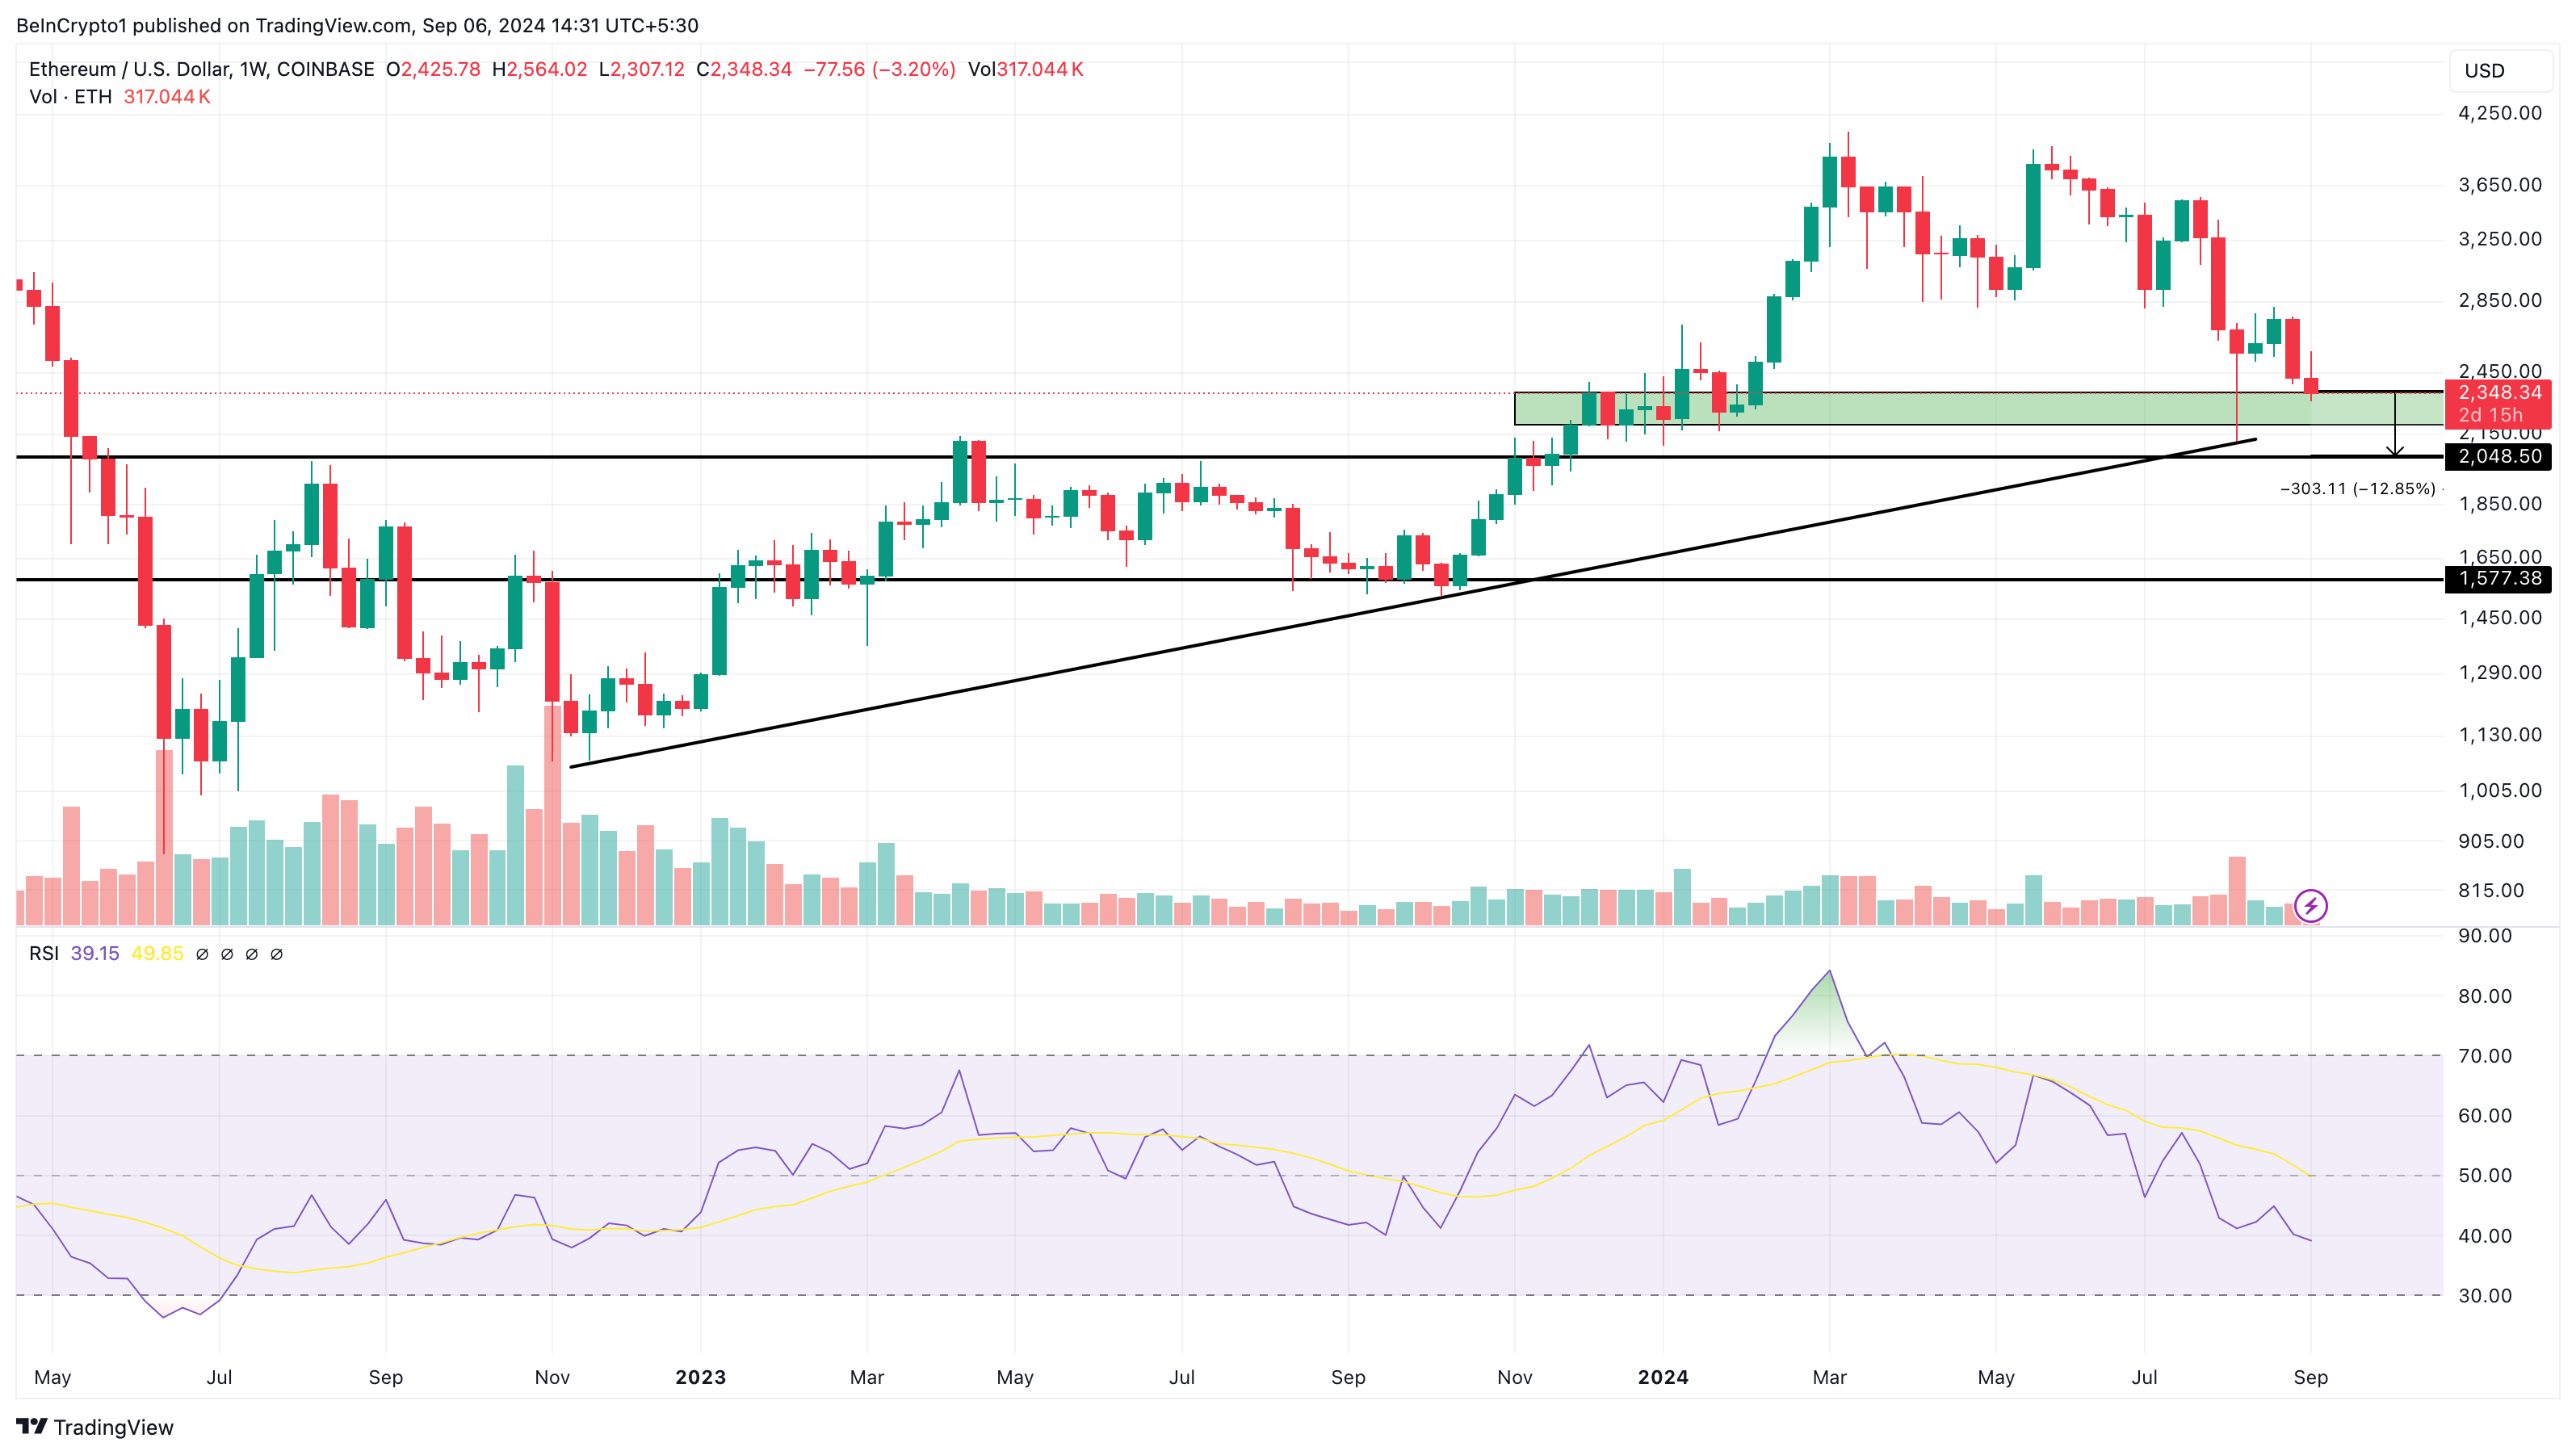
On the weekly chart, ETH’s price had formed a series of higher lows since December 2022. However, the price correction seen in early August completely invalidated the bias that the cryptocurrency might jump to a higher value.
As of this writing, Ethereum’s price is $2,345, which is between the demand zone of $2,200 and $2,350. Should the altcoin fall below the lower boundary of this zone, its price might drop to $2,048.
In addition, the Relative Strength Index (RSI), which measures momentum by examining the speed and size of price changes, is below the neutral level. This RSI position suggests that the momentum around Ethereum is bearish, and if sustained, it could accelerate the decline toward $2,200.
Breaking below this level creates a highly bearish scenario, as Ethereum’s price could drop to $1,577.
Read more: How to Buy Ethereum (ETH) and Everything You Need to Know
Despite the pessimistic scenario, there is still hope. If buying pressure from US investors and the broader market increases, Ethereum could rebound. Should this happen, ETH’s price might jump toward $2,800 again.
Disclaimer
In line with the Trust Project guidelines, this price analysis article is for informational purposes only and should not be considered financial or investment advice. BeInCrypto is committed to accurate, unbiased reporting, but market conditions are subject to change without notice. Always conduct your own research and consult with a professional before making any financial decisions. Please note that our Terms and Conditions, Privacy Policy, and Disclaimers have been updated.
Source link
Victor Olanrewaju
https://beincrypto.com/ethereum-eth-price-risks-freefall/
2024-09-06 11:08:16