

Fantom (FTM) has surged 17% over the past seven days, reaching $0.37 at press time—the highest price it has traded at during this period.
However, readings from its price movements on a one-day chart suggest that the altcoin may find it challenging to extend its gains.
Fantom Set to Lose Some Gains
FTM’s momentum indicators currently lie below their 50-neutral regions, signaling a notable decline in buying pressure. At press time, the coin’s Relative Strength Index (RSI) is 45.60, while its Money Flow Index (MFI) is 35.37.
These indicators measure an asset’s oversold and overbought market conditions. At their current values, FTM’s RSI and MFI suggest that its investors have sold more coins than they have bought recently, putting downward pressure on its price. If this trend persists, the coin risks shedding its recent gains.
Additionally, FTM’s Chaikin Money Flow (CMF) remains below the zero line, confirming that the coin’s rally is not supported by any significant buying activity. As of this writing, FTM’s CMF is -0.11.
Read More: What Is Fantom (FTM)?
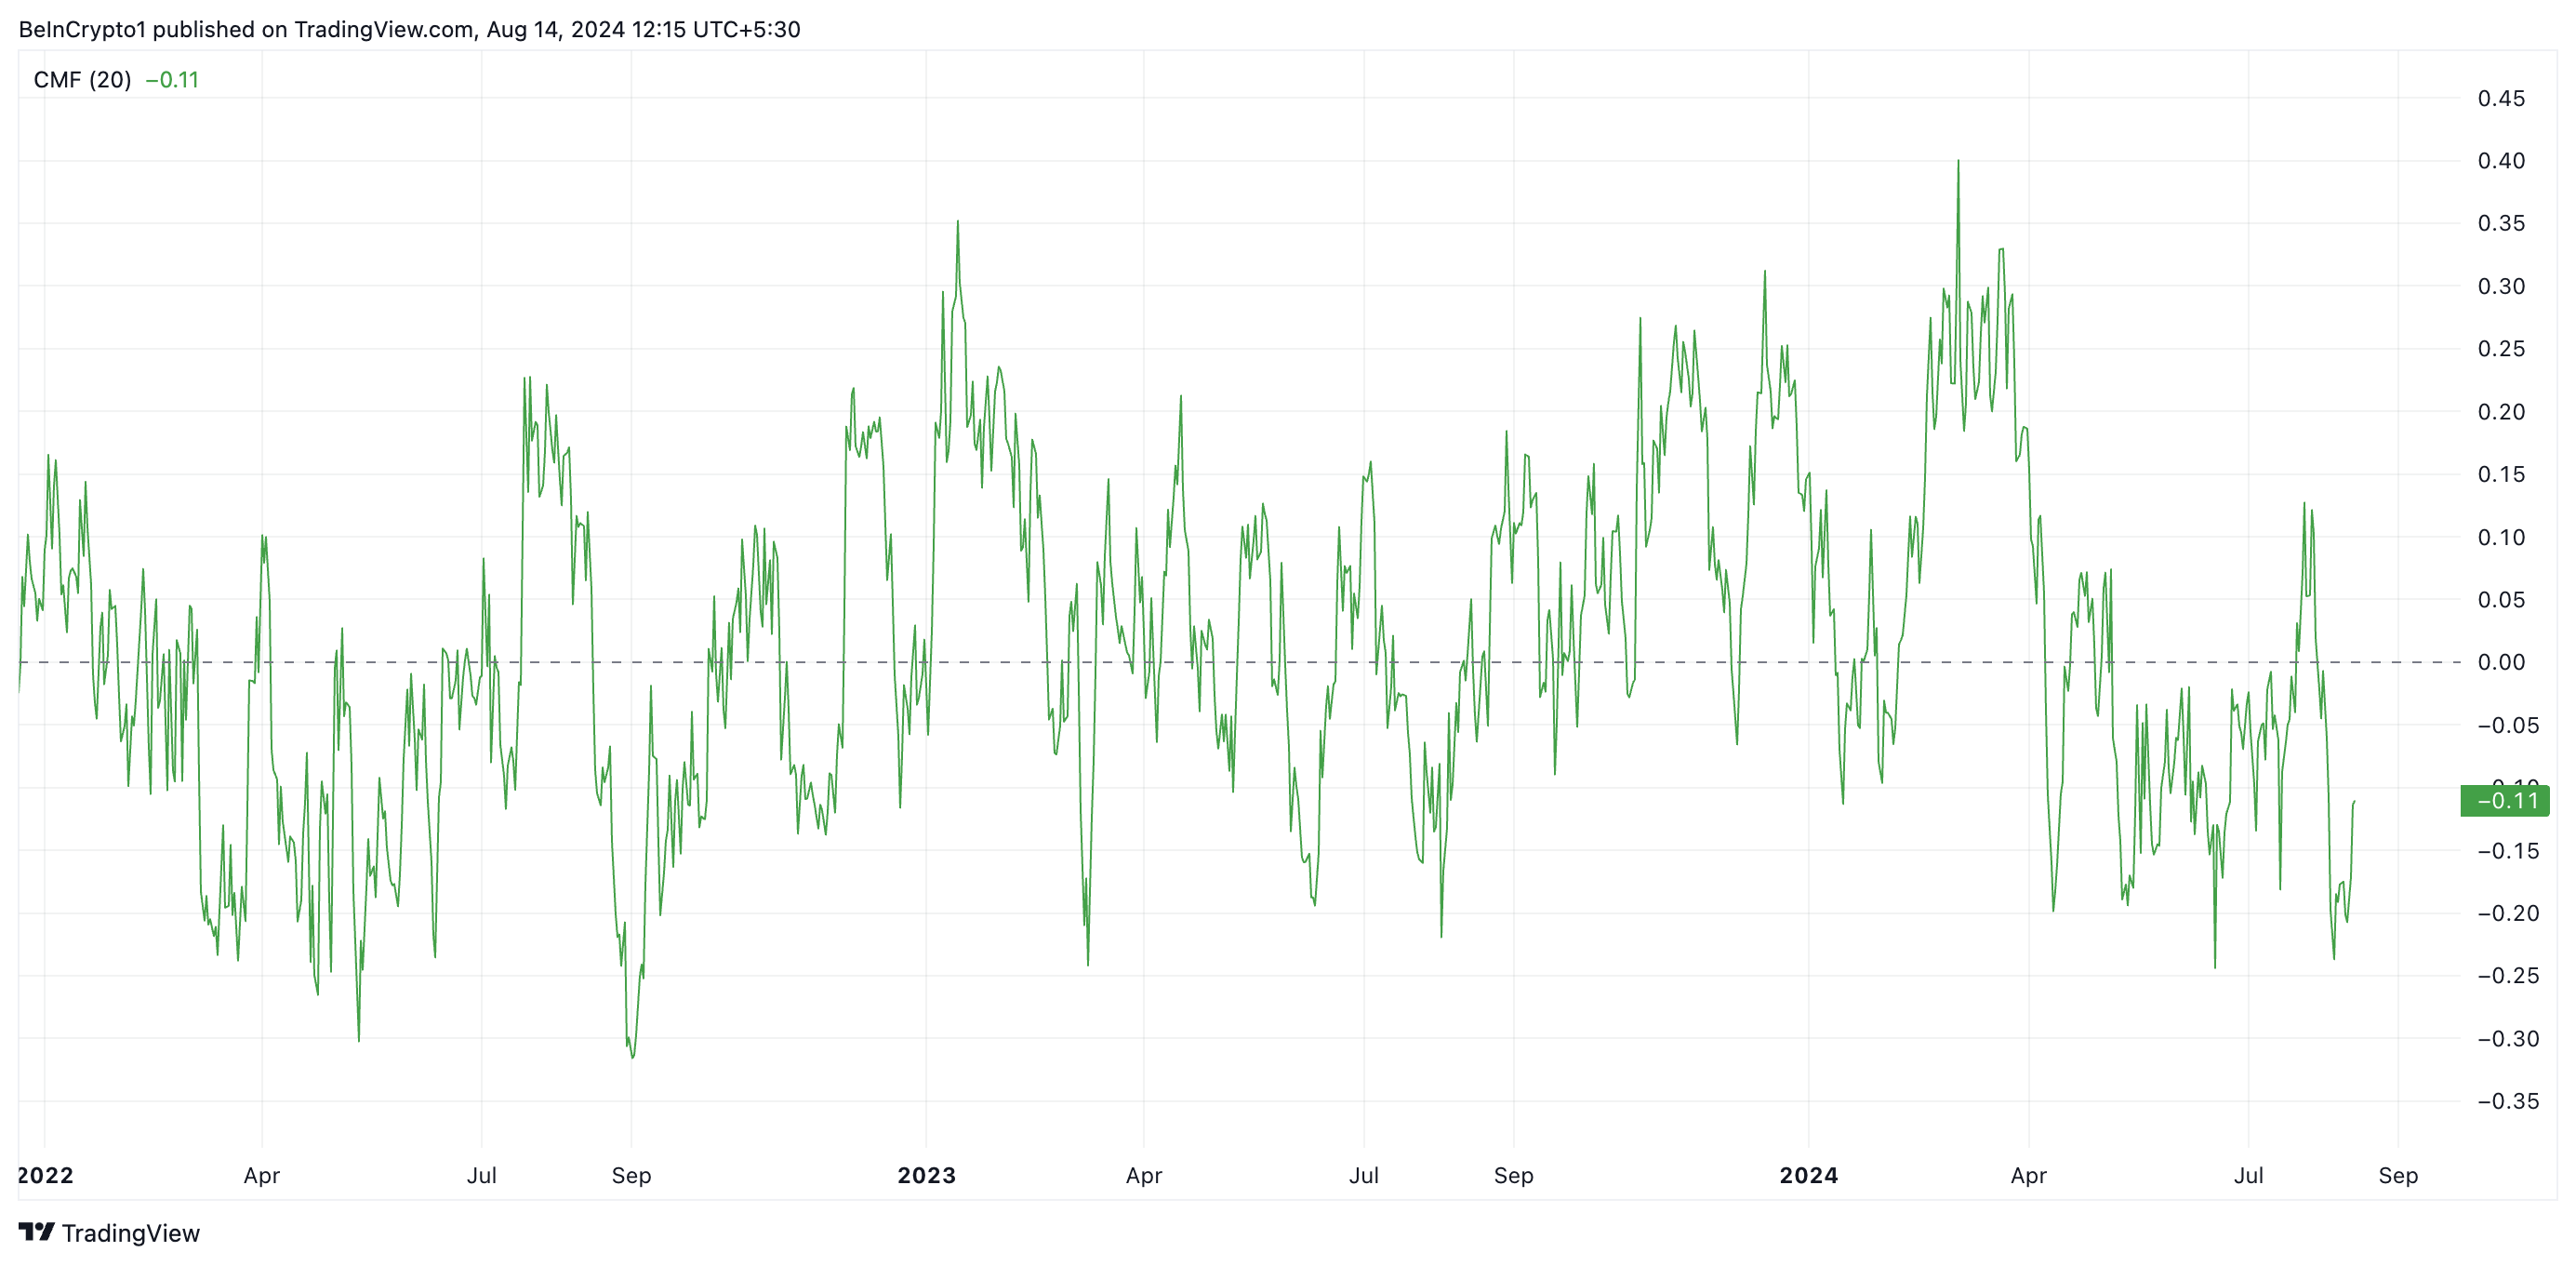
This indicator measures the flow of money into and out of the market. A CMF value below zero suggests market weakness, indicating a liquidity outflow. It is often regarded as a precursor to a price decline.
Hence, the drop in the actual demand for FTM signals that its double-digit price hike over the past week merely mirrors the broader market uptrend, as indicated by the 9% increase in global cryptocurrency market capitalization during that period.
FTM Price Prediction: Prepare For a Decline to $0.17
The low interest in FTM is also spotted on-chain, as evidenced by the coin’s negative price-daily active address (DAA) divergence. For context, the metric has returned only negative values since FTM’s rally began. At press time, its value is -49.64.
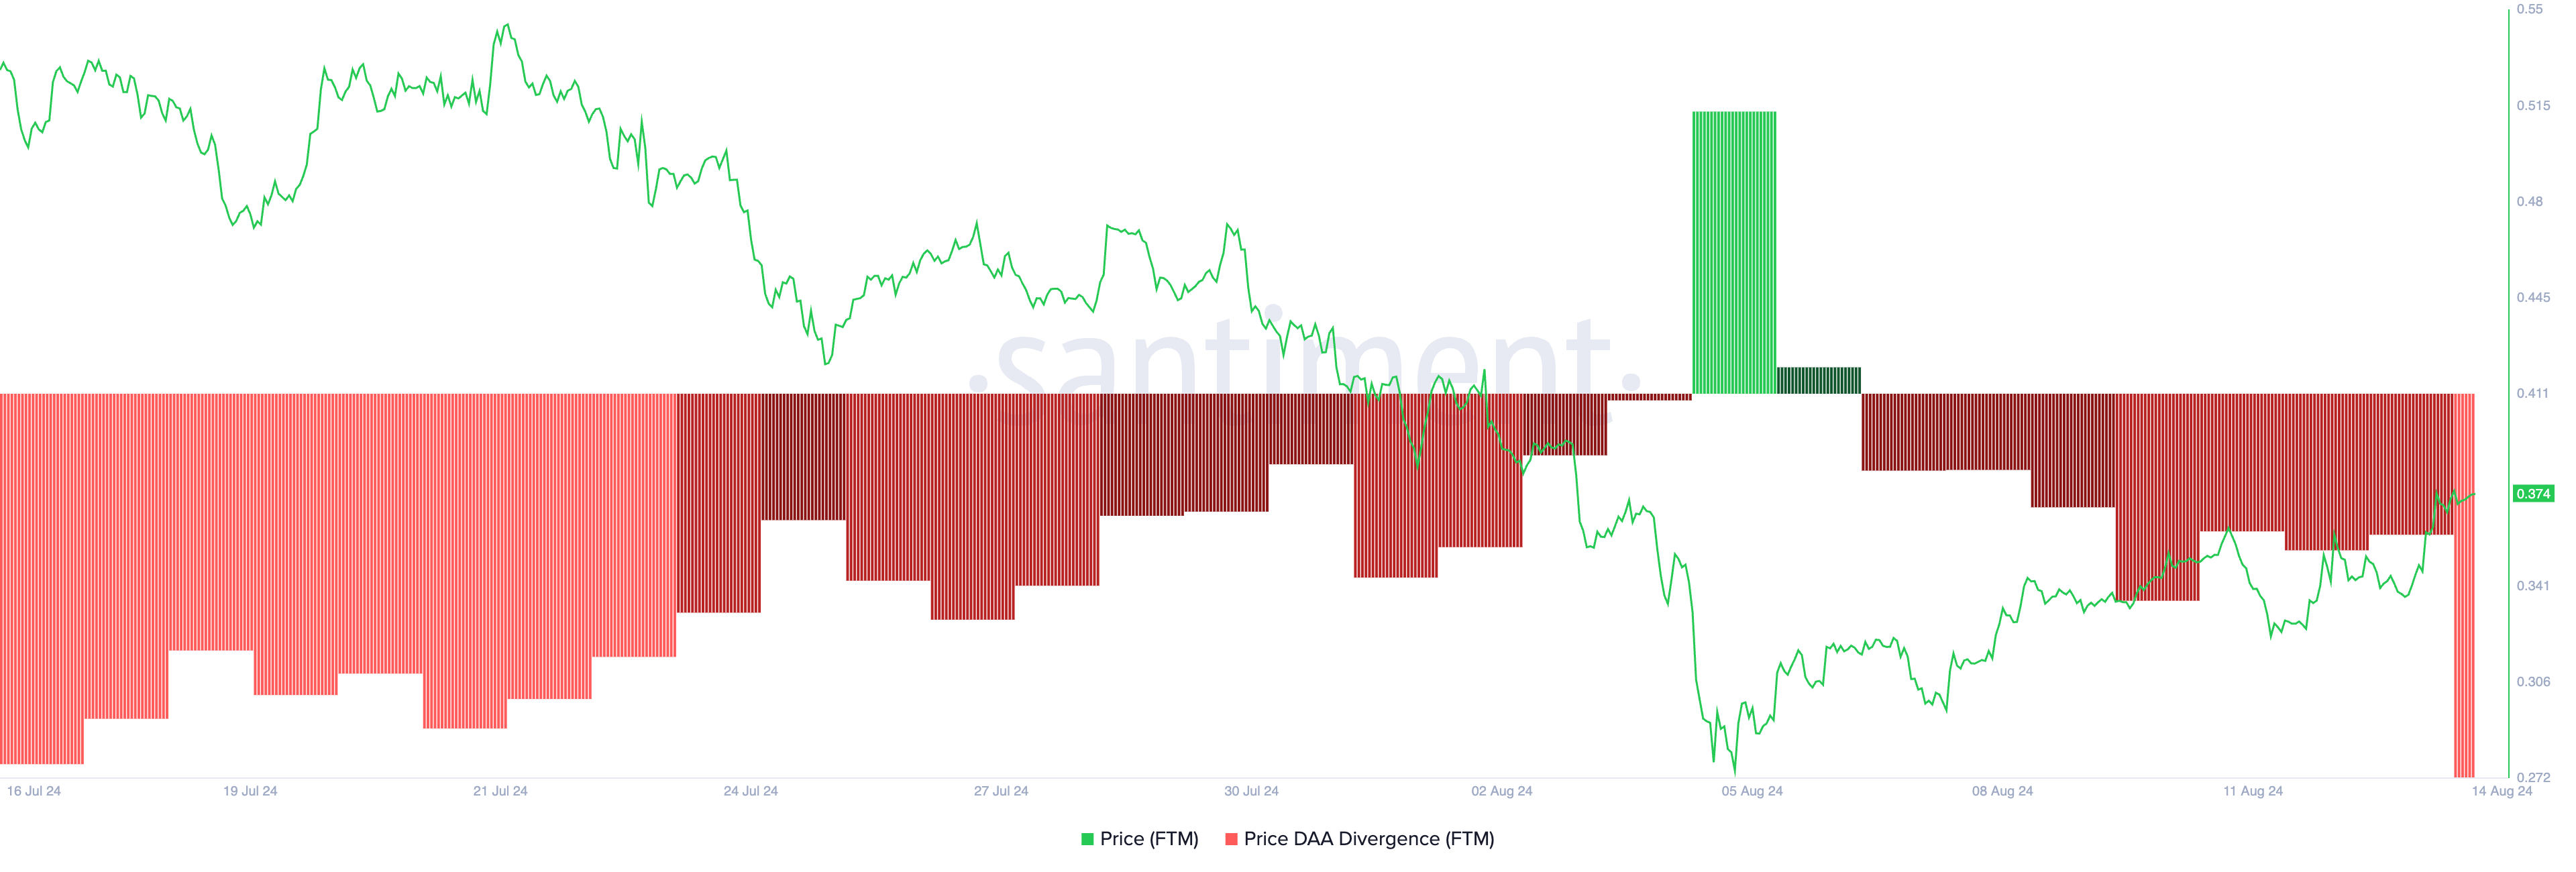
An asset’s price DAA divergence compares its price movements with the changes in its number of daily active addresses. It tracks whether an asset’s price movement is supported by corresponding network activity.
When an asset’s price rises, a negative DAA divergence indicates that the rally is unsustainable, as a corresponding increase in network activity does not support it. This suggests that the price hike is being driven by speculation or short-term market sentiment. It hints at a potential price correction.
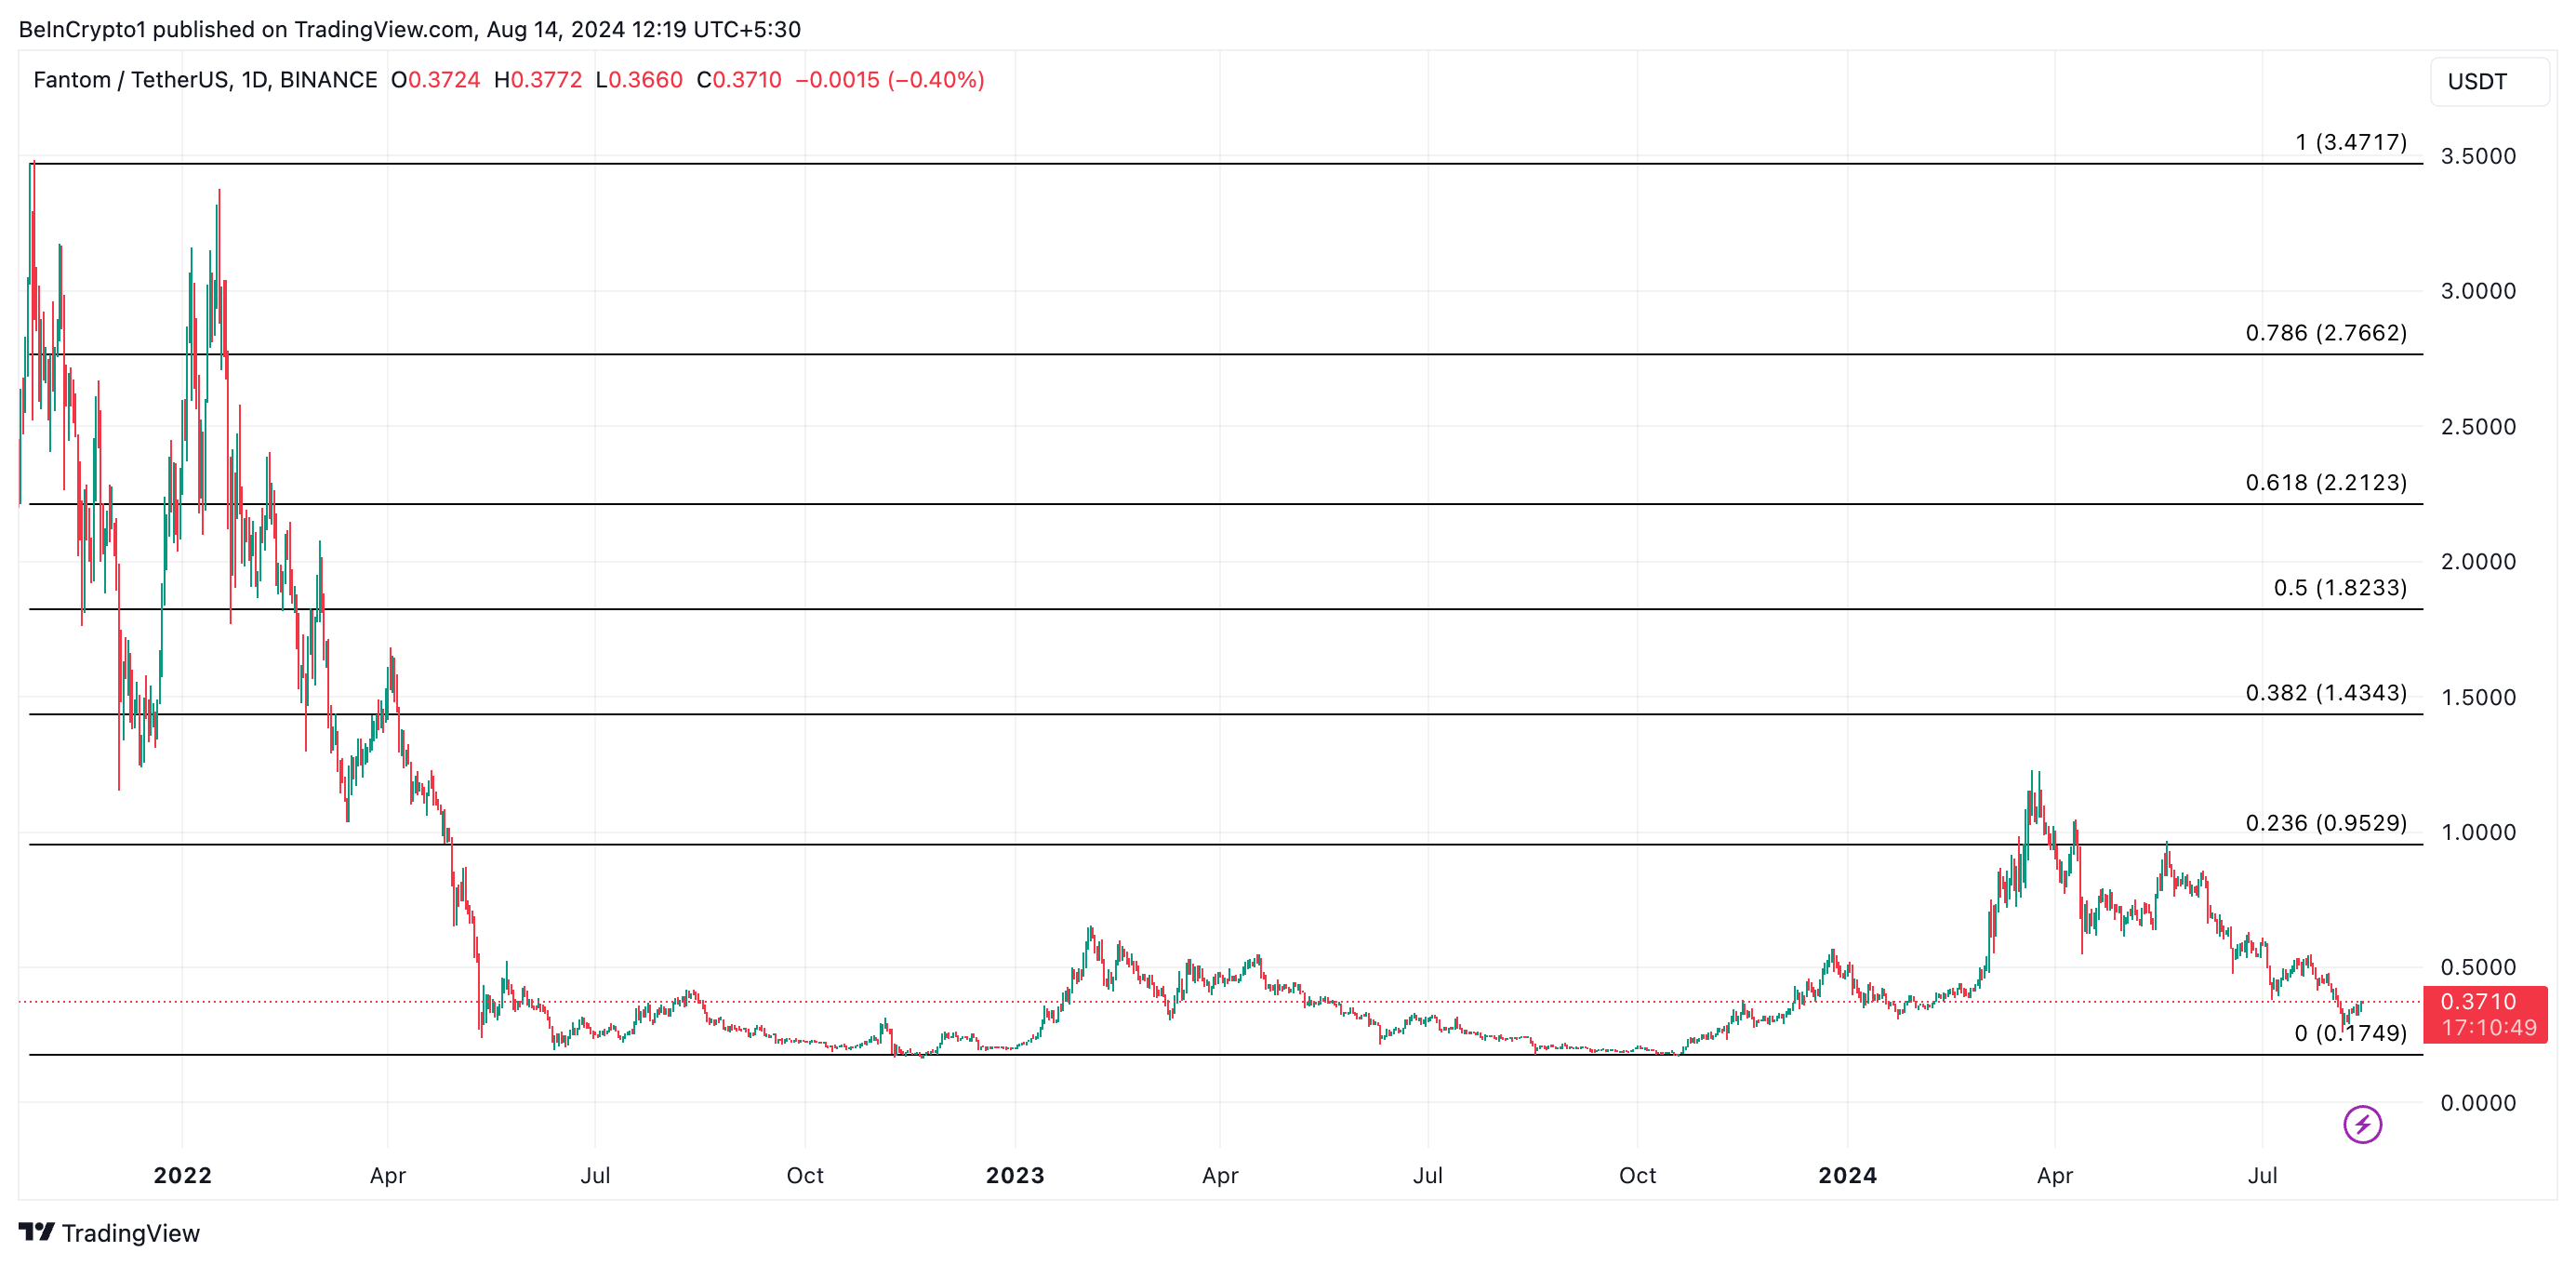
If FTM witnesses a correction, its price will drop to $0.17. However, if demand for the altcoin resurfaces, this may drive its price up to $0.95.
Disclaimer
In line with the Trust Project guidelines, this price analysis article is for informational purposes only and should not be considered financial or investment advice. BeInCrypto is committed to accurate, unbiased reporting, but market conditions are subject to change without notice. Always conduct your own research and consult with a professional before making any financial decisions. Please note that our Terms and Conditions, Privacy Policy, and Disclaimers have been updated.
Source link
Abiodun Oladokun
https://beincrypto.com/fantom-ftm-price-rally-short-live/
2024-08-14 09:15:00