Solana’s price broke the $200 psychological barrier during intraday trading on January 2. Amid this extended rally, the Pump.fun platform has been moving substantial volumes of SOL tokens to Kraken.
Despite exchange inflows generally signaling bearish sentiment due to potential selling pressure, the bullish momentum in Solana’s rally remains strong, resisting these typical trends.
Solana Sees Renewed Bullish Momentum After Major Deposits
Pump.fun executed two significant deposits to Kraken on January 1, according to Solscan data. The first transfer, valued at $22.8 million in SOL, occurred at 4:37 PM UTC, followed by a second deposit of $32.7 million at 5:45 PM. Additionally, on-chain data reveals that on January 2, the Solana-based platform designed for the easy creation and trading of memecoins, deposited 63,171 SOL ($13.11 million) into Kraken.
Generally, a surge in an asset’s exchange inflows is a bearish sign and often a precursor to a price decline. However, SOL has seen a spike in demand to absorb this spike in supply. Hence, since January 1, its price has maintained an upward trend.
In fact, during the trading session on January 2, SOL broke above a descending parallel channel, which it had traded within since November 23. This channel comprises two downward-sloping parallel trendlines formed when an asset’s price is in a downtrend.
When an asset’s price breaks above the channel’s upper boundary, it signals a potential reversal to bullish momentum, suggesting the asset may experience upward price movement.
Moreover, SOL’s price has broken above its 20-day Exponential Moving Average (EMA), confirming the uptick in demand for the altcoin. The 20-day EMA measures an asset’s average price over the past 20 trading days. It gives more weight to recent prices, making it more sensitive to recent price movements than a simple moving average.
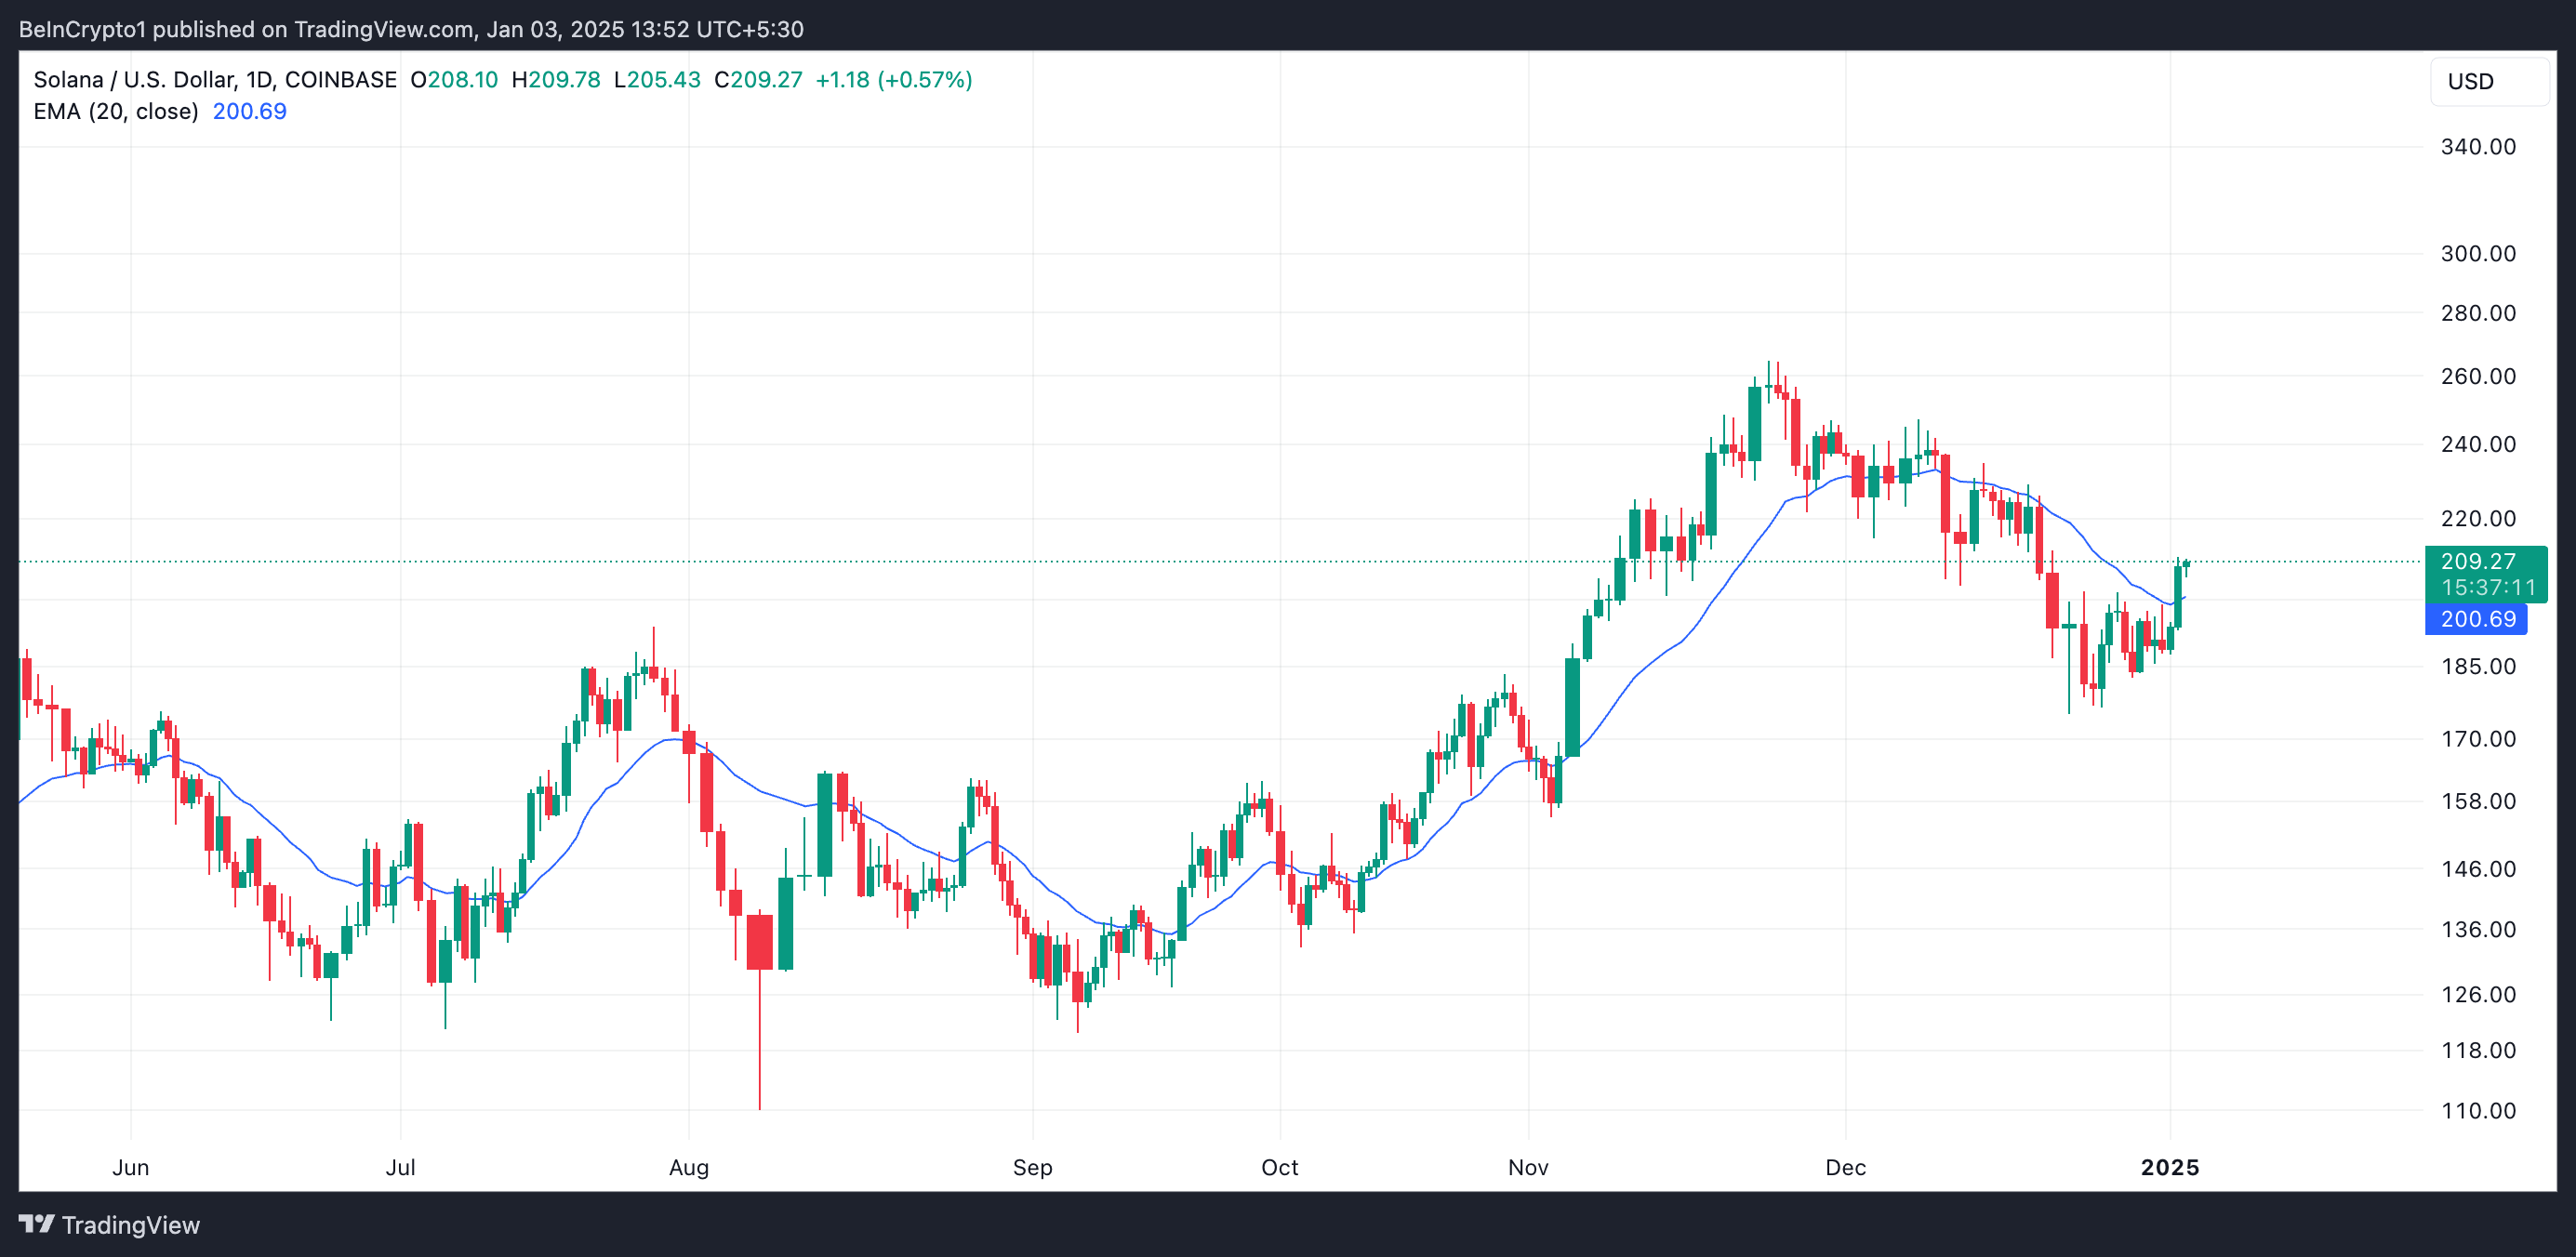
When an asset’s price surpasses the 20-day EMA, it indicates a shift toward bullish momentum, pointing to a potential uptrend as market sentiment turns increasingly positive.
SOL Price Prediction: Altcoin Could Break All-Time High
On the daily chart, readings from SOL’s Moving Average Convergence Divergence (MACD) indicator support this bullish outlook. At press time, the coin’s MACD line (blue) rests above its signal line (orange). For context, this bullish crossover occurred on January 1, when Pump.fun began depositing coins to Kraken.
When an asset’s MACD indicator is set up this way, it indicates bullish momentum. This means that the asset’s price may continue to rise as the short-term price action is stronger than the longer-term trend.
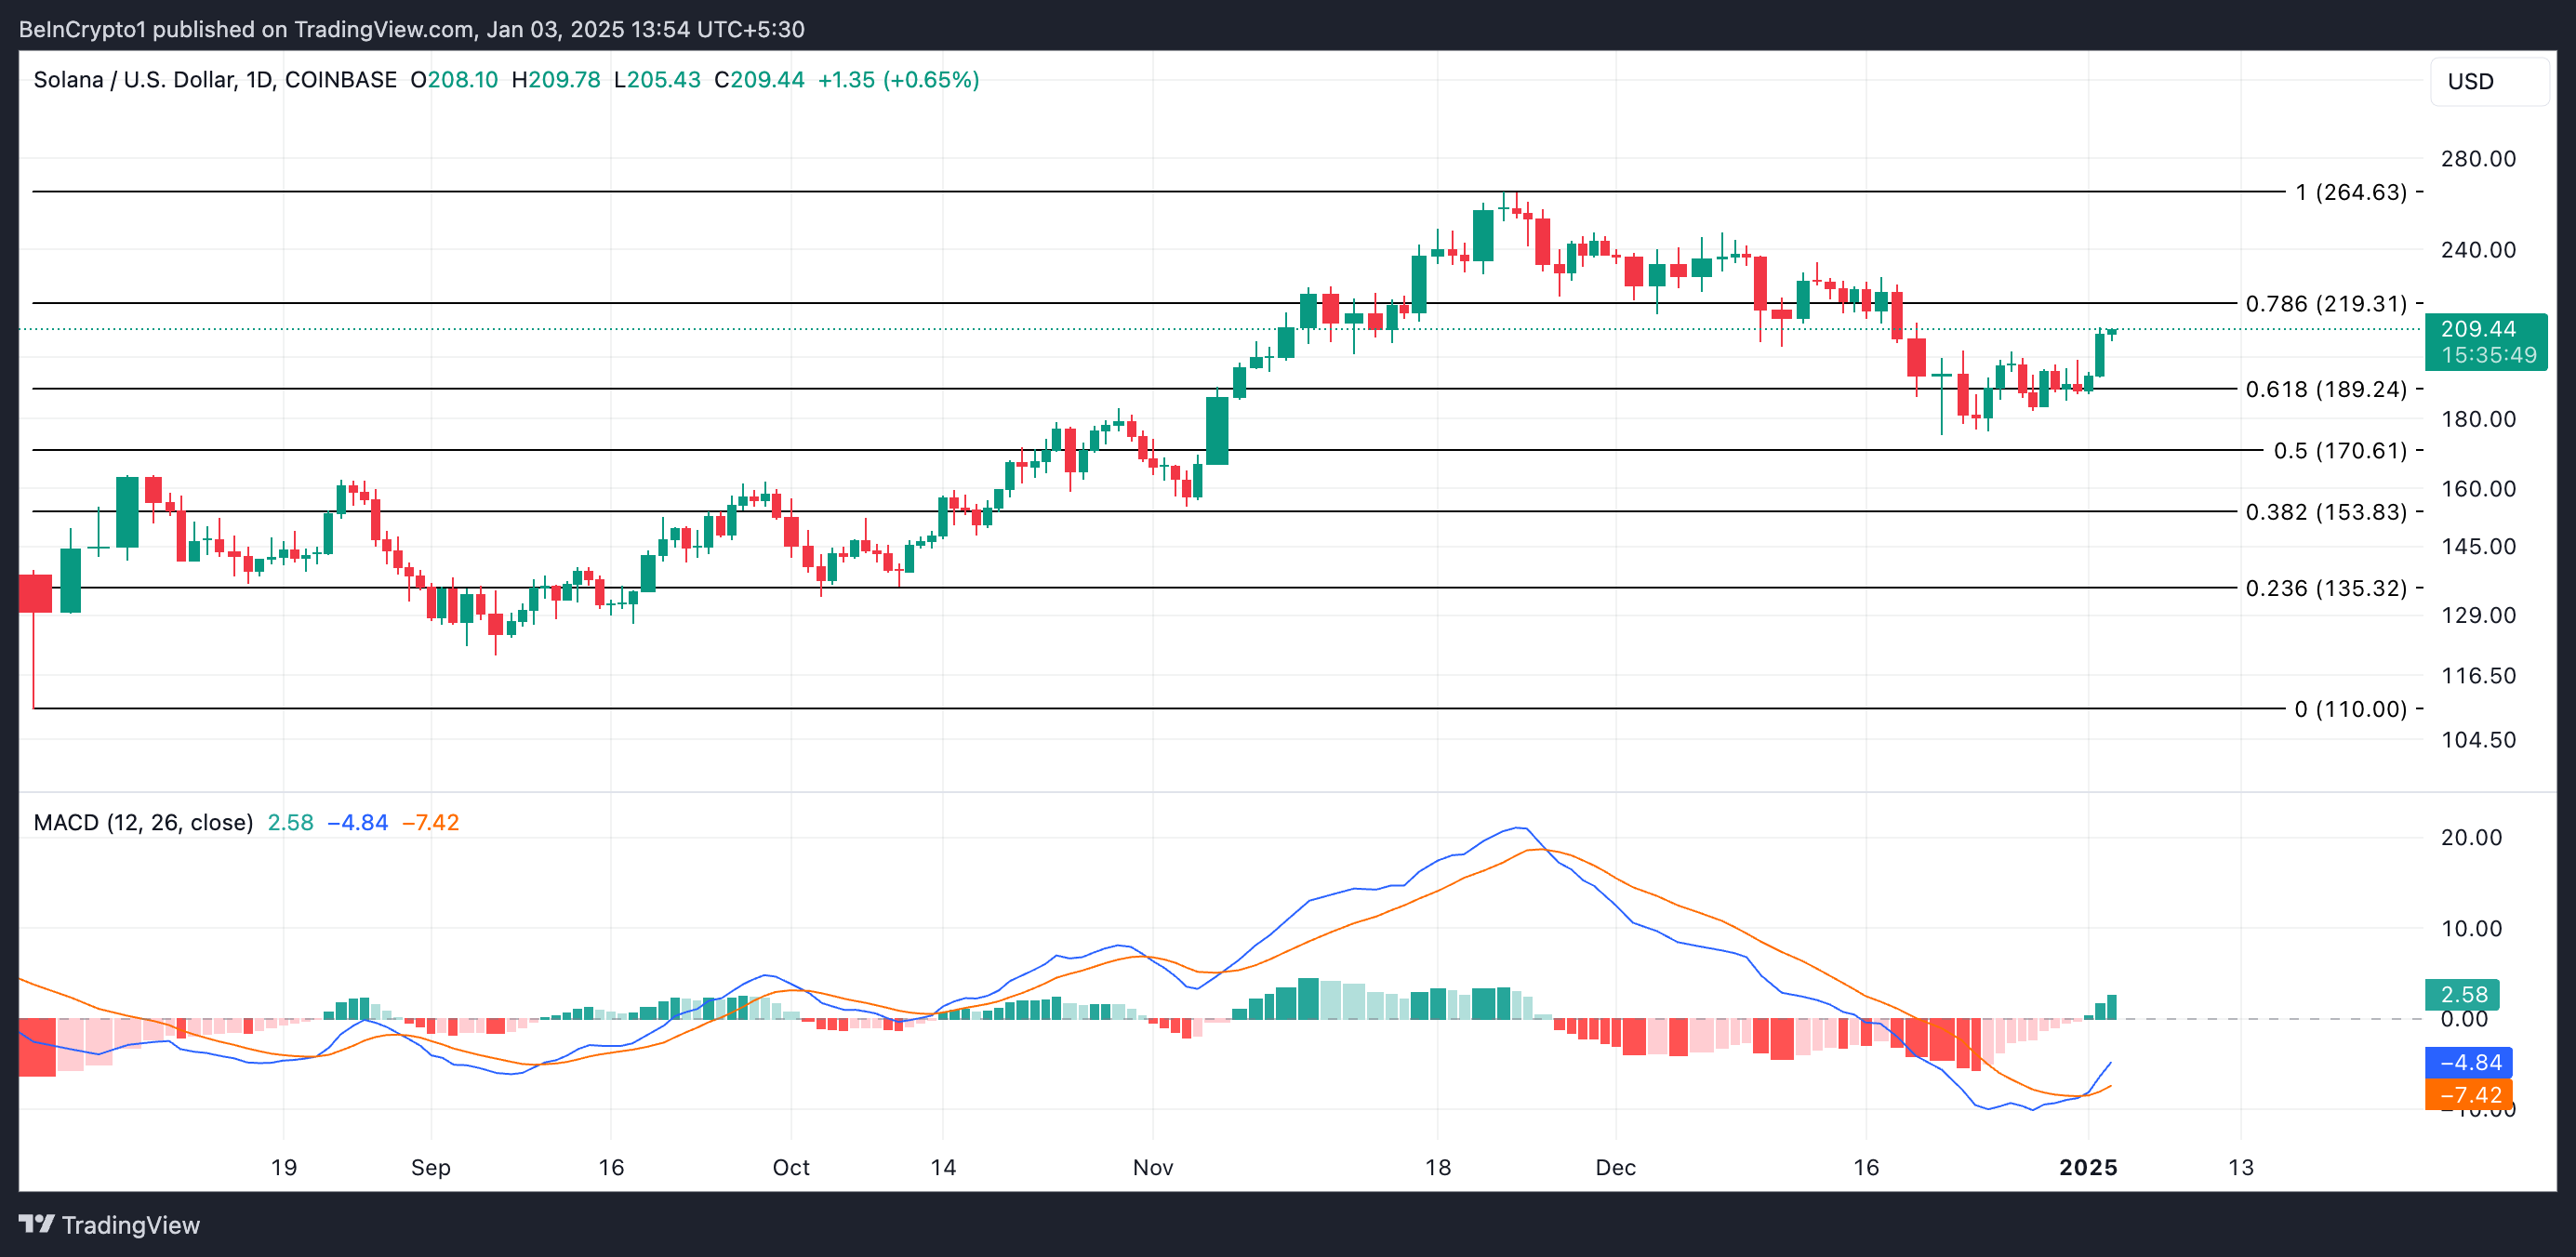
If this holds, SOL’s price could break above resistance at $219.31 and reclaim its all-time high of $264.63. Conversely, a spike in selloffs will invalidate this bullish outlook, stalling the Solana price rally. In that case, SOL’s price may drop to $189.24.
Disclaimer
In line with the Trust Project guidelines, this price analysis article is for informational purposes only and should not be considered financial or investment advice. BeInCrypto is committed to accurate, unbiased reporting, but market conditions are subject to change without notice. Always conduct your own research and consult with a professional before making any financial decisions. Please note that our Terms and Conditions, Privacy Policy, and Disclaimers have been updated.
Source link
Abiodun Oladokun
https://beincrypto.com/solana-price-rally-may-hold/
2025-01-03 10:30:00


