Year-to-date, Cardano (ADA) price has dropped by roughly 37%. But in the last seven days, the altcoin’s value has increased by 13.40%, flashing promising signs that this could be the start of a long-term rally.
While this prediction may depend on certain factors, key indicators suggest that it could come to pass.
Cardano Flashes Crucial Buy Signal
According to the weekly chart, Cardano saw a massive surge between December 2020 and May 2021, jumping from $0.15 to $1.77, a gain of 1041%. This rally was largely driven by a bullish signal when the 50-day Exponential Moving Average (EMA) crossed above the 100-day EMA.
The EMA, or Exponential Moving Average, is a technical analysis tool that gives more weight to recent prices, helping traders identify the direction of the trend. When a shorter EMA (like the 50-day) crosses above a longer EMA (such as the 100-day), it signals a bullish trend. Conversely, when the longer EMA crosses above the shorter one, it indicates a bearish trend.
In February 2021, Cardano’s 50 EMA crossed above the 100 EMA, signaling the beginning of its substantial rally. Interestingly, Cardano’s current price of $0.39 and its EMA alignment seem to mirror the setup before its previous bull run, suggesting that a breakout from a descending triangle could be on the horizon.
Read more: How To Buy Cardano (ADA) and Everything You Need To Know
Therefore, if the price breaks out of the descending channel, Cardano’s price could repeat the past performance, possibly climbing by 500% within the next six months. If that happens, ADA might trade at $2.40.
Another indicator that supports the outlook is the 30-day Market Value to Realized Value (MVRV) ratio. The higher the ratio, the higher the profitability and willingness to sell. Conversely, when the MVRV ratio is low, most holders tend to hang on to their assets.
According to Santiment, Cardano’s MVRV ratio is currently at 11.95%. This suggests that while there is some profitability, many investors might be reluctant to sell, potentially indicating a bullish sentiment that could support future price increases.
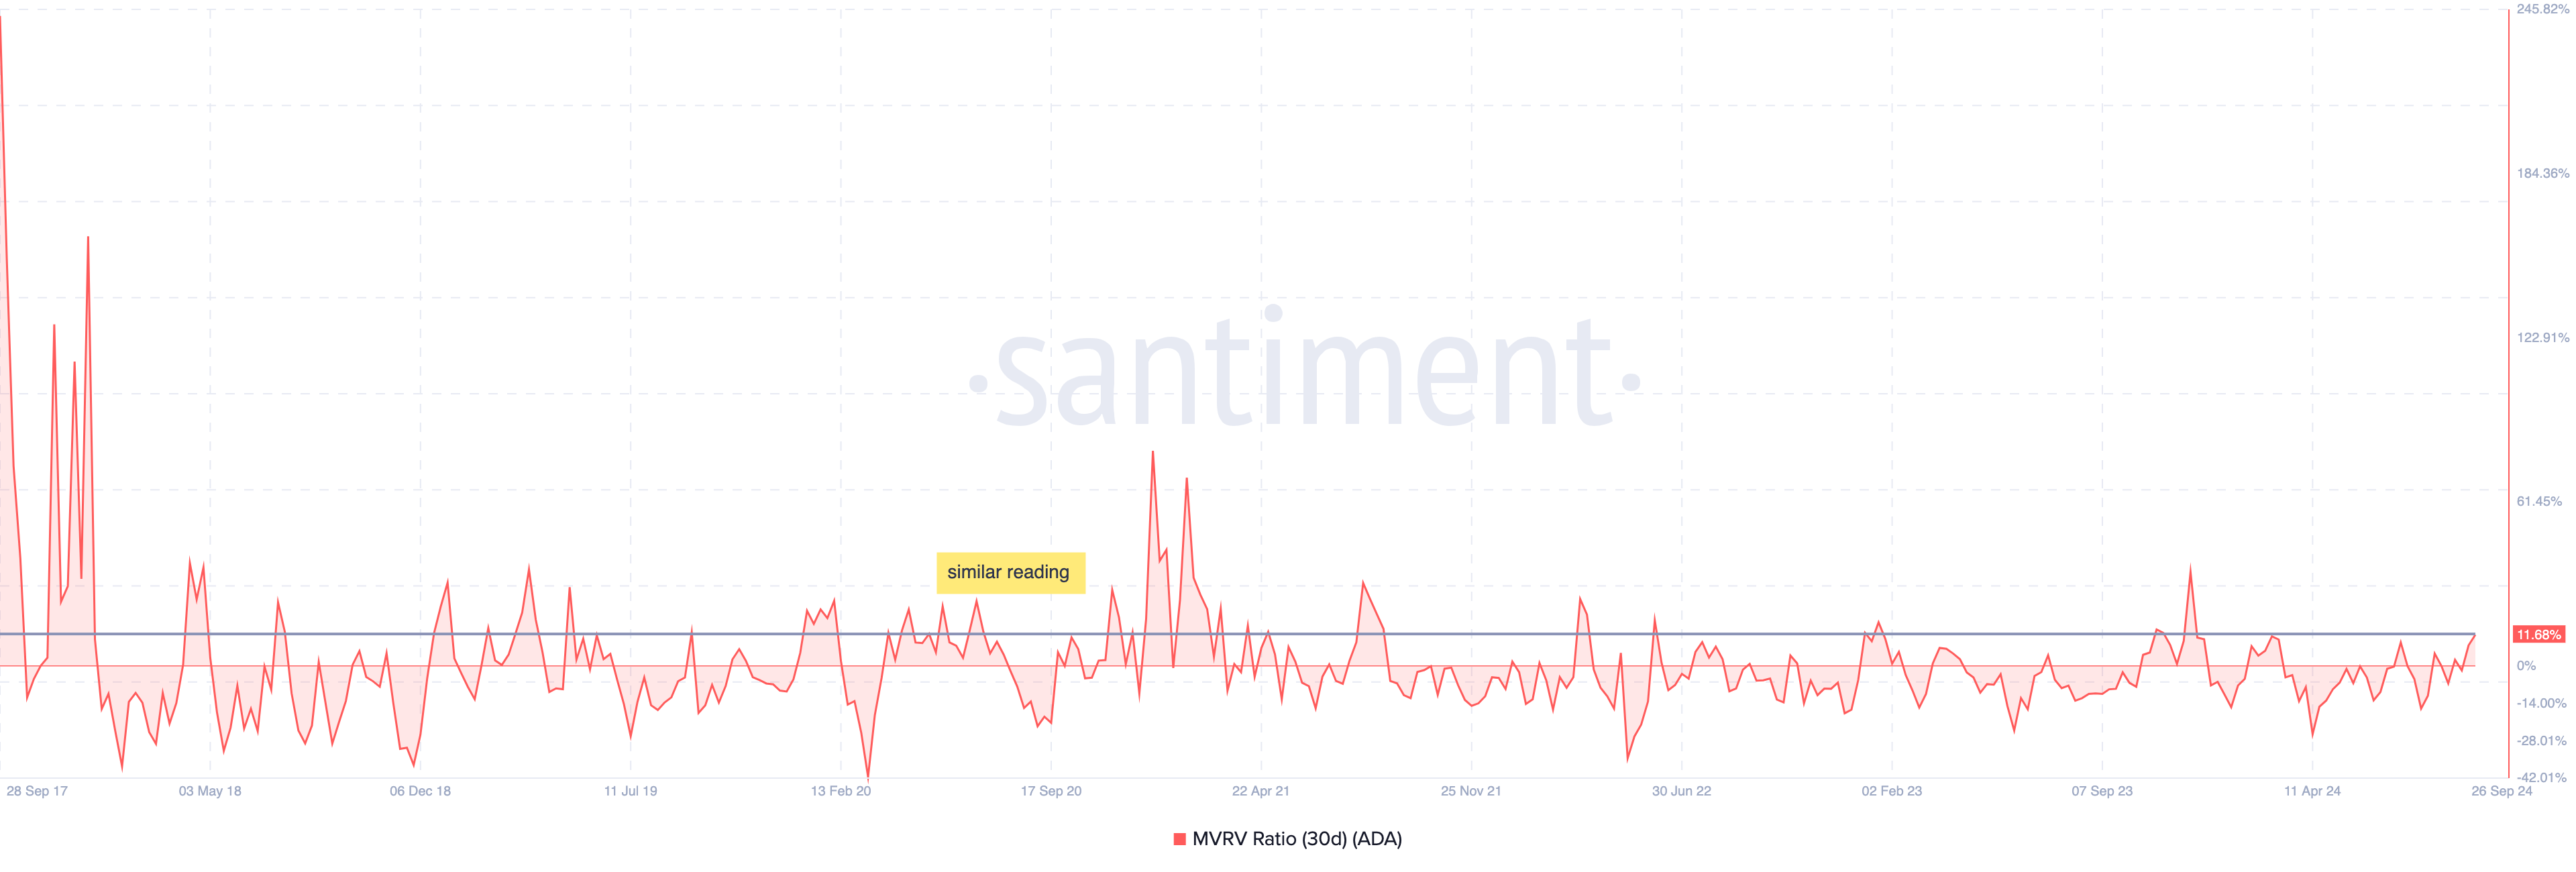
Coincidentally, this reading is the same as what it was in December 2020, reinforcing the bias that an ADA significant rally is in the works.
ADA Price Prediction: Rally to $0.70 Likely In 2024
An evaluation of the ADA/USD 3-day chart seems to align with the bullish outlook. Based on the chart, the Relative Strength Index (RSI) has risen above the neutral midpoint. As a technical indicator, the RSI measures momentum using the magnitude of price changes.
When it increases, momentum is bullish. A decrease below 50.00, however, implies that bears are in control. From the image below, Cardano’s price appears to be towing the path that saw it move from $0.47 to $0.75 earlier this year.
Read more: Top 11 Platforms To Trade the Cheapest Cryptocurrencies
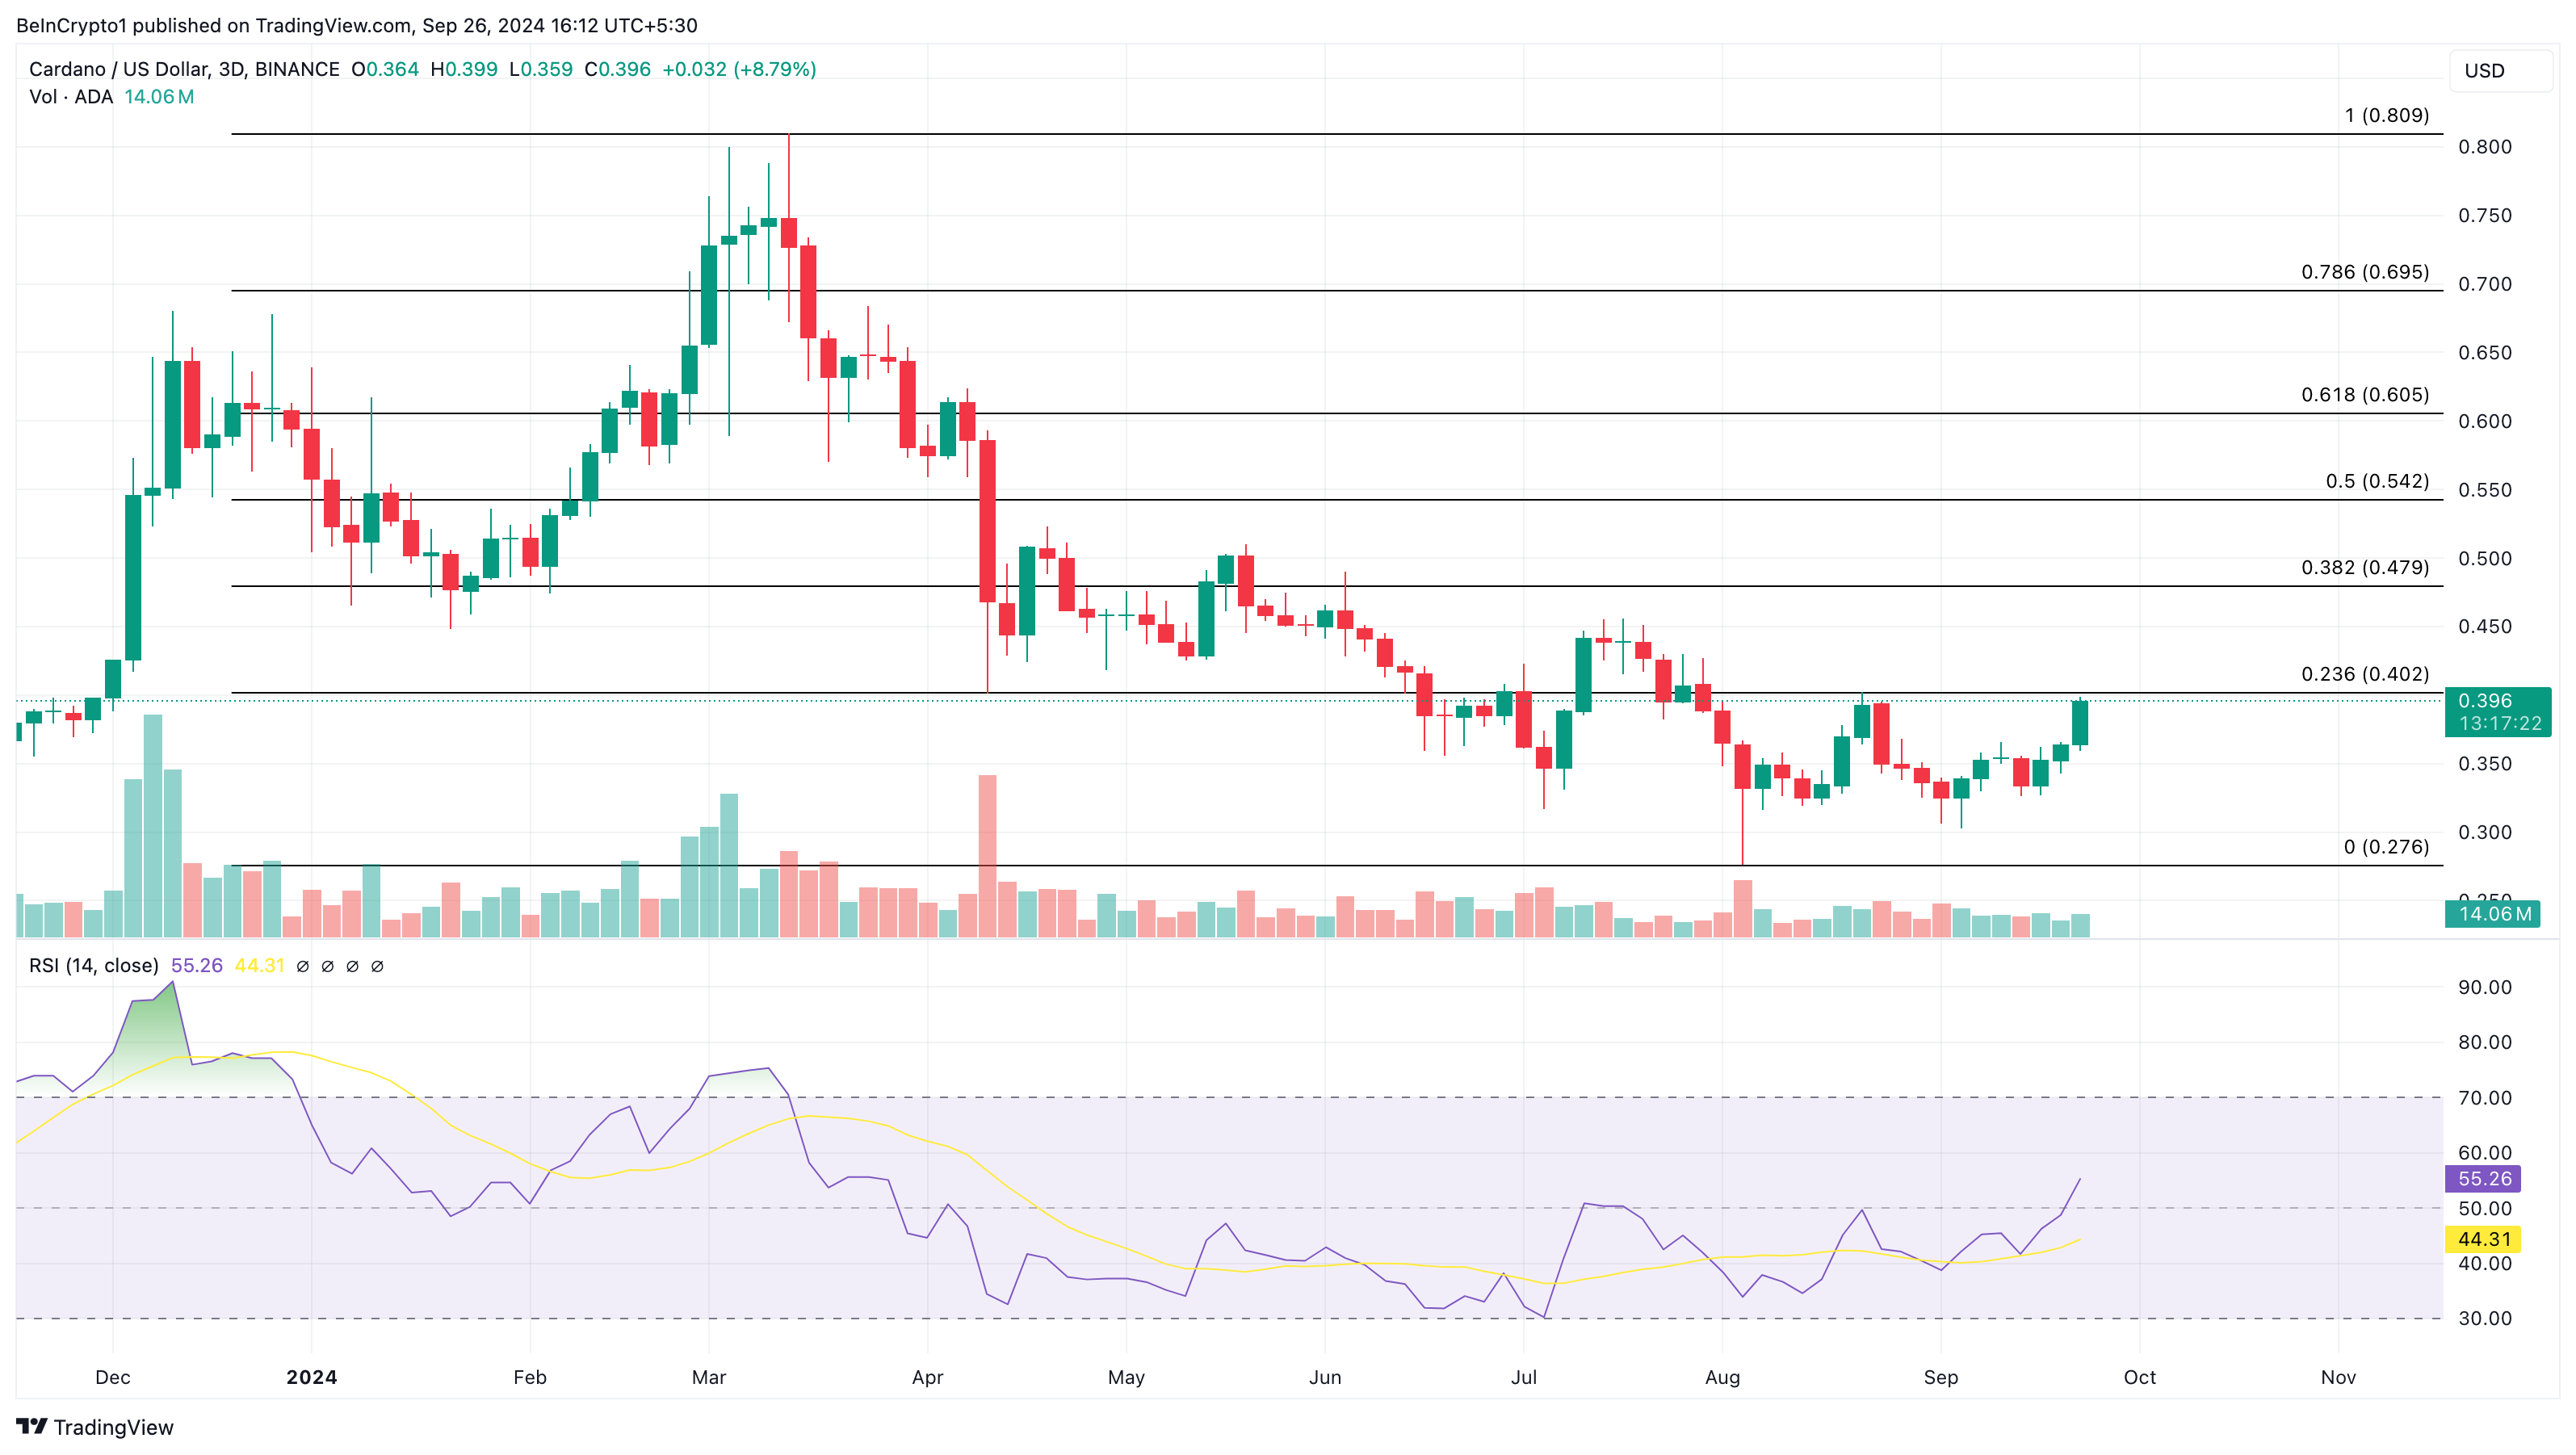
Should the momentum remain bullish, a repeat of the movement could play out. In this instance, ADA’s price might hit $0.70 before 2024 comes to a close. However, if the token gets overbought and buyers opt out of putting pressure on the price, Cardano might drop to $0.27.
Disclaimer
In line with the Trust Project guidelines, this price analysis article is for informational purposes only and should not be considered financial or investment advice. BeInCrypto is committed to accurate, unbiased reporting, but market conditions are subject to change without notice. Always conduct your own research and consult with a professional before making any financial decisions. Please note that our Terms and Conditions, Privacy Policy, and Disclaimers have been updated.
Source link
Victor Olanrewaju
https://beincrypto.com/cardano-price-could-print-profits/
2024-09-26 12:58:12

