On August 26, Chainlink’s (LINK) price jumped to $12.55, sparking speculation that that altcoin could be set for a major breakout. However, despite notable efforts to push the price higher, the uptrend met hurdles, leading to a decline to $11.25.
Currently, LINK’s technical setup presents a bearish outlook, challenging the push for a higher value. In this analysis, BeInCrypto looks at the factors obstructing the breakout and where the cryptocurrency will move.
Chainlink Hits Roadblock at $12.55
Chainlink’s (LINK) price has dropped by 17% over the last 30 days. However, on the daily chart, a symmetrical triangle has formed, characterized by two converging trendlines: one upward-sloping line connecting a series of troughs and another downward-sloping line connecting the swing highs. This pattern can be either bullish or bearish, depending on how the price action unfolds.
If LINK’s price breaks out of this symmetrical triangle, it could lead to a rally. Conversely, failure to break out might keep LINK trading within a range.
Earlier this week, LINK attempted to rise above the pattern after bulls defended the $9.95 support level. However, the price pulled back upon encountering resistance around $12.55.
Read more: What Is Chainlink (LINK)?
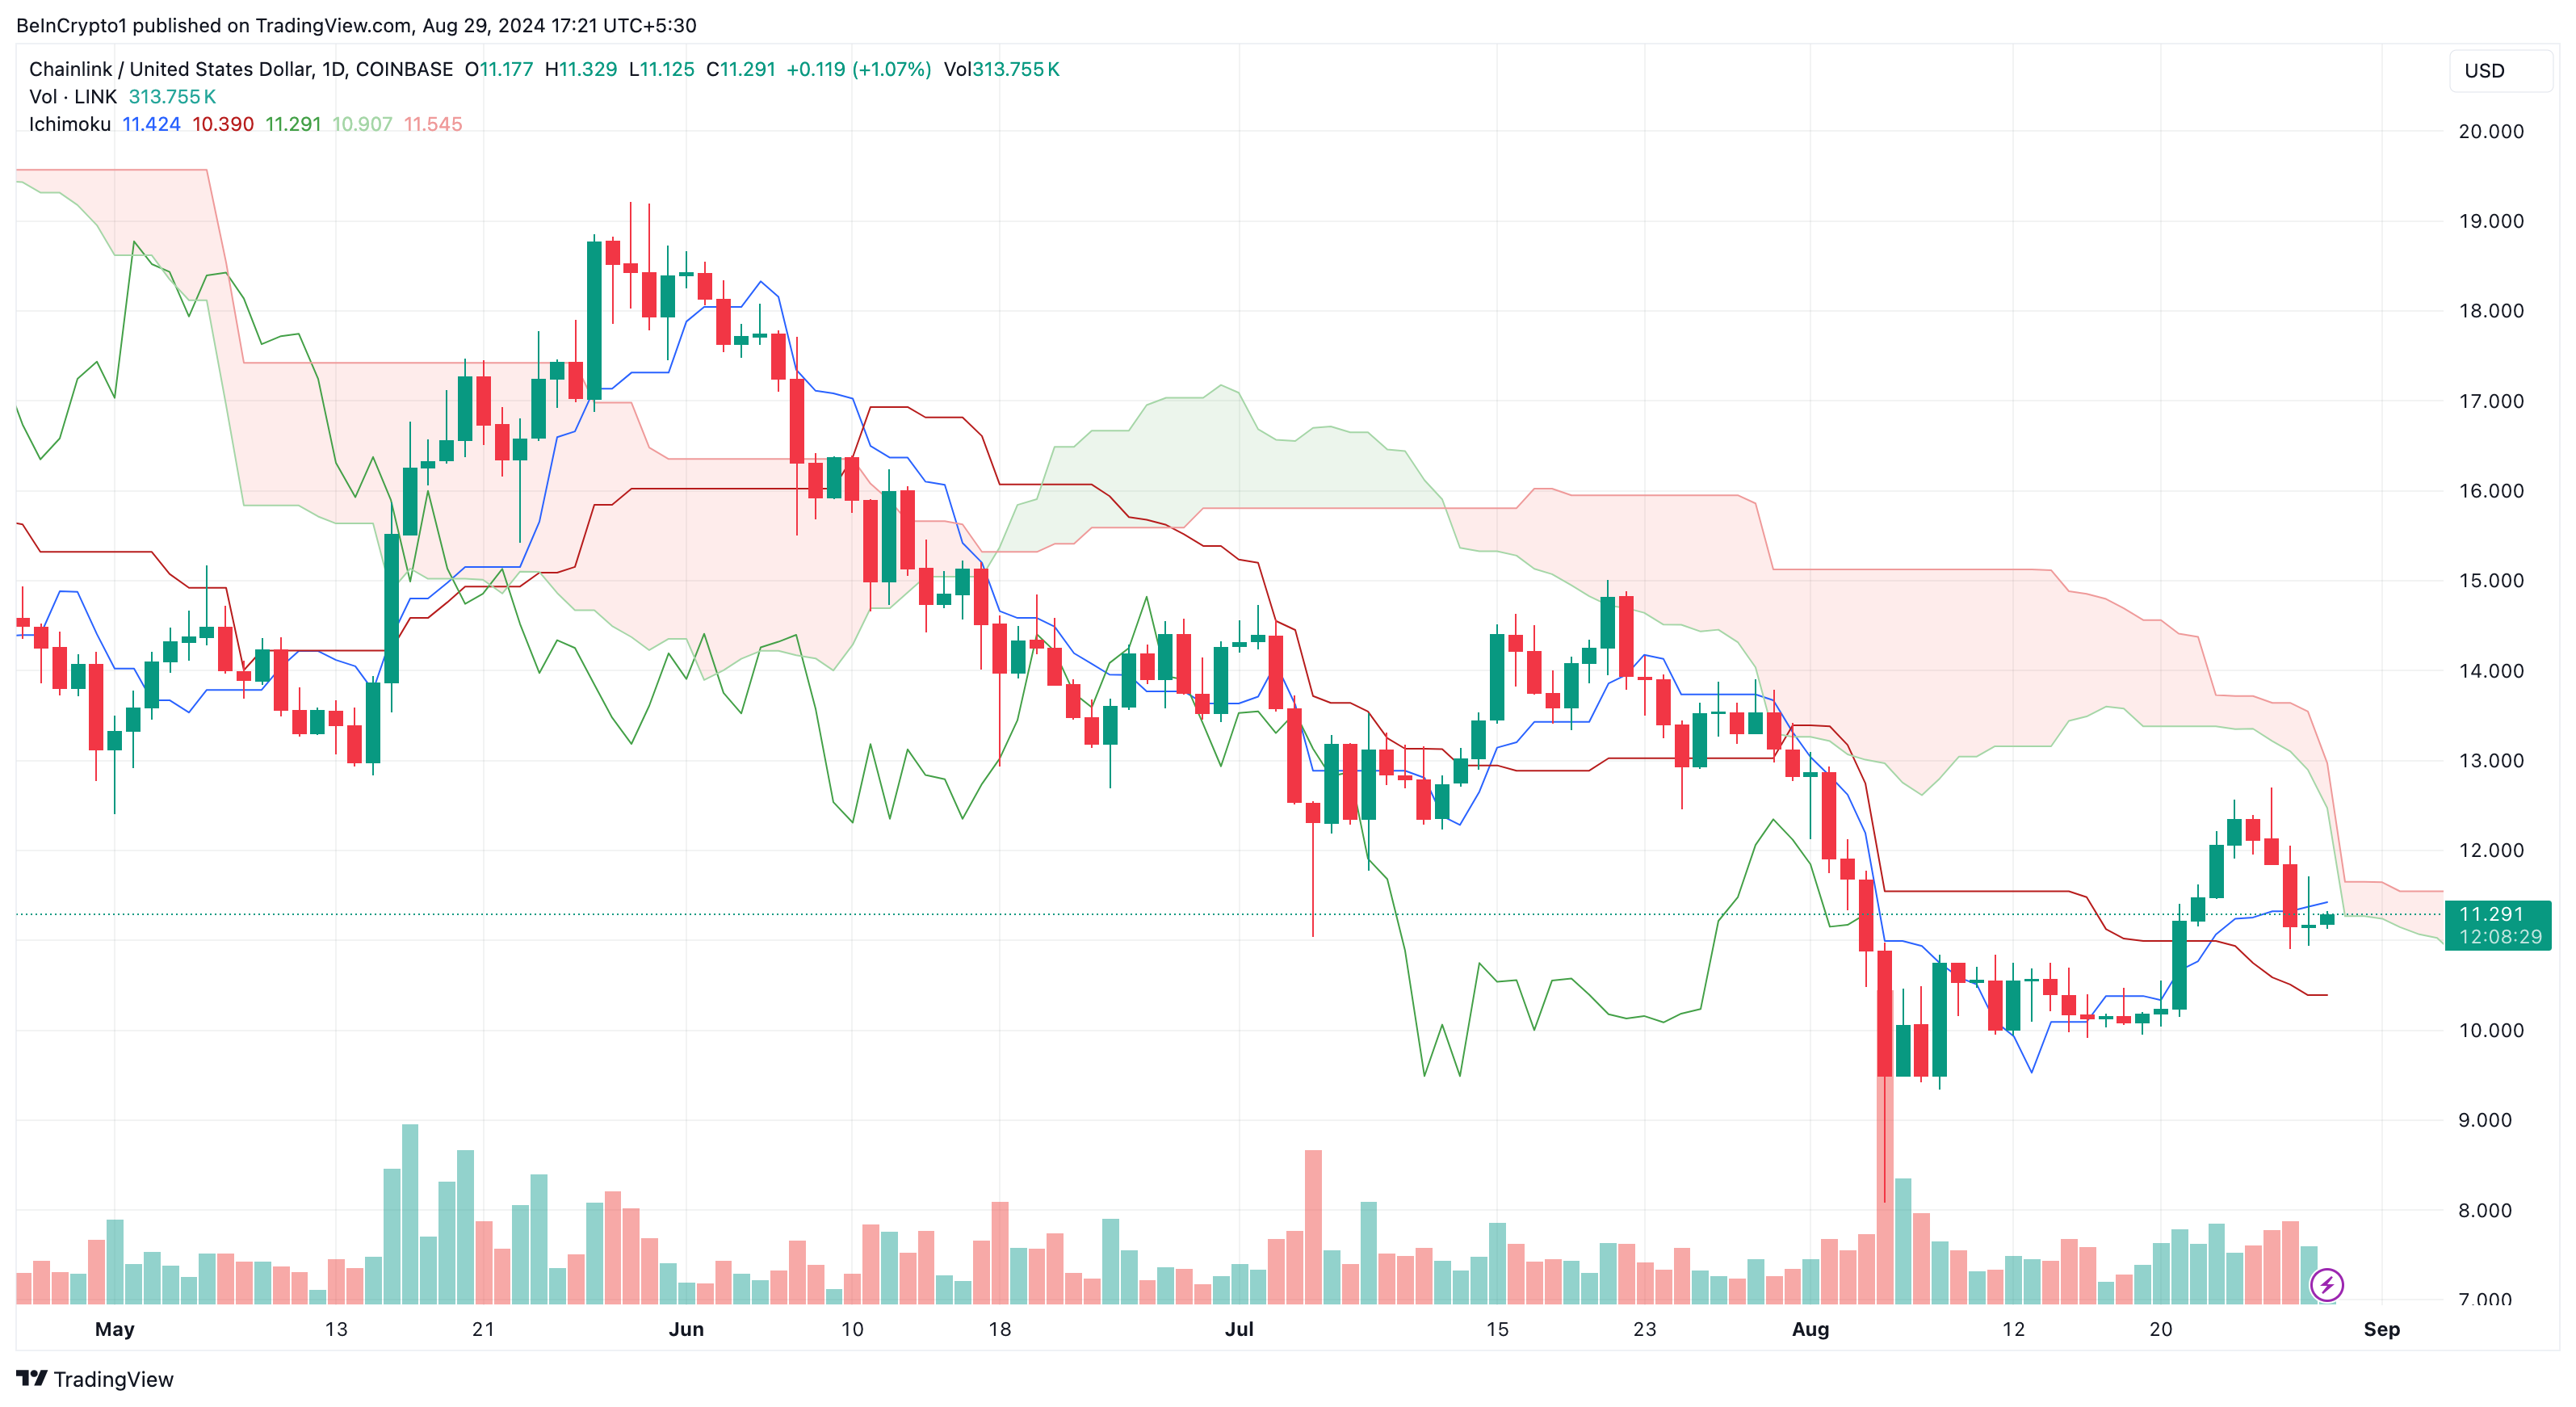
The Ichimoku Cloud, a technical analysis tool used to identify support and resistance levels, further supports this analysis. Typically, if the cloud is above the price, it suggests strong support, which increases the chances of a price increase.
In LINK’s case, the cloud remains above the price, indicating that the altcoin might struggle to rise above the $11 region in the short term.
LINK Price Prediction: Path Back to $10
A closer look at the daily chart reveals that LINK’s price is currently near the 20-day Exponential Moving Average (EMA), shown in blue. The EMA indicates the direction of the trend. Meanwhile, LINK is also trading below the 50-day EMA, shown in yellow, which suggests that the cryptocurrency doesn’t yet have a clear opportunity for a breakout.
The Fibonacci retracement indicator, which helps identify support and resistance levels, offers additional insights into LINK’s price potential. Currently, there is resistance around $12.33, where the 38.2% Fib retracement level is located.
Read more: How To Buy Chainlink (LINK) and Everything You Need To Know
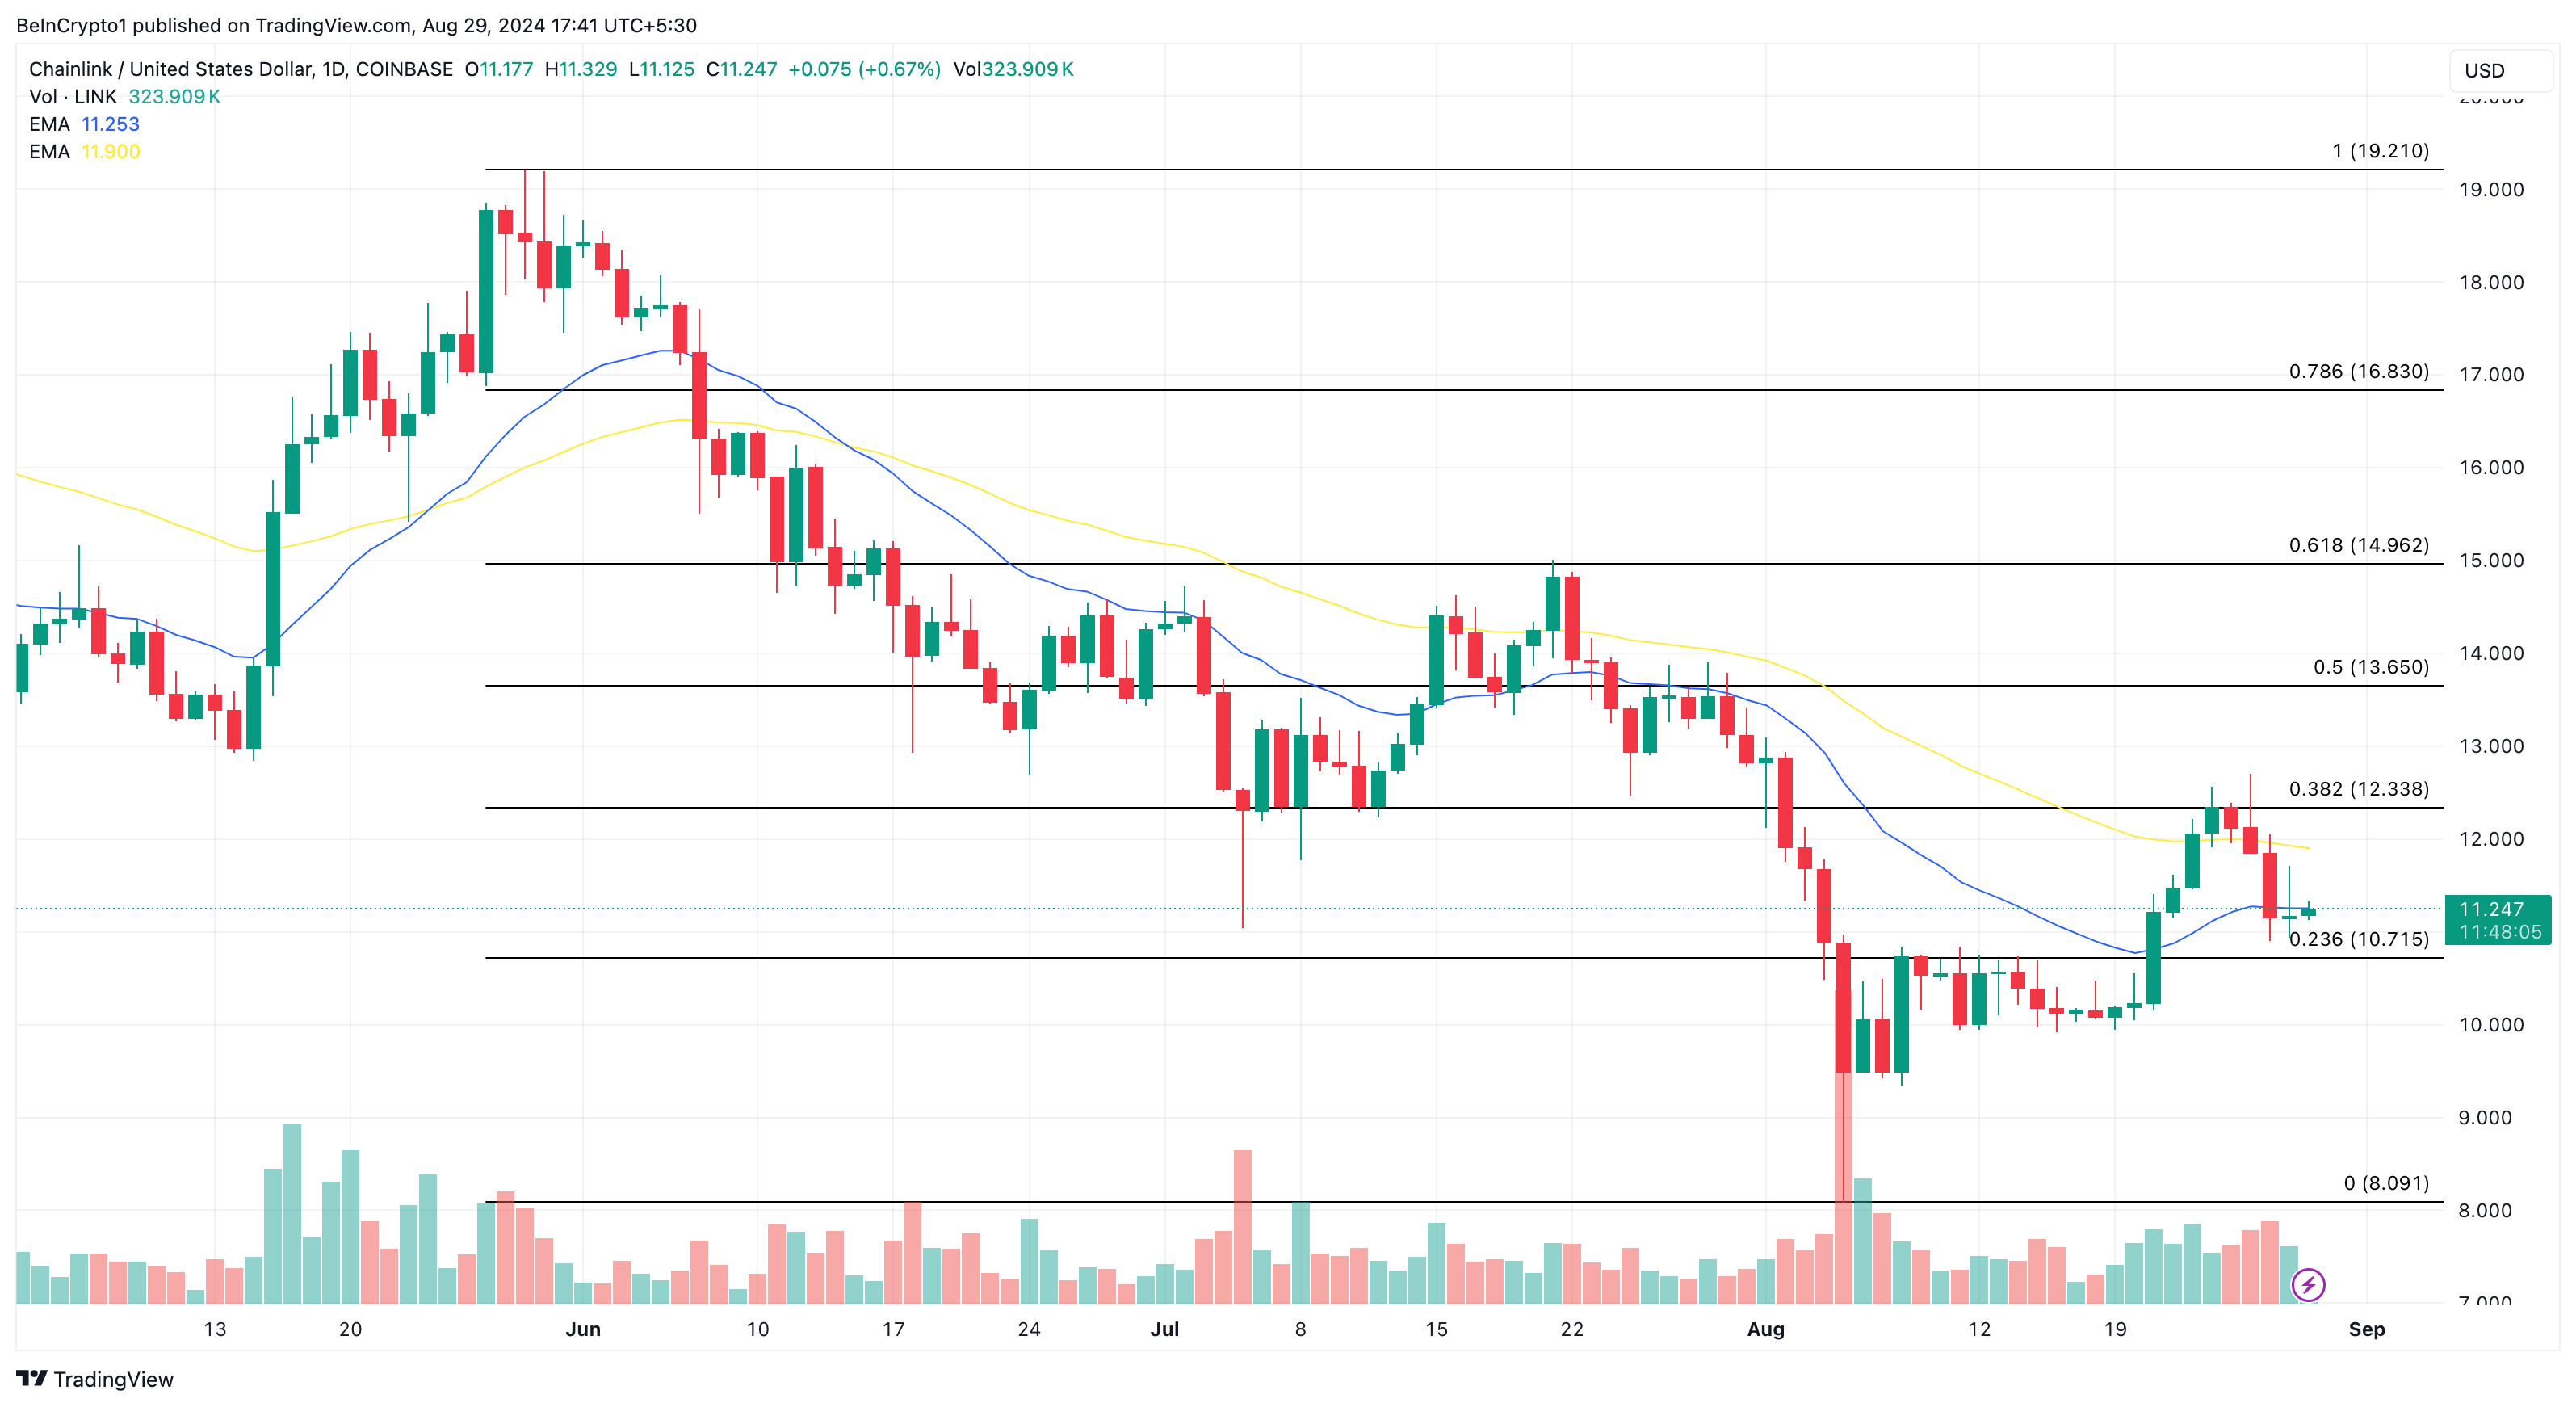
Given the weakened buying pressure, LINK might struggle to reach that resistance level in the short term, with the next potential support around $10.71. However, if Chainlink experiences a significant inflow of buying activity, the bearish scenario might not play out, and the price could potentially rise to $13.65.
Disclaimer
In line with the Trust Project guidelines, this price analysis article is for informational purposes only and should not be considered financial or investment advice. BeInCrypto is committed to accurate, unbiased reporting, but market conditions are subject to change without notice. Always conduct your own research and consult with a professional before making any financial decisions. Please note that our Terms and Conditions, Privacy Policy, and Disclaimers have been updated.
Source link
Victor Olanrewaju
https://beincrypto.com/chainlink-attempt-to-breakout-hindered/
2024-08-29 14:49:32