PEPE price has been under pressure recently, struggling to maintain a foothold at $0.00001000, which was previously a critical support level. This failure has intensified bearish sentiment around the meme coin, leaving it vulnerable to further losses.
As PEPE battles to reclaim stability, technical indicators and investor behavior suggest mixed signals for the potential of a recovery.
PEPE Investors Have an Opportunity
PEPE’s macro momentum currently reflects strong bearish undertones, as shown by the Moving Average Convergence Divergence (MACD) indicator. The MACD shows a downward trajectory, highlighting a growing bearish trend for PEPE. When MACD lines point downward, it typically signals sustained selling pressure, and in PEPE’s case, this trend has been persistent. This suggests that the meme coin’s downtrend could extend further unless a reversal signal emerges.
The bearish momentum hinted at by the MACD underlines market caution and could deter short-term buyers. Extended bearish indicators usually warn investors of possible continued losses.
Read more: Pepe: A Comprehensive Guide to What It Is and How It Works
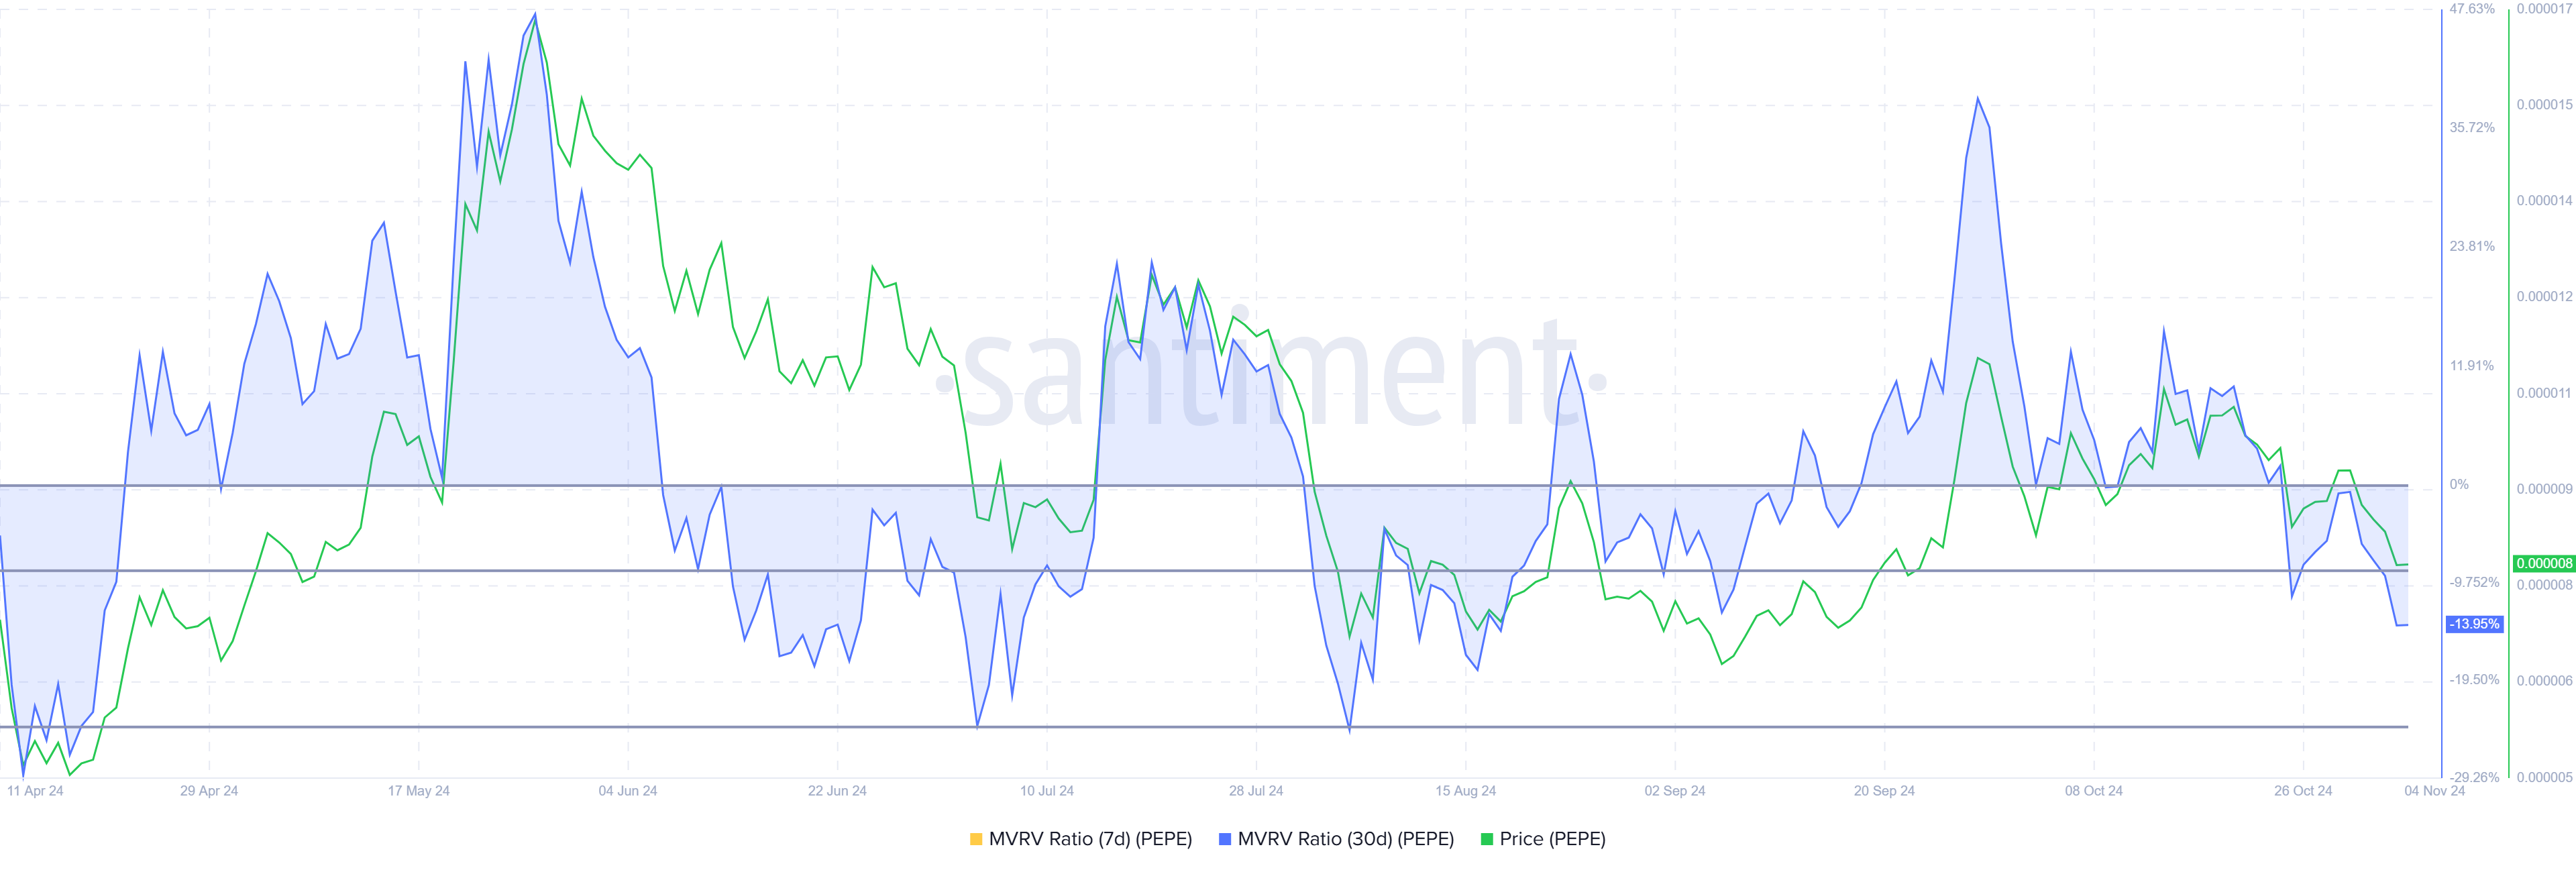
Despite the strong bearish momentum, PEPE’s Market Value to Realized Value (MVRV) ratio is displaying signs of relief. The MVRV ratio, which assesses whether investors are in profit or loss, has dipped into the “opportunity zone,” a range between -8% and -24%. When the MVRV ratio enters this range, it signals that prices are appealing for accumulation rather than selling, historically marking a potential reversal point.
This “buy zone” tends to reduce selling pressure while encouraging buying activity. Low prices in this range have typically discouraged selling, enticing investors to accumulate instead. If history holds, this shift in investor behavior could provide the foundation PEPE needs for a price rebound from its current lows.

PEPE Price Prediction: Bearing losses
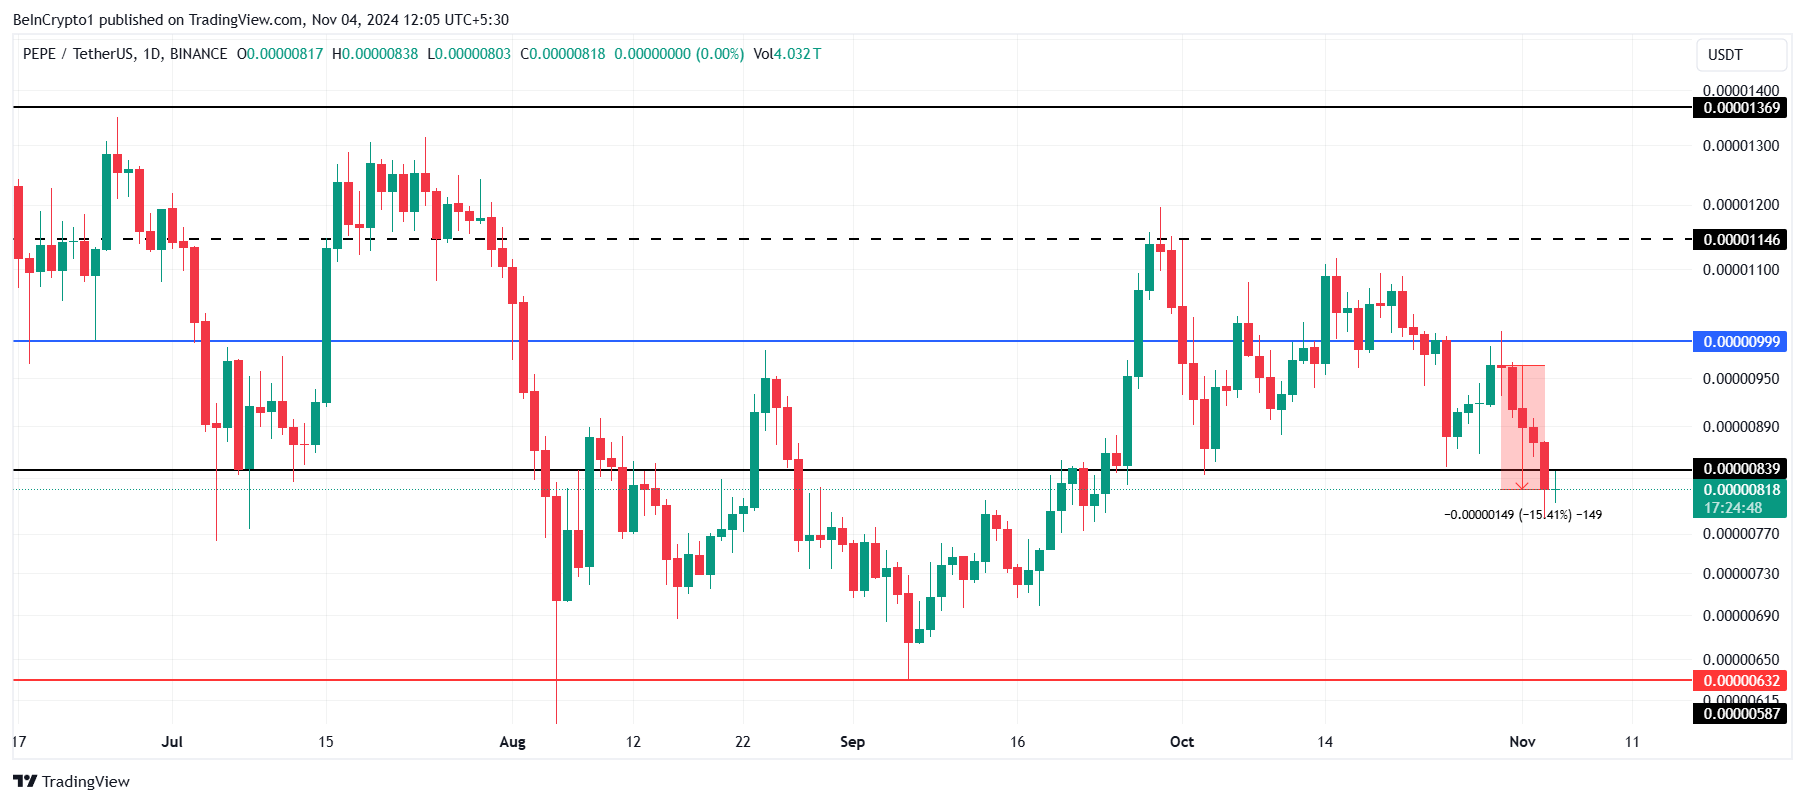
In recent days, PEPE’s price has dropped by 15%, trading at $0.00000818, a monthly low, slipping below the critical support level of $0.00000839. This decline highlights the challenges PEPE faces, as losing the support level could signal additional downside if investors don’t step in.
Should investors respond to the MVRV “buy” signal, PEPE could see a reversal, reclaiming $0.00000839 as a support level. Reclaiming this price floor would likely signal renewed bullishness, potentially driving the meme coin toward testing $0.00000999, a significant level for confirming a stronger recovery.
Read more: Pepe (PEPE) Price Prediction 2024/2025/2030

If this buying momentum fails to materialize, PEPE could remain vulnerable to further declines. A dip below $0.00000800 would challenge any bullish outlook, signaling the potential for extended losses and possibly invalidating the current thesis of a recovery.
Disclaimer
In line with the Trust Project guidelines, this price analysis article is for informational purposes only and should not be considered financial or investment advice. BeInCrypto is committed to accurate, unbiased reporting, but market conditions are subject to change without notice. Always conduct your own research and consult with a professional before making any financial decisions. Please note that our Terms and Conditions, Privacy Policy, and Disclaimers have been updated.
Source link
Aaryamann Shrivastava
https://beincrypto.com/pepe-price-plunge-creates-opportunity/
2024-11-04 07:16:45


