Several Ethereum (ETH) on-chain metrics suggest a potential short-term price correction after the cryptocurrency’s 35% rally over the past 30 days. ETH recently touched the $4,000 mark, prompting concerns that it was overbought.
As the price reaches this key resistance level, the metrics suggest that selling pressure may intensify, potentially leading to a pullback before any further upward movement.
Ethereum Flashes Bearish Signs
One of the top Ethereum on-chain metrics suggesting this decline is the price-Daily Active Addresses (DAA) divergence. Simply put, the price DAA divergence shows whether a cryptocurrency’s value is increasing alongside user engagement or not.
When the metric’s reading is positive, it implies that user engagement has increased, and as such, it presents an opportunity for the price to go further high. On the other hand, when the price DAA is negative, it implies that network activity has decreased, and therefore, the upswing could stall.
According to Santiment, Ethereum’s price DAA divergence has dropped to -64.17%. This steep decline indicates a drop in addresses interacting with the cryptocurrency. Given the conditions stated above, ETH’s price could decrease as a result.
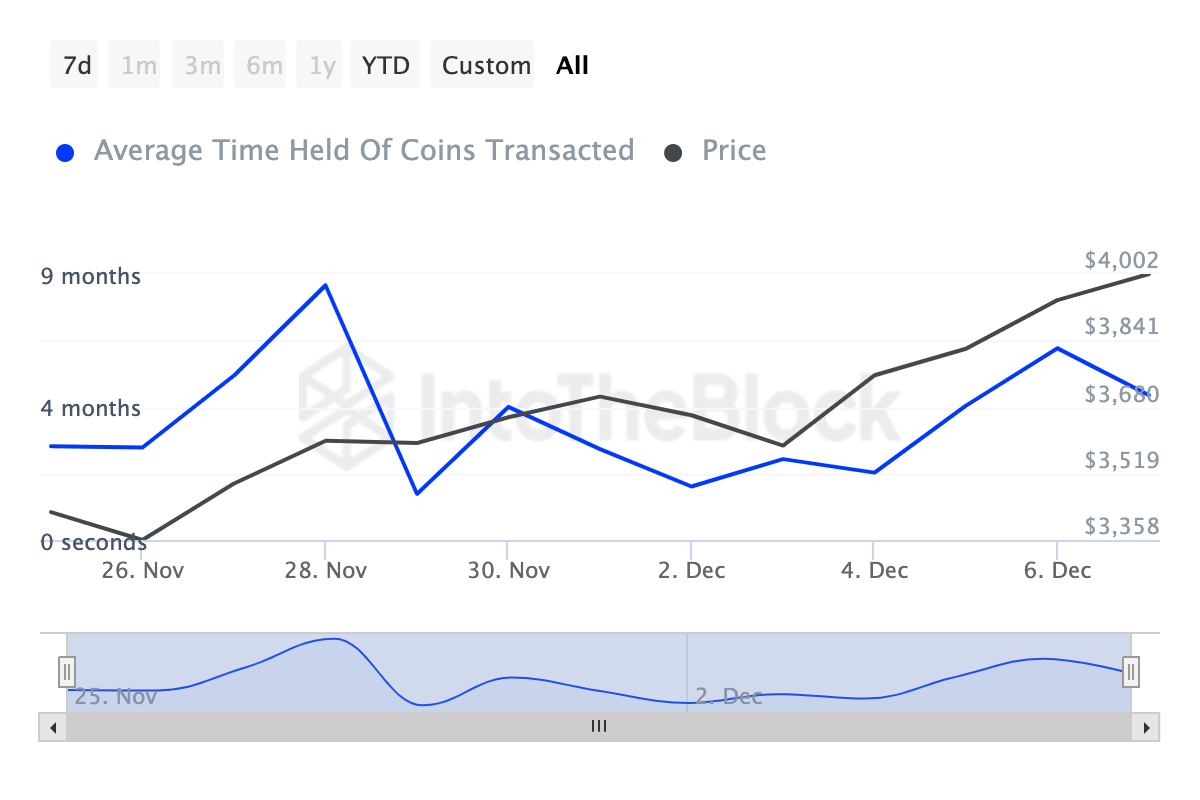
Furthermore, BeInCrypto’s analysis of the Coins’ Holding Time also aligns with this bias. The Coins Holding Time measures the amount of time a cryptocurrency has been held without being sold or transacted.
When it increases, it means most holders have decided not to sell. But a decrease, on the other hand, indicates otherwise.
According to IntoTheBlock, Ethereum’s Coins Holding Time has decreased since December 6, suggesting that the cryptocurrency is facing selling pressure. If this trend continues in the coming days, ETH’s price could drop below the $3,900 threshold.

ETH Price Prediction: Back Below $3,800?
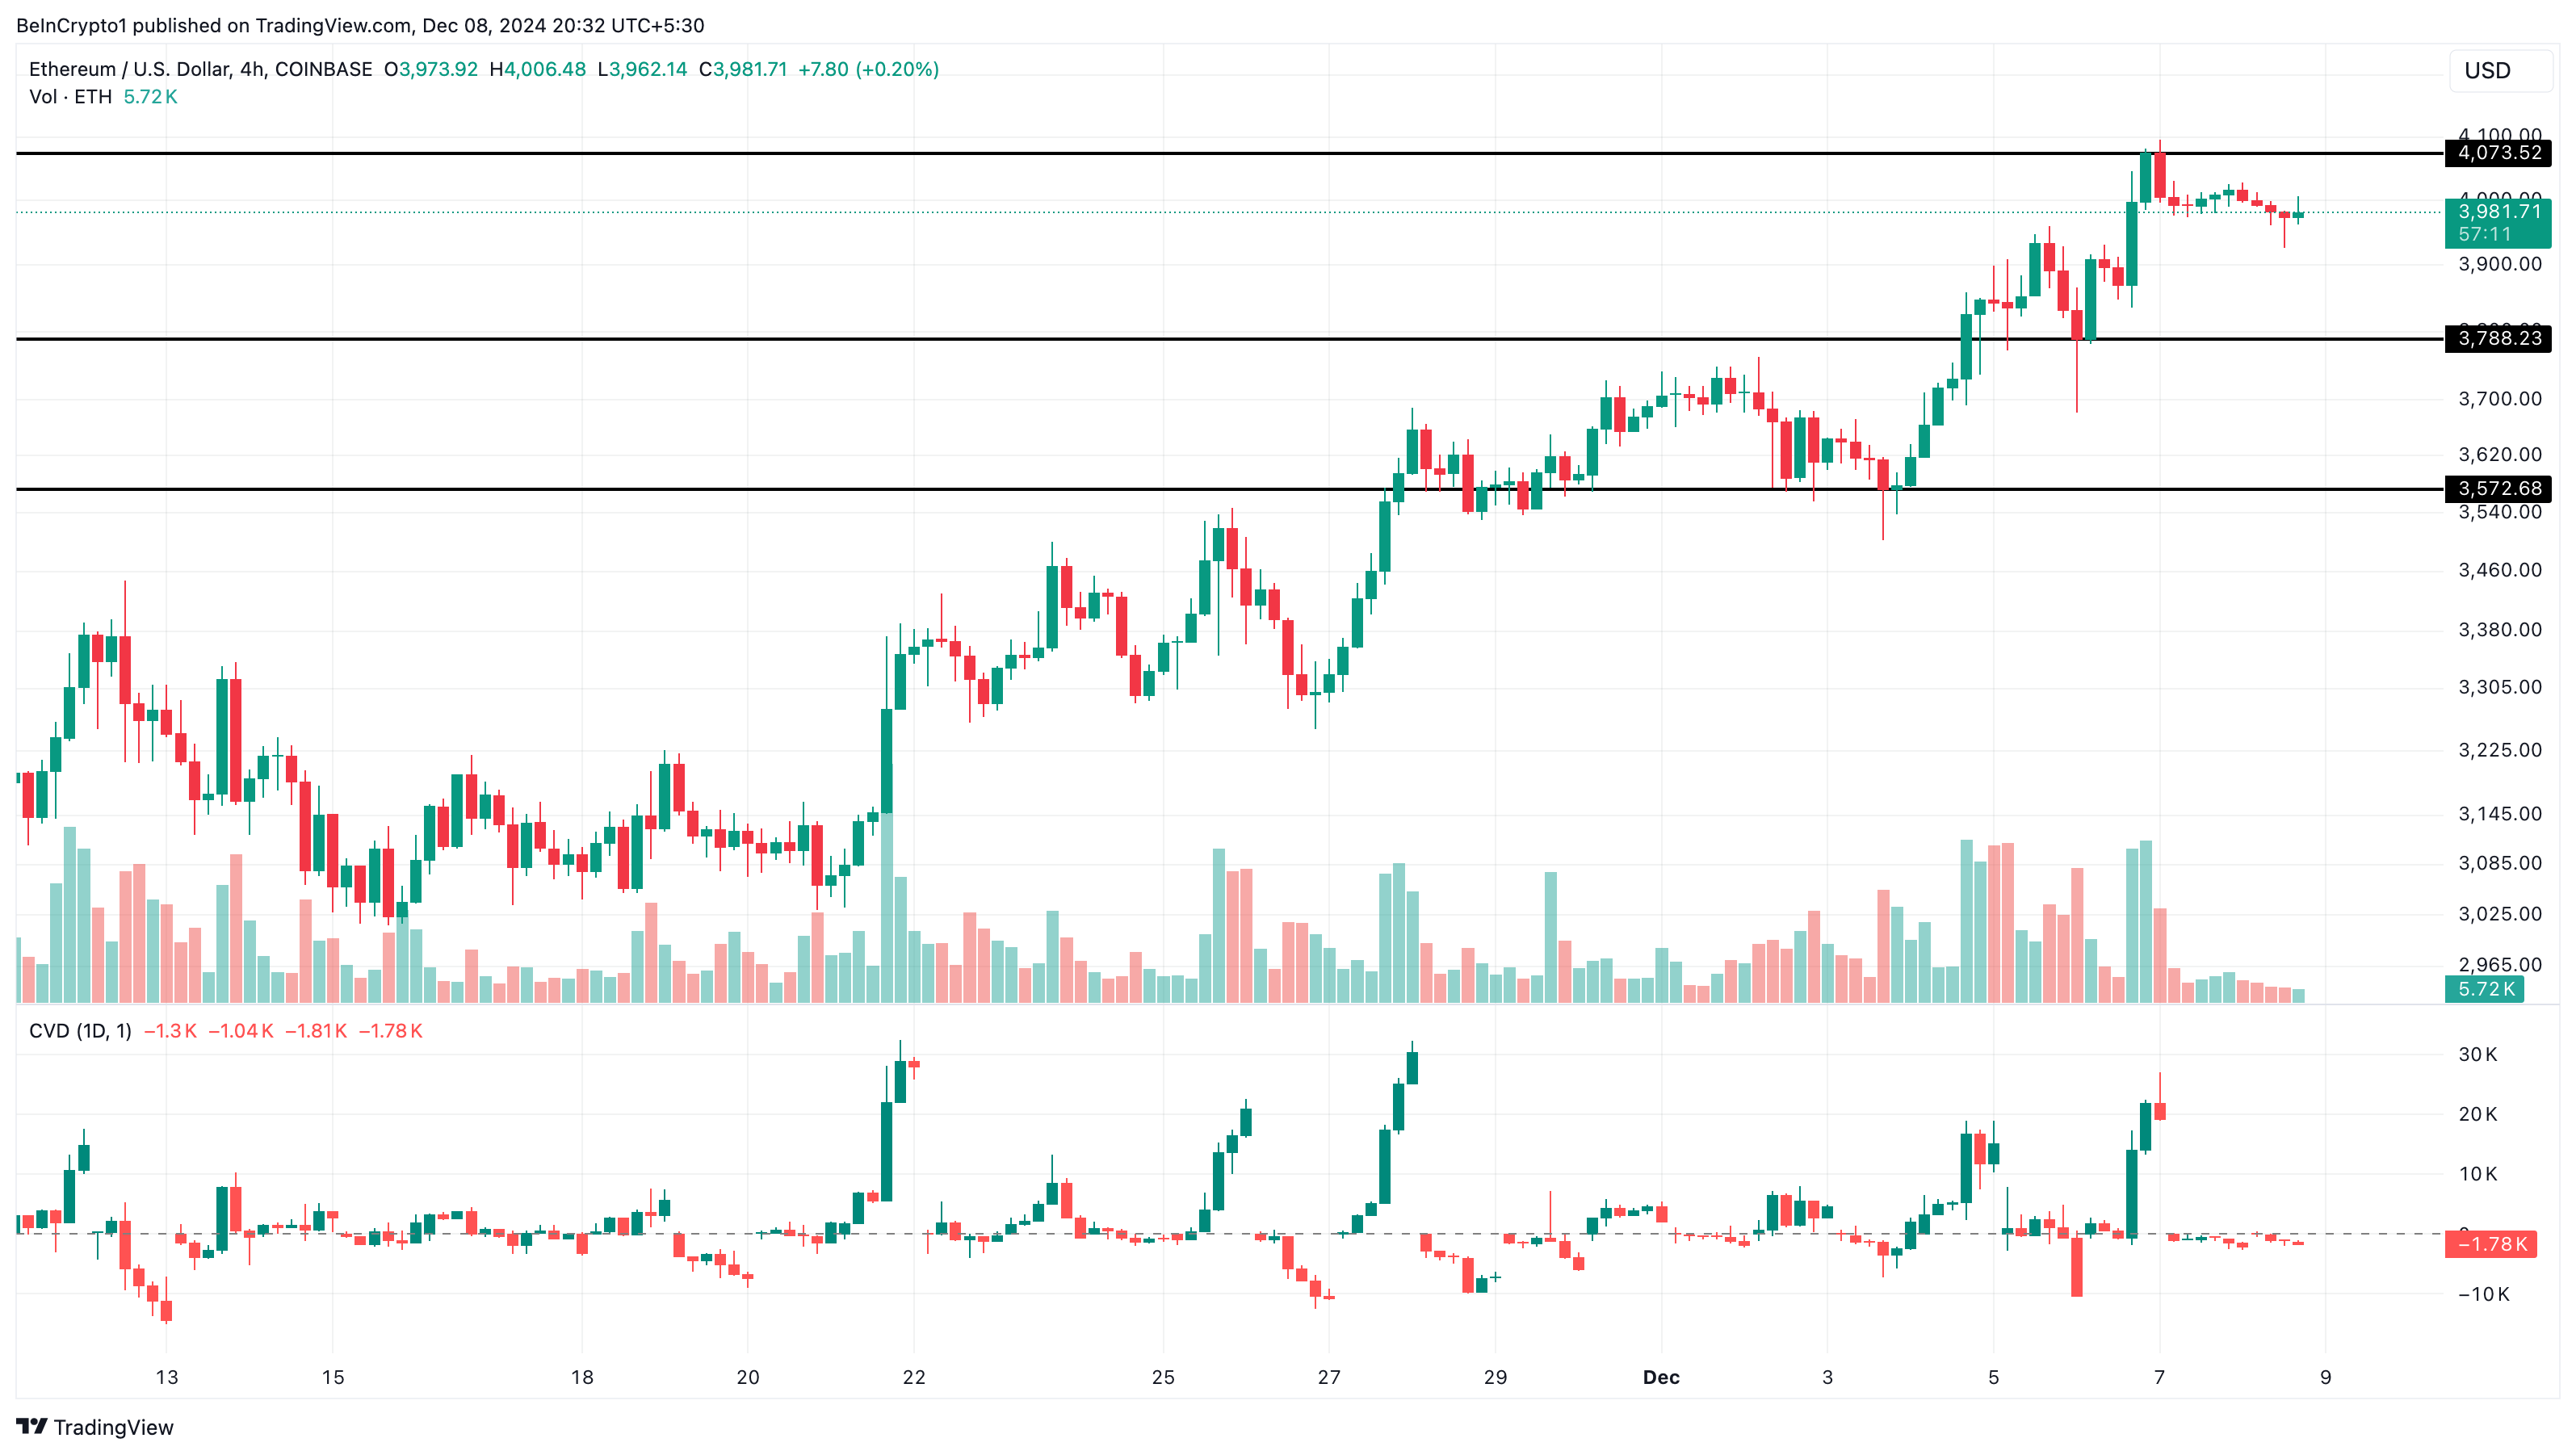
On the 4-hour chart, Ethereum’s price faced resistance at $4,073, leading to a pullback to $3,985. Also, the Cumulative Volume Delta (CVD) has dropped to negative territory.
The CVD is a technical analysis tool that provides a detailed view of buying and selling pressure in the market. With the indicator, traders can tell the net difference between buying and selling volumes over a specific time period.
When the CVD is positive, it means buying pressure is dominant. On the other hand, a negative CVD indicates rising selling pressure, which is the case with ETH.

Should this remain the same, then Ethereum’s price might drop to $3,788. In a highly bearish situation, the price can drop to $3,572. However, if the trend changes, that might not happen. Instead, the cryptocurrency might rise toward $4,500.
Disclaimer
In line with the Trust Project guidelines, this price analysis article is for informational purposes only and should not be considered financial or investment advice. BeInCrypto is committed to accurate, unbiased reporting, but market conditions are subject to change without notice. Always conduct your own research and consult with a professional before making any financial decisions. Please note that our Terms and Conditions, Privacy Policy, and Disclaimers have been updated.
Source link
Victor Olanrewaju
https://beincrypto.com/ethereum-on-chain-data-warns-of-decline/
2024-12-08 21:30:00


