Ripple (XRP) has recently experienced a surge in value over the past week, similar to other altcoins. However, it faced a slight dip in the past 24 hours, a setback that, according to the XRP liquidation heatmap, appears to be temporary.
Currently priced at $0.58, XRP’s recent decline is likely a short-term pause. Here’s why this stagnation might soon reverse.
Indicators Bullish for the Ripple Native Token
According to Coinglass, XRP has several price levels and a lot of liquidity, but the most notable one is around $0.62. As seen below, the XRP liquidation heatmap color has changed from purple to a clear yellow at that level.
For those unfamiliar, the liquidation heatmap predicts price levels where large-scale liquidations might occur. It also helps traders to identify areas of high liquidity. In most cases, the higher the liquidity, the higher the chances of a price move to that region.
In XRP’s case, a high concentration of liquidity appeared around $0.57 on November 10. But since the altcoin has beaten that region, it means that the next level to reach is the next major one, which is at $0.62.
Further, the Spot Inflow/Outflow metric, which monitors token movement to and from exchanges, is another indicator suggesting a bullish outlook.
When large quantities of tokens flow into exchanges, it can signal an intent to sell, increasing downward price pressure. However, in this case, approximately $5 million worth of XRP has exited exchanges within the last 24 hours.
This outflow suggests that most XRP holders are choosing to hold rather than sell, reflecting a bullish sentiment as investors exhibit confidence in the token’s potential for further gains.

XRP Price Prediction: Rally Paused, Not Overruled
From a technical standpoint, XRP’s price moving above the 20- and 50-day Exponential Moving Averages (EMAs) indicates potential bullish momentum. These EMAs often serve as support and resistance levels, and a price rise above them indicates a bullish trend.
If XRP’s price was below them, then the trend would have been bearish. Therefore, the current reading suggests that XRP could be set up for a further upswing. If that remains the case and buying pressure grows, the altcoin’s value might rise by another 7% to $0.62.
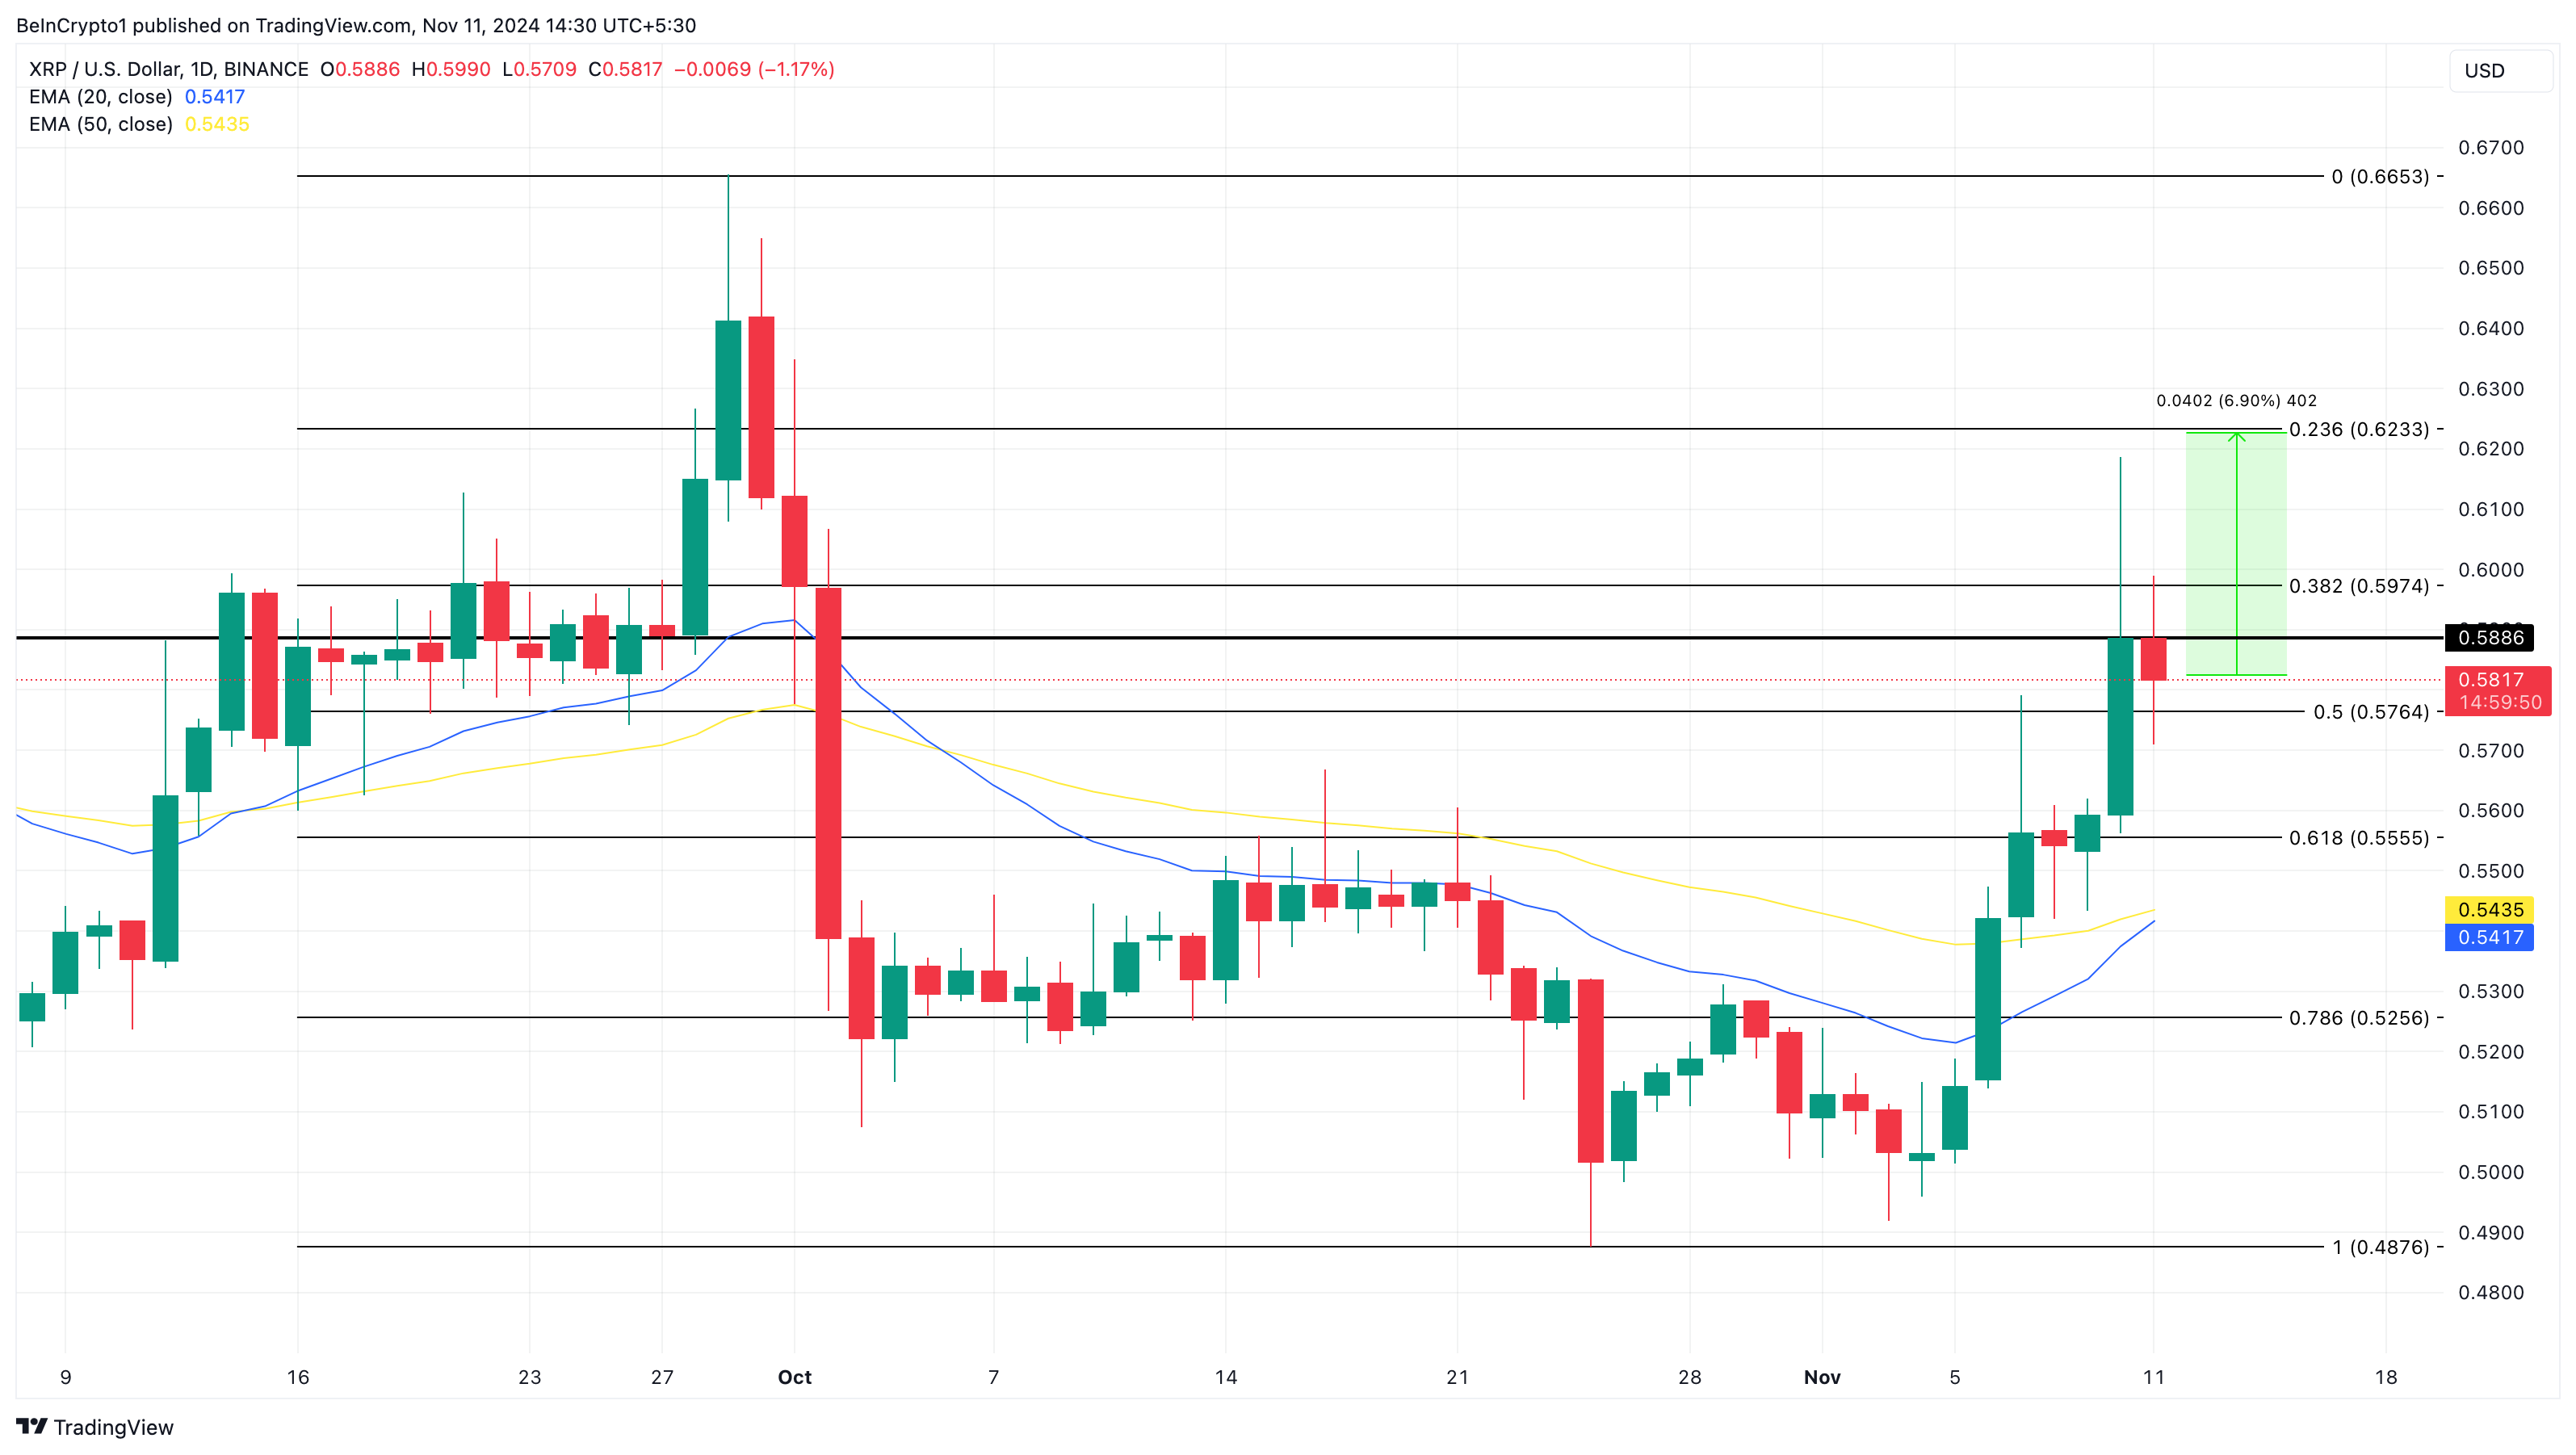
Interestingly, this position is also where the crucial 23.6% Fibonacci level lies. However, if the liquidation heatmap shows a movement of liquidity to a lower area, then the altcoin value might sink. In that scenario, XRP’s price might drop to the 61.8% Fibonacci level at $0.55.
Disclaimer
In line with the Trust Project guidelines, this price analysis article is for informational purposes only and should not be considered financial or investment advice. BeInCrypto is committed to accurate, unbiased reporting, but market conditions are subject to change without notice. Always conduct your own research and consult with a professional before making any financial decisions. Please note that our Terms and Conditions, Privacy Policy, and Disclaimers have been updated.
Source link
Victor Olanrewaju
https://beincrypto.com/xrp-liquidation-heatmap-hints-at-surge/
2024-11-11 13:00:00


