After a brief consolidation near the critical $4K resistance level, Ethereum encountered increased selling pressure, leading to a decline. However, a significant support zone lies ahead, which may curb further downward movement.
By Shayan
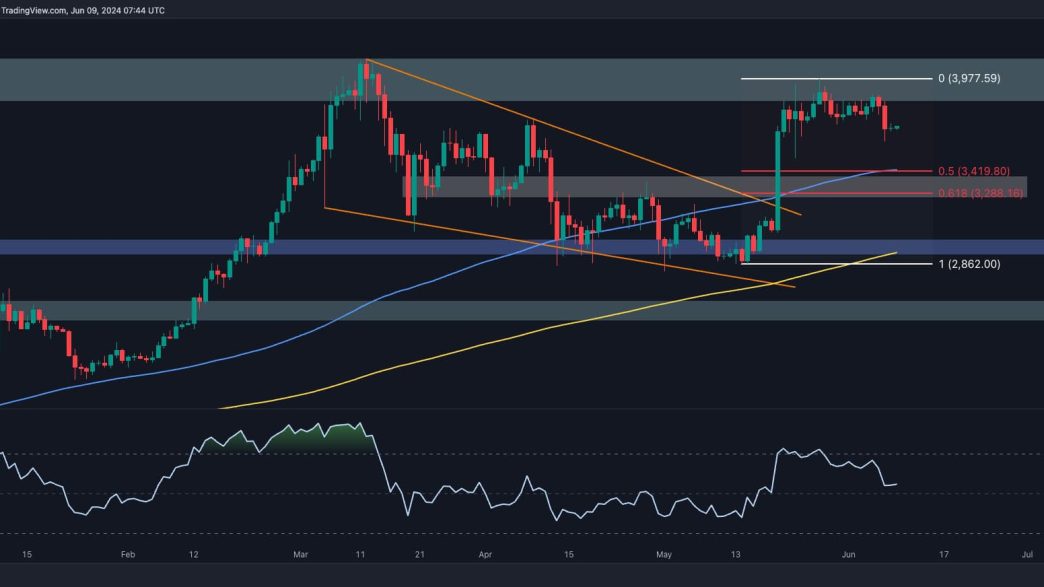
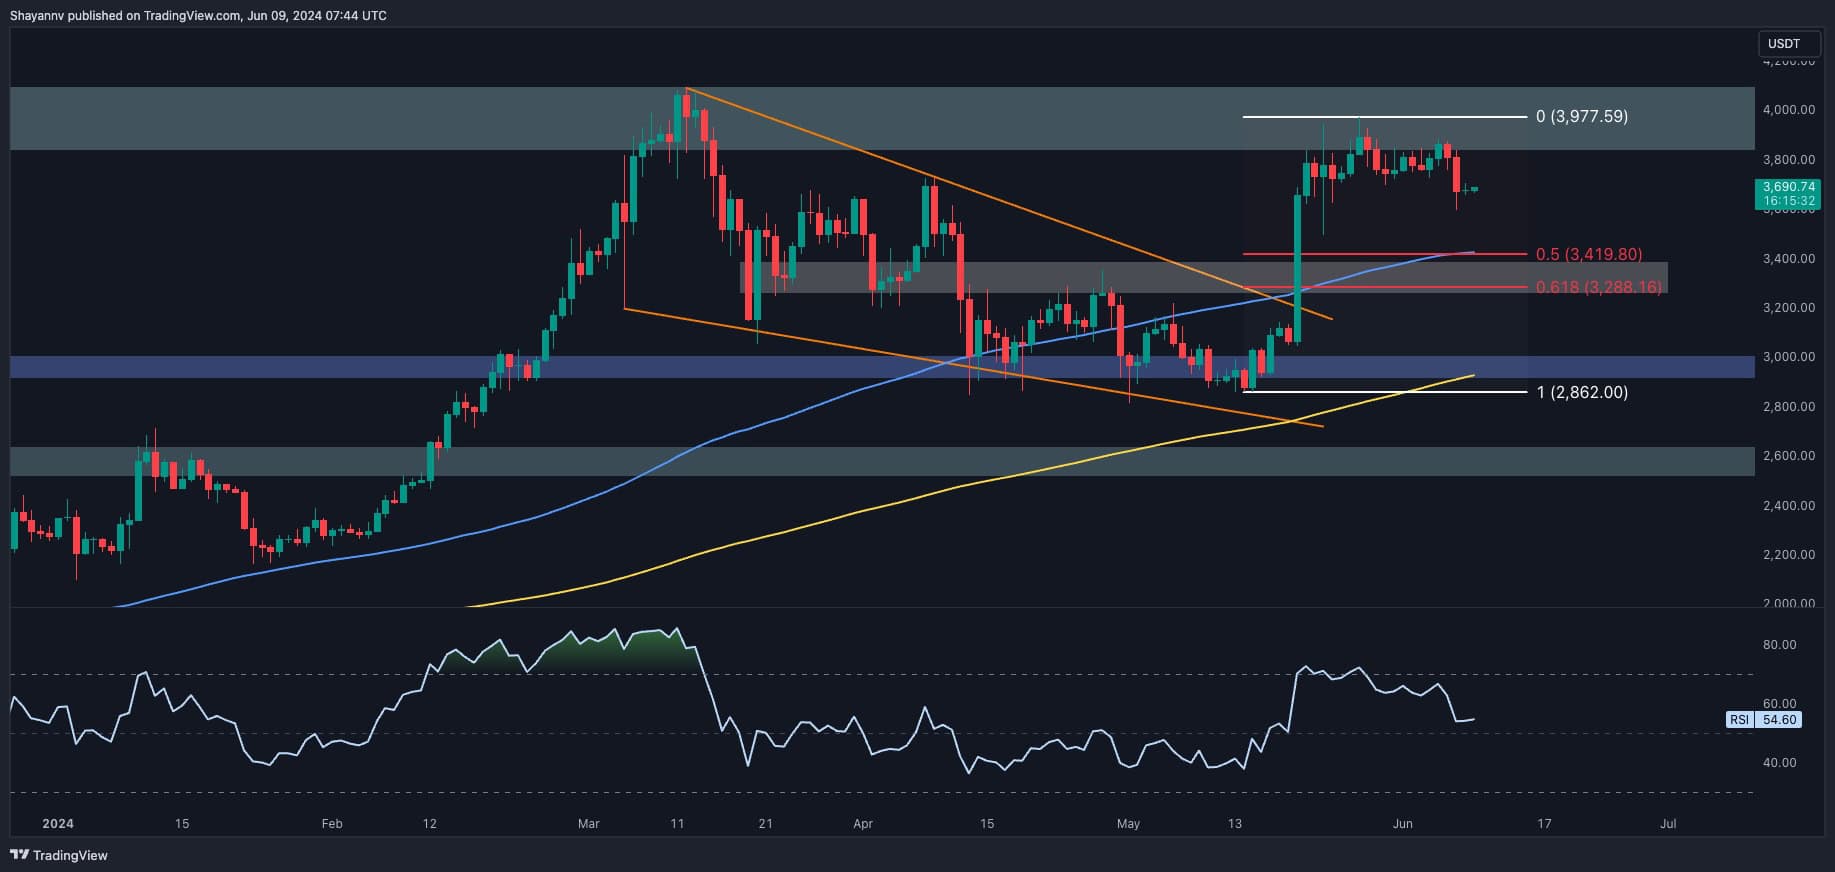
The Daily Chart
A closer look at the daily chart shows that after a short period of consolidation near the pivotal $4K resistance, Ethereum faced heightened selling activity, resulting in a notable rejection. This indicates strong selling interest around the previous major swing high of $4K, highlighting aggressive short positions near this key level.
Nonetheless, there is a significant support zone ahead, including the 100-day moving average at $3,430 and the 0.5 Fibonacci retracement level at $3,419. This suggests that the current price action may continue its bearish retracement in the short term, with the 100-day moving average and the 0.5 Fib level acting as primary support for buyers.
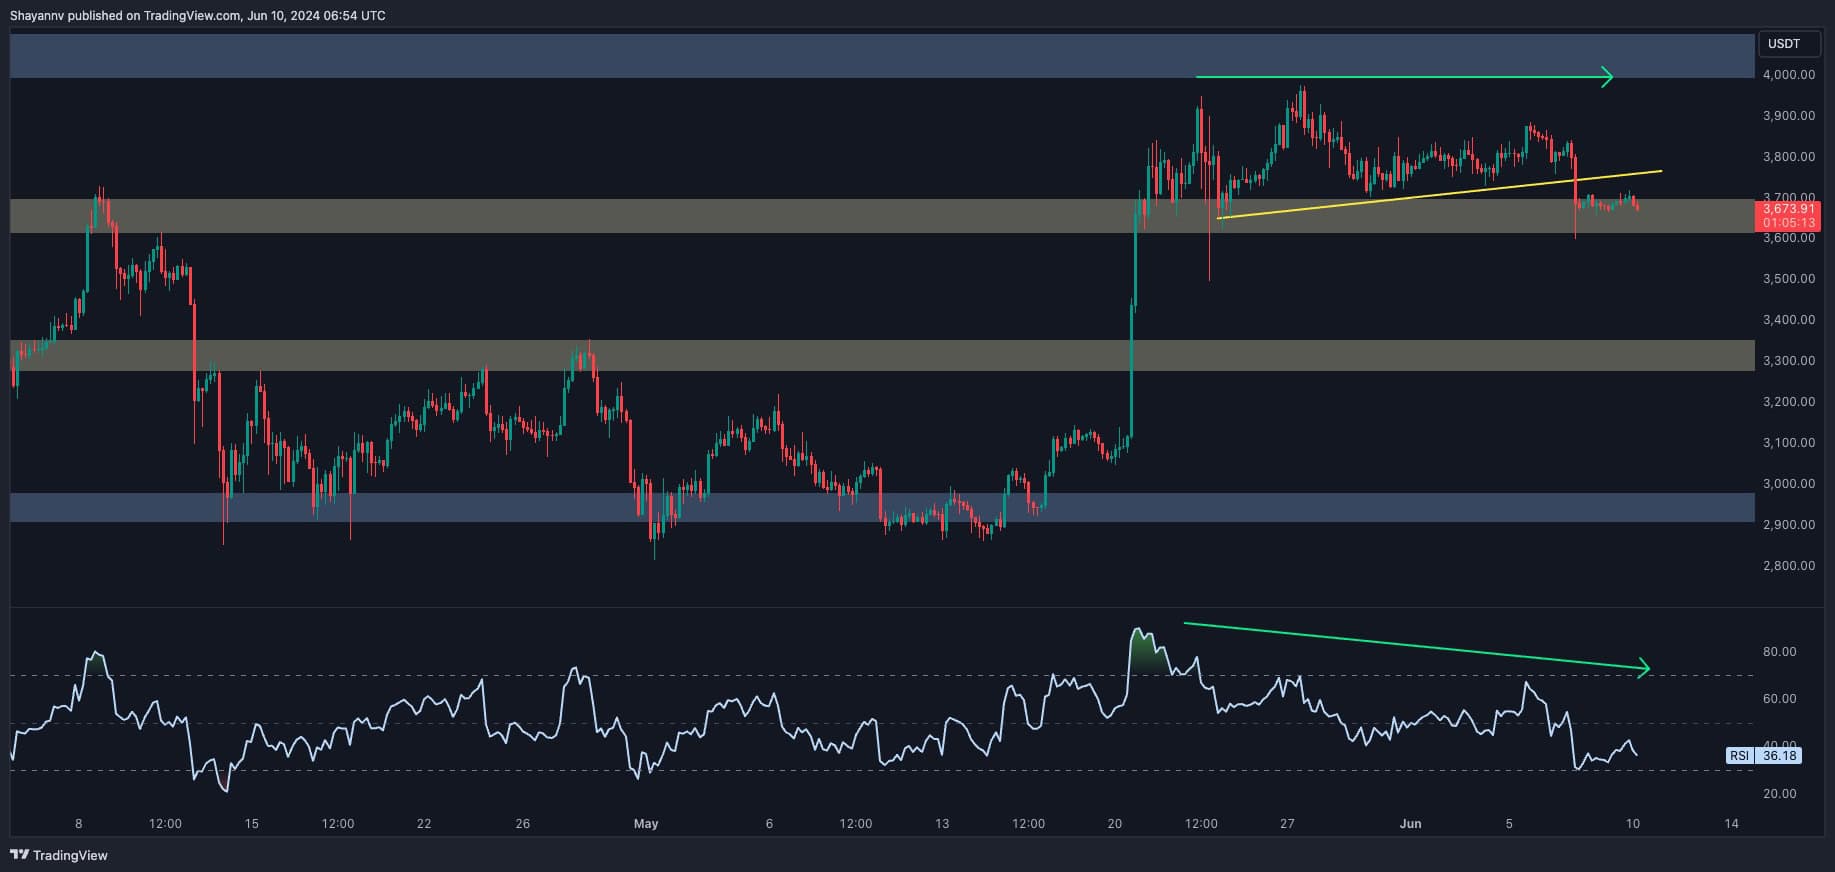
The 4-Hour Chart
On the 4-hour chart, recent consolidation near the $4K level has resulted in a head and shoulders pattern, indicating a lack of bullish momentum and an increase in supply. This well-known pattern suggests a potential short-term bearish reversal. Nevertheless, the price has recently broken below the neckline of this formation, increasing the likelihood of a bearish scenario.
Additionally, a bearish divergence between the RSI indicator and the price further emphasizes seller dominance, raising concerns about Ethereum’s future trajectory.
Currently, the price is at a critical support level of around $3.6K. If sellers manage to breach this pivotal level, continuing the bearish trend is the most likely outcome.
By Shayan
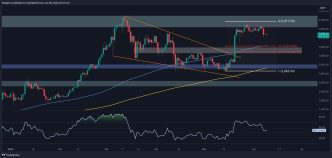
With Ethereum’s price struggling to surpass the $4K mark, traders might be interested in the behavior of futures market participants.
The chart below shows the 7-day moving average of the Taker Buy Sell Ratio, which assesses the relative aggressiveness of buyers versus sellers. A value above one suggests buyer dominance, while a value below one indicates aggressive selling.
As illustrated in the chart, the ratio has failed to rise above one and has been declining sharply in recent days. This trend suggests that the majority of futures traders have been selling Ethereum aggressively, either for speculative purposes or to realize profits. This significant drop in the metric is a bearish signal, suggesting that the current downward retracement could persist if this trend continues.

Binance Free $600 (CryptoPotato Exclusive): Use this link to register a new account and receive $600 exclusive welcome offer on Binance (full details).
LIMITED OFFER 2024 at BYDFi Exchange: Up to $2,888 welcome reward, use this link to register and open a 100 USDT-M position for free!
Disclaimer: Information found on CryptoPotato is those of writers quoted. It does not represent the opinions of CryptoPotato on whether to buy, sell, or hold any investments. You are advised to conduct your own research before making any investment decisions. Use provided information at your own risk. See Disclaimer for more information.
Cryptocurrency charts by TradingView.